With a new administration installed in the US and a $1.9trln relief package approved, attention has now turned to how this fiscal largesse will be paid for. I thought this article from September 2020 might add to the debate.


With a new administration installed in the US and a $1.9trln relief package approved, attention has now turned to how this fiscal largesse will be paid for. I thought this article from September 2020 might add to the debate.

![]()
Macro Letter – No 127 – 13-03-2020
Epidemics, Economic Growth and Stock-market Performance – An Historical Perspective
As I write this article I am conscious that the Coronavirus is a very real and global tragedy. In all that follows I do not wish to detract from the dreadful human cost of this disaster in any way.
Putting the current pandemic in perspective, according to a 2017 estimate from the US Center for Disease Control, in a normal year, seasonal flu kills 291,000 to 646,000 globally. By contrast, the fatality rate for coronavirus seems to have stabilised at around 3.6% of those diagnosed. Of course, a more heartening figure of 0.79% can be found in South Korea which has tested almost 10 times more of its population than other country:-
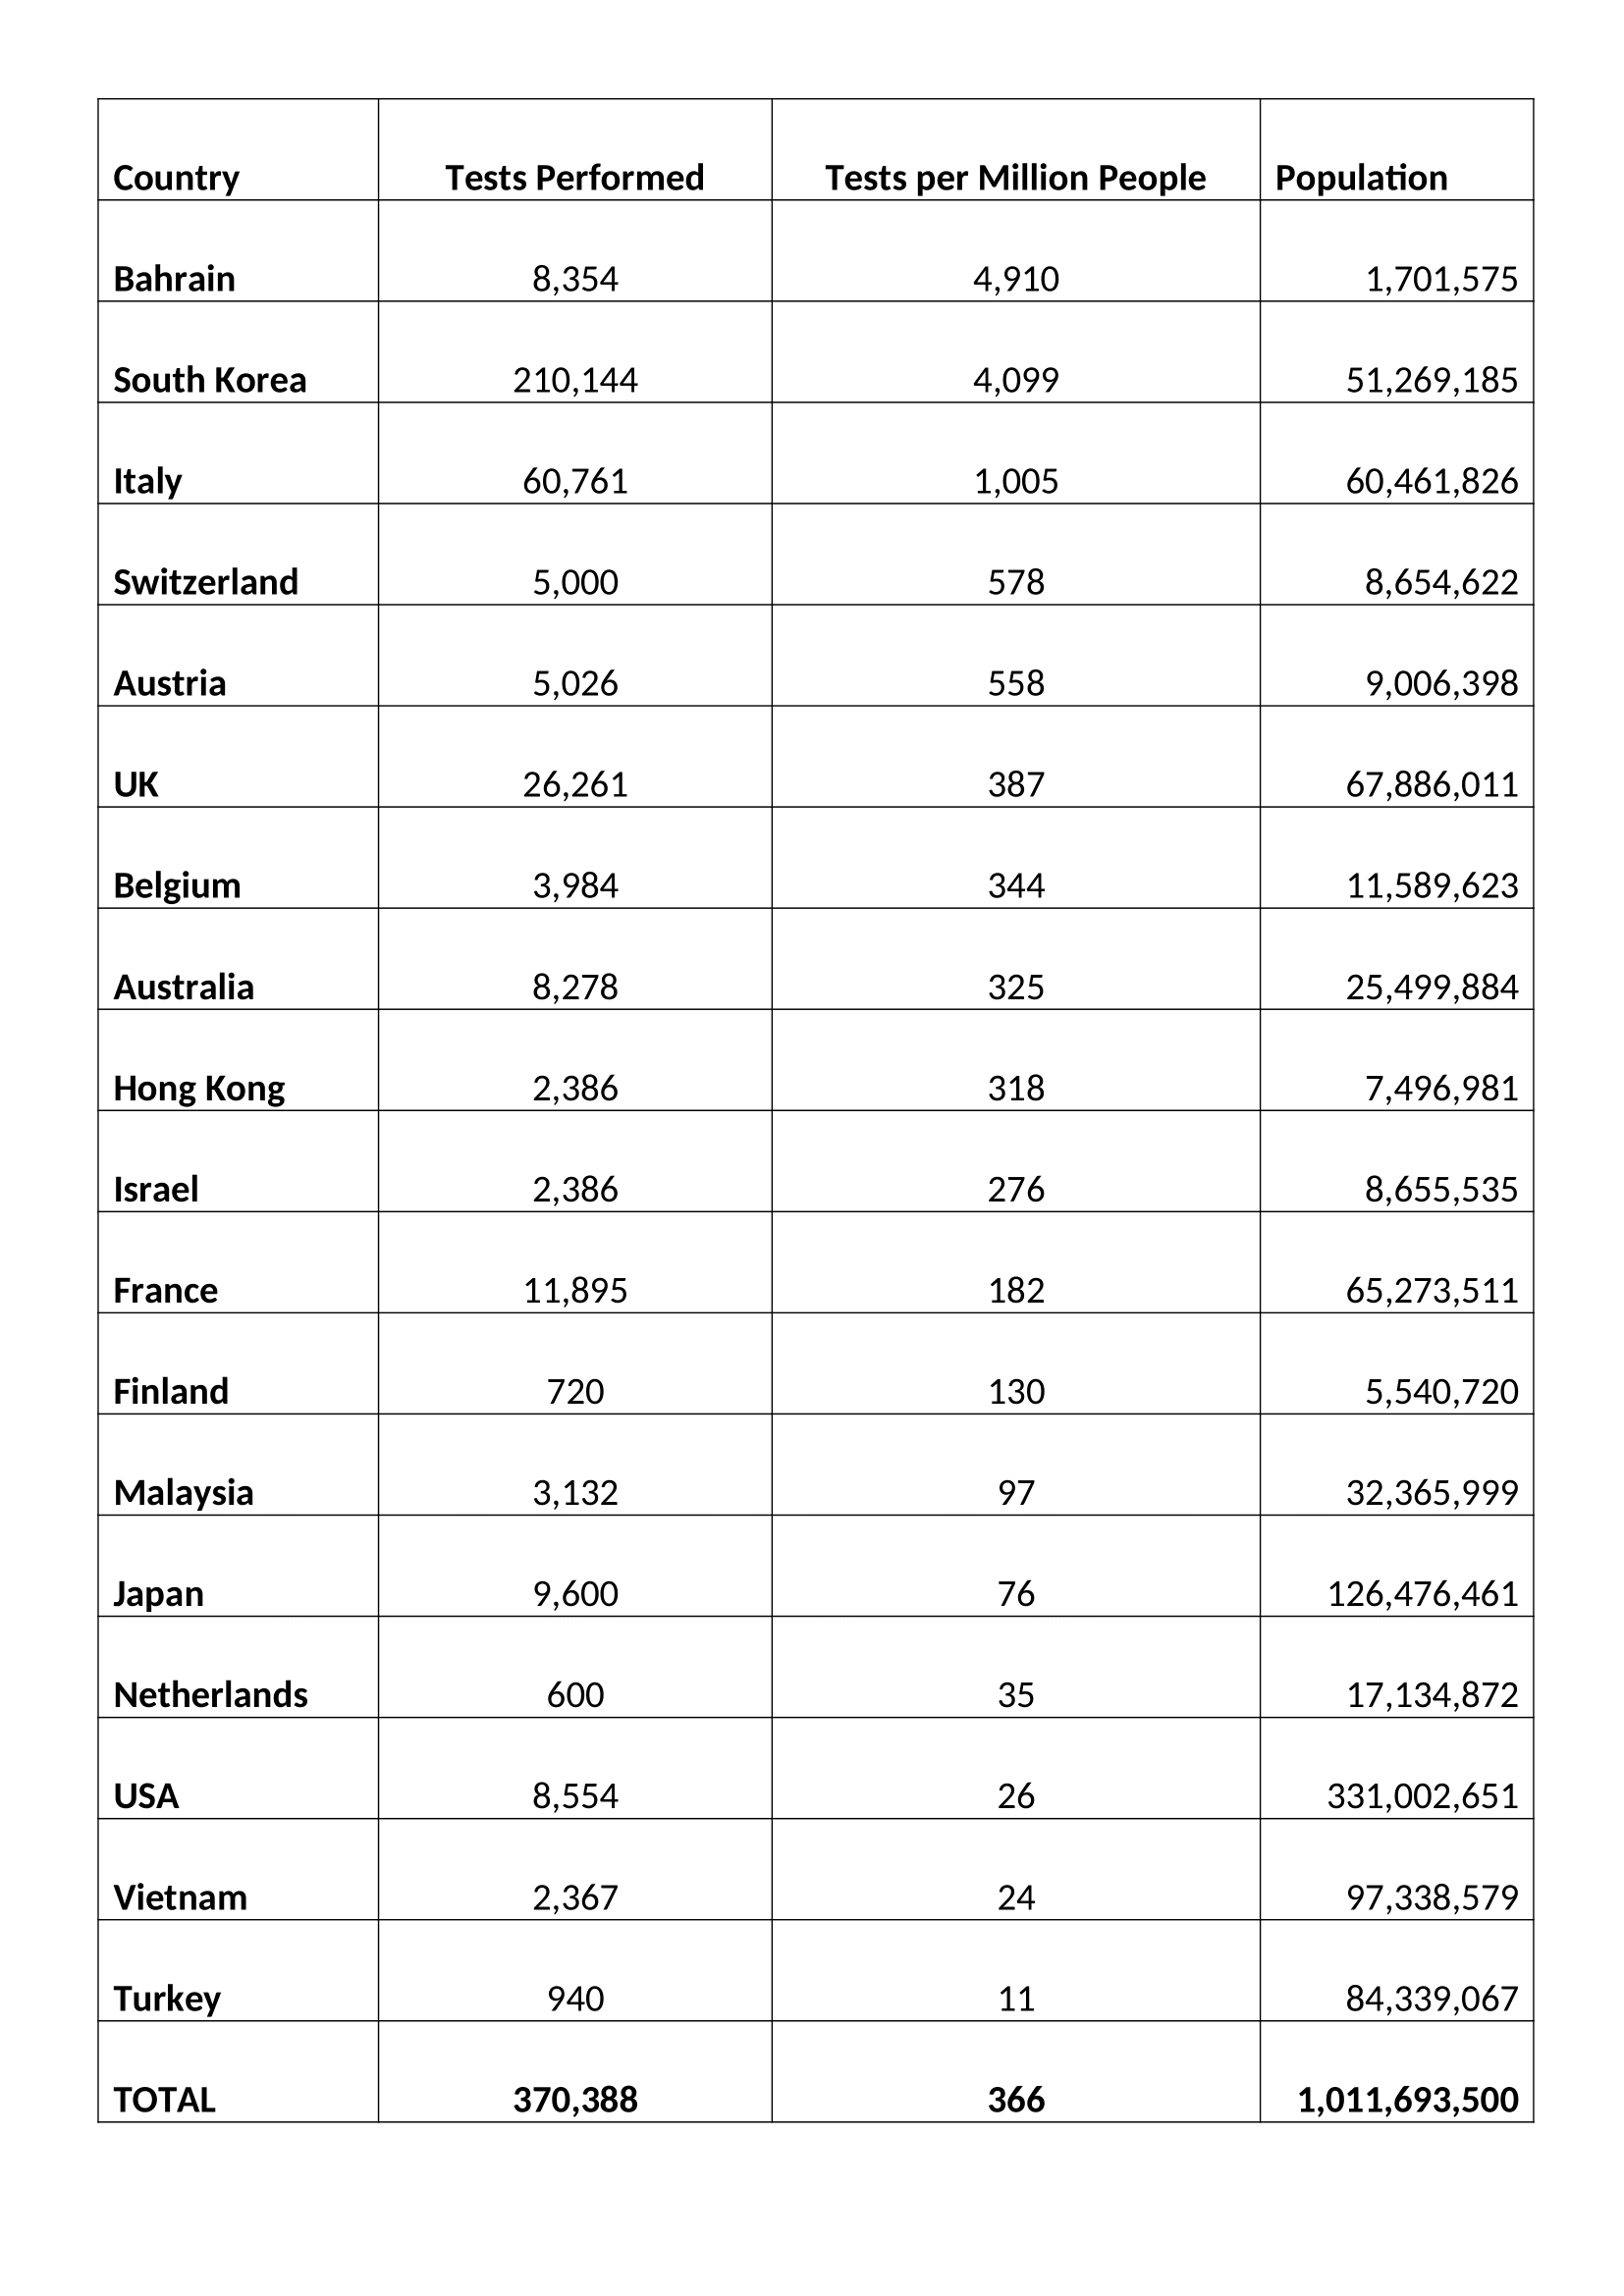
Source: Worldometer.com
Suffice to say the current statistics are still confusing at best, but they are all we have to work with.
In a recent interview Dr Soumaya Swaminathan of the World Health Organisation (WHO) provided some insights (emphasis is mine): –
Of 44,000 Wuhan patients 80% had very mild symptoms, 15% of cases are severe and 5% critical. In terms of transmission rates, the R0 is still just an estimate of between 2 and 3 – in other words for every carrier between two and three people are infected.
…Two drugs, an antiretroviral called Lopinavir-ritonavir and an experimental drug used in the treatment of Ebola – Remdesivir, manufactured by Gilead (GILD) – are being tested in China where more than 80 clinical trials are already underway. The development of an effective vaccine it several months away.
It was reported today (11-3-2020) that Gilead has begun trails with US nationals and signed a deal with the US military.
Market Impact
Given the continued lack of clarity about COVID-19 in terms of numbers infected and numbers suffering, it may seem futile to attempt to gauge the potential economic impact of the current Coronavirus outbreak. History, however, may be able to provide some guidance to investors who might otherwise be tempted to liquidate and hibernate, especially after the dramatic decline this week in the wake of Saudi Arabia’s decision to turn its back on the OPEC cartel.
In order to begin this assessment, there are a vast array of factors which need to be considered. Here are just a few: –
Each of these factors are complex and warrant an essay to themselves. Suffice to say, the economic impact is already becoming evident. Schools, factories and offices are closing. Those workers that can are beginning to work remotely. At the extreme, entire cities, towns and countries are being subjected to lock-downs. In these conditions, economic activity inevitably suffers, this is a supply and demand shock combined. The price of crude oil has already responded, encouraged by the actions of Saudi Arabia, it has collapsed. Transportation activity has been substantially reduced. Economic indicators from China point to a pronounced contraction in 2020 GDP growth. Will the pattern seen in China be repeated elsewhere? Are the nascent indications of a resumption of economic activity now evident in China a reliable indication of the speed of recovery to be expected elsewhere? The jury is still out.
For G20 countries the effect of the 2008/2009 financial crisis still lingers. According to a BIS report more than 12% of developed nation firms generate too little income to cover their interest payments. Meanwhile, at the individual level, the Federal Reserve estimates that more than 10% of American adults would be unable to meet a $400 unexpected expense, equivalent to around two days’ work at average earnings. There is concern among governments that people may start to hoard cash if the crisis deepens.
Where the viral epidemic began, in China, the Purchasing Managers Index for February was the lowest since the series began in 2004. According to China Beige Book’s flash survey for February, 31% of companies were still closed and many of those that have reopened lacked staff or materials. Other estimates suggest that between 40% and 50% of the China’s truck fleet remains idle – those essential materials are unlikely to be delivered anytime soon. This supply-shock slowdown has inevitably fuelled expectations of an actual contraction in the size of the Chinese economy, the first shrinkage since the death of Mao Zedong in 1976: –
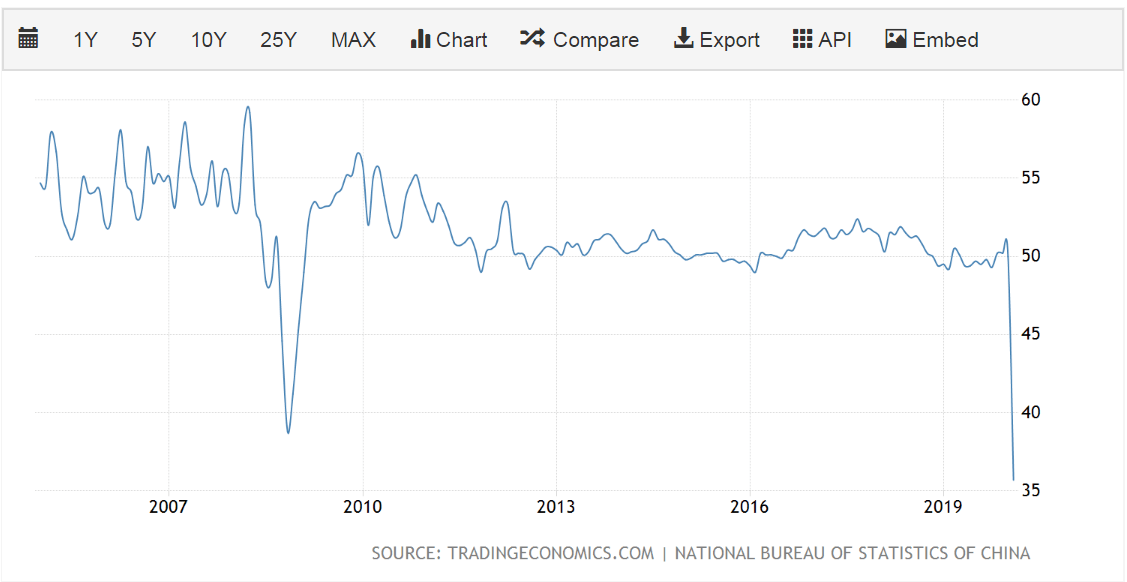
Source: Trading Economics
Everywhere GDP forecasts are being revised lower: –
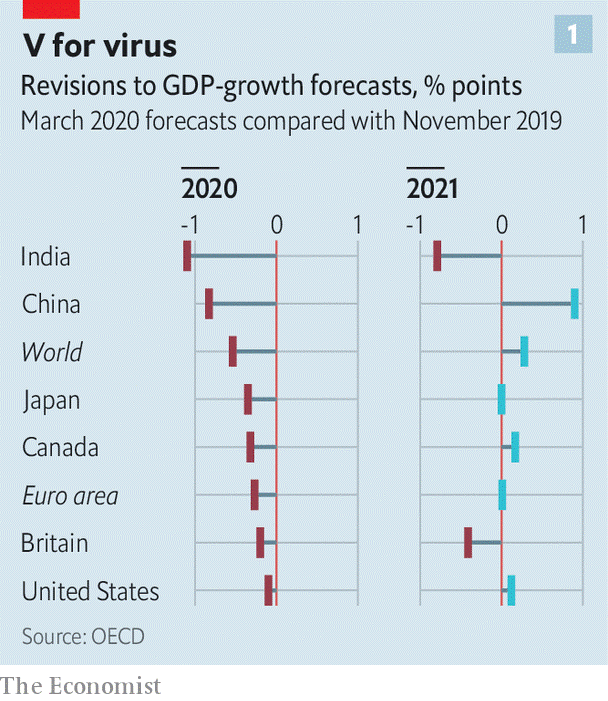
Source: Economist
Policy Response
For the world’s governments there are essentially three policy responses: –
Central banks are limited in their ability to lend directly to firms, meanwhile the banking system, petrified by the recent widening of credit spreads for sub-investment grade debt, is likely to become a bottleneck. It will take more than gentle persuasion to force banks to lend new funds and reschedule existing non-performing loans. Other aid to corporates and individuals requires varying degrees of fiscal stimulus. Governments need to act quickly (today’s UK budget is an indication of the largesse to follow) it would also help if there were a coordinated global policy response.
The Peterson Institute – Designing an effective US policy response to coronavirus make the following suggestions: –
A first step is to lock in adequate public funding. In 2014, emergency funding of about $5.4 billion was provided to fight the Ebola outbreak. Much more than that should be provided today, given the apparently greater transmissibility of COVID-19 and the fact that it has already appeared in many locations around the United States and more than 60 countries around the globe.
…A classic recession involves a shortfall of demand relative to supply. In that more ordinary situation, economic policymakers know how to help fill in the missing demand. But this case is more complicated because it involves negative hits to both supply and demand.
…No one knows how serious the economic damage from COVID-19 will be, so a key challenge is to design a fiscal countermeasure that clicks on when it’s needed and clicks off when it’s not. One approach that would fit that description would be to move immediately to pre-position a temporary cut in the payroll taxes that fund the Social Security and Medicare programs…
The final suggestion is a US-centric proposal, it is different from the income tax cut alluded to by President Trump and will directly benefit lower-income families, since healthcare costs will be a larger proportion of their after tax income. The authors’ propose a similar mechanism to click in when the unemployment rates rises and click off when re-employment kicks back in.
The table below shows actions taken by 4th March: –
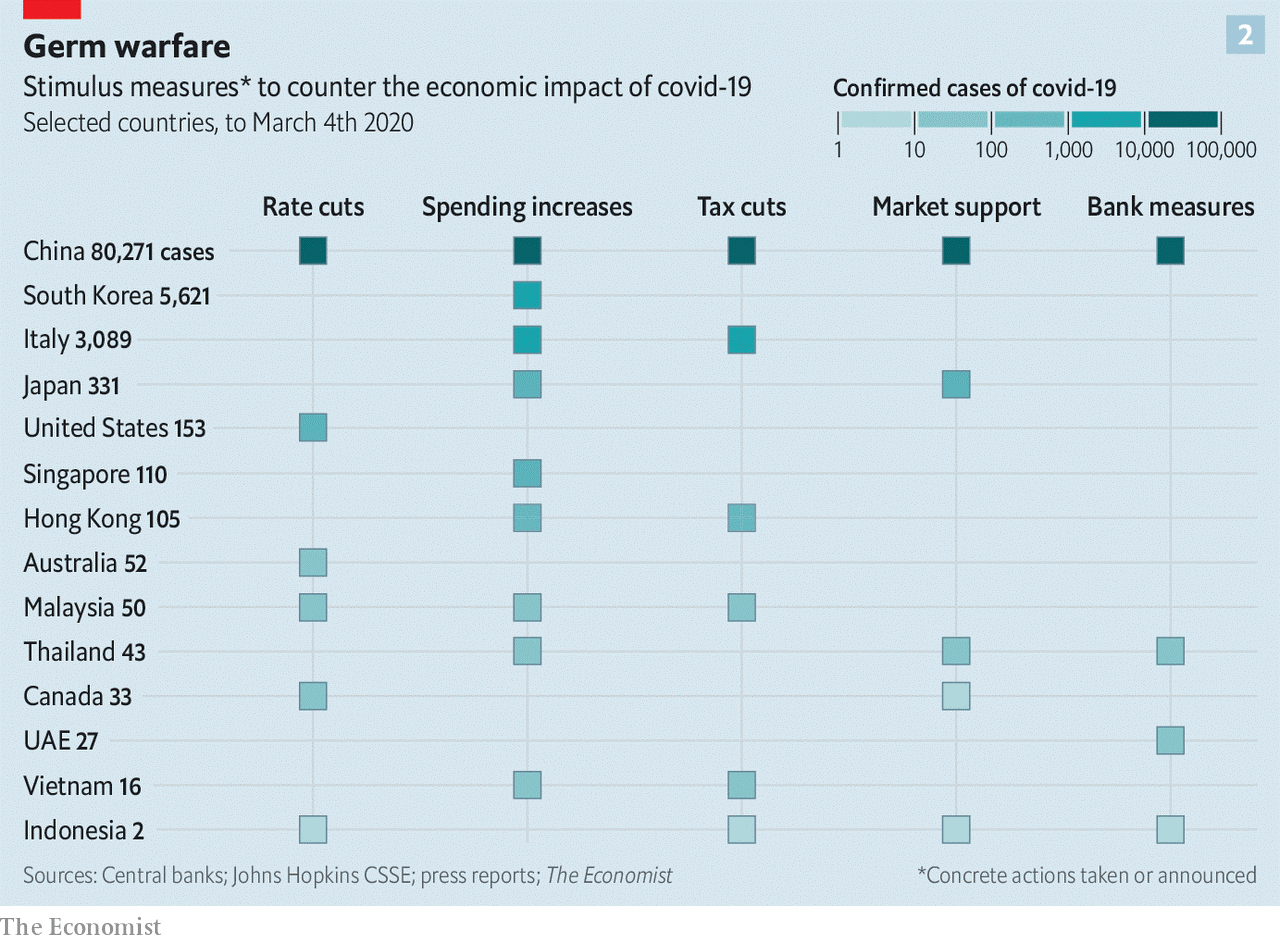
Source: Economist
It is worth mentioning that Hong Kong, still reeling from the civil unrest of last year, has pressed ahead with ‘helicopter money’ sending cheques to every tax payer. This approach may be more widely adopted elsewhere over the coming weeks.
The Spanish Flu
In an attempt to find an historical parallel for the current Corona outbreak, there are only two episodes which are broadly similar, the Black Death of 1347 to 1351 and the Spanish Flu of 1918 to 1919. Data from the middle ages is difficult to extrapolate but it is thought that the Plague wiped out between 20% and 40% of Europe’s population. The world population is estimated to have fallen from 475mnl to between 350mln and 375mln. The world economy shrank, but, if data for England is any guide, per capita economic activity increased and the economic wellbeing of the average individual improved. For more on this topic I would recommend a working paper from the Federal Trade Commission – The English Economy Following the Black Death by Judith R. Gelman -1982.
The Spanish Flu of 1918 was the next global pandemic. It began in August of 1918, three month prior to the end of the First World War, and, by the time it had ended, in March of 1919, it had infected 500mln out of a global population of 1.8bln. The fatality rate was high, 40mln people lost their lives. Following the war, which cost almost 20mln lives, the combined loss of life was similar in absolute terms to the Black Death although in percentage terms the fatality rate was only 2%.
An excellent assessment of the Spanish epidemic can be found in the Economic Effects of the 1918 Influenza Pandemic – Thomas A. Garrett – Federal Reserve Bank of St Louis – 2007 – here are some key findings: –
The possibility of a worldwide influenza pandemic… is of growing concern for many countries around the globe. The World Bank estimates that a global influenza pandemic would cost the world economy $800 billion and kill tens-of-millions of people. Researchers at the U.S. Centers for Disease Control and Prevention calculate that deaths in the United States could reach 207,000 and the initial cost to the economy could approach $166 billion, or roughly 1.5 percent of the GDP. Longrun costs are expected to be much greater. The U.S. Department of Health and Human Services paints a more dire picture—up to 1.9 million dead in the United States and initial economic costs near $200 billion.
…Despite technological advances in medicine and greater health coverage throughout the 20th century, deaths from a modern-day influenza pandemic are also likely to be related to race, income and place of residence.
The Spanish-flu was different from COVID-19 in that the highest mortality was among those aged 18 to 40 years and was often found among those with the strongest immune systems.
Garrett goes on to assess the economic impact with the aid stories from newspapers and the limited amount of previously published (and some unpublished) research. National statistics on unemployment and economic activity had yet to be compiled, but the simultaneous supply and demand shocks were broadly similar to the patterns we are witnessing today.
…One research paper examines the immediate (short-run) effect of influenza mortalities on manufacturing wages in U.S. cities and states for the period 1914 to 1919. The testable hypothesis of the paper is that
influenza mortalities had a direct impact on wage rates in the manufacturing sector in U.S. cities and states during and immediately after the 1918 influenza. The hypothesis is based on a simple economic model of the labor market: A decrease in the supply of manufacturing workers that resulted from influenza mortalities would have had the initial effect of reducing manufacturing labor supply, increasing the marginal product of labor and capital per worker, and thus increasing real wages. In the short term, labor immobility across cities and states is likely to have prevented wage equalization across the states, and a substitution away from relatively more expensive labor to capital is unlikely to have occurred.
The empirical results support the hypothesis: Cities and states having greater influenza mortalities experienced a greater increase in manufacturing wage growth over the period 1914 to 1919.
Another study explored state income growth for the decade after the influenza pandemic using a similar methodology. In their unpublished manuscript, the authors argue that states that experienced larger numbers of influenza deaths per capita would have experienced higher rates of growth in per capita income after the pandemic. Essentially, states with higher influenza mortality rates would have had a greater increase in capital per worker, and thus output per worker and higher incomes after the pandemic. Using state-level personal income estimates for 1919-1921 and 1930, the authors do find a positive and statistically significant relationship between state-wide influenza mortality rates and subsequent state per capita income growth.
Aside from wages, however the author concludes: –
…Most of the evidence indicates that the economic effects of the 1918 influenza pandemic were short-term. Many businesses, especially those in the service and entertainment industries, suffered double-digit losses in revenue. Other businesses that specialized in health care products experienced an increase in revenues.
How did financial markets react? The chart below shows the Dow Jones Industrial Average over the period from 1918 to 1923. The shaded areas indicate recessions: –
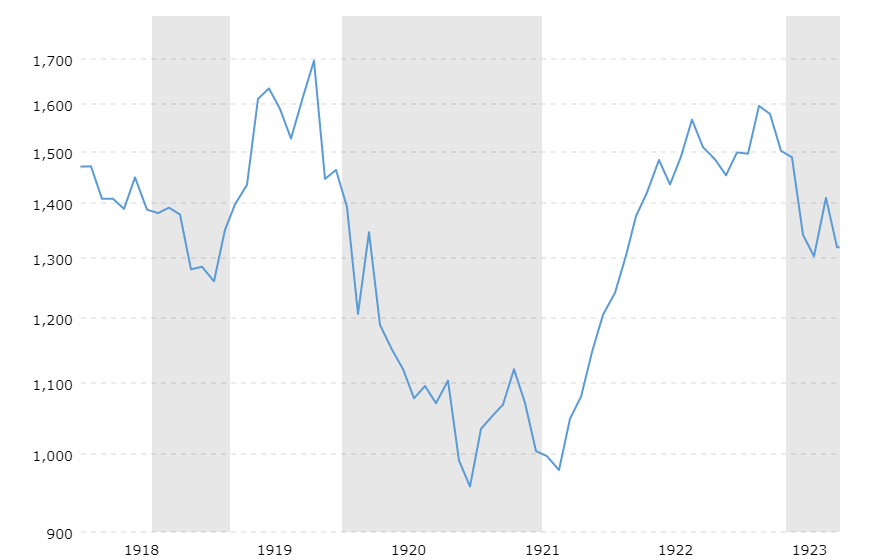
Source: Macrotrends
When reinvested dividends are included, the total return of the Dow Jones Industrial Average in 1918 was 10.5%, despite influenza wiping out 0.4% of the US population. Fears about a slowdown in economic activity, resulting from the end of WWI, were the underlying cause of the brief recession which coincided with the pandemic, the stock market had already reacted, dipping around 10% earlier in the year. The subsequent recession of 1920 had other causes.
As is evident from the chart below, the newly created (1913) Federal Reserve felt no compunction to cut interest rates: –
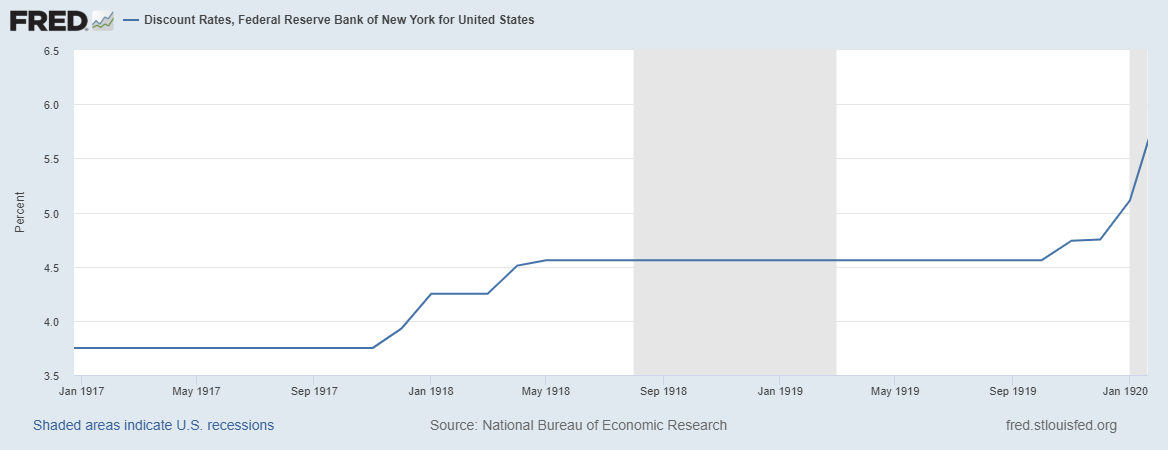
Source: Federal Reserve Bank of St Louis
US 10 year Treasury Bonds simply reflected the actions of the Federal Reserve: –
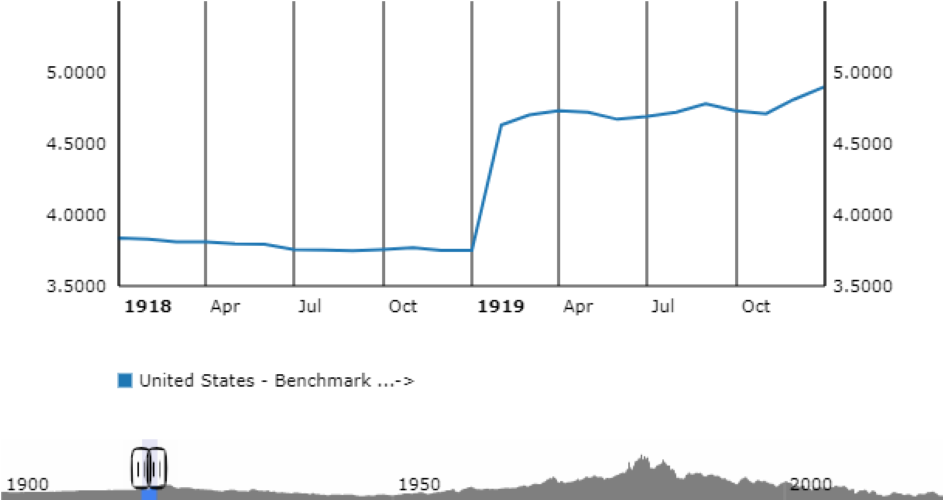
Source: ECB
One is forced to concede, financial markets behaved in a very different manner 100 years ago, but they may yet have something to teach us about the global impact of a pandemic – that it is an economic interruption rather than a permanent impediment to progress.
Conclusions and investment opportunities
Whilst there are similarities between the Spanish Flu of 1918 and the COVID-19 pandemic of today, there are also profound differences. Urban areas, for example, are expected to suffer higher fatalities than rural areas today. In 1919 only 51% of the population of the US was urban, today it is above 80%. Population density has also increased three-fold over the last century, if 500mln were infected in 2018/2019 then the comparable figure today would be 1.5bln. Changes in the ease of transportation mean that the spread of a pandemic will be much more rapid today than in the first quarter of the 20th century. Tempering this gloom, for many people, communications have transformed the nature of work. Many aspect of business can now be transacted remotely. Unlike in 1918 self-isolation will not bring commerce to a standstill.
The economic impact will also be felt more rapidly. Supply chains have been optimised for efficiency, they lack resilience. Central banks have already begun to cut interest rates (where they can) and provide liquidity. Governments have picked up the gauntlet with a range of fiscal measures including tax cuts and benefit payments.
Many commentators are calling the COVID-19 pandemic a Black Swan event, yet SARS (2003), H1N1 (2009), and MERS (2012) preceded this outbreak. Predictions that just such an event would occur have been circulating for more than a decade.
Financial markets have behaved predictably. The oil price has collapsed as Saudi Arabia has broken with the OPEC cartel, stocks have fallen (especially those related to oil) and government bonds have rallied. Gold, which saw significant inflows during the last few years, has vacillated as holders have liquidated to meet commitments elsewhere even as new buyers have embraced the time-honoured ‘safe haven.’ Looking ahead, we do not know how long this pandemic will last nor how widespread it will become. The two prior pandemics of a similar stature provide little useful guidance, the Spanish Flu lasted seven months, the Black Death, by contrast, spread over more than four years and was still flaring up into the 17th century.
Expectations of a cure and a vaccine remain a matter of conjecture, but epidemiologists suggest that within a year we will have a viable solution. At the time of writing (Wednesday 11th March) the total number of infections has reached 120,588, there have been 4,365 deaths while 66,894 patients have recovered – a 55.47% recovery rate, although the Chinese recovery rate has been steadily rising and now stands at 76.22%. The global fatality rate is 3.62%, whilst individual country fatality rates range from Italy at 6.22% to South Korea (where 210,000 people have been tested – ten times the per capita global average) at a heartening 0.79%. The WHO still expect the fatality rate to stabilise at around 1% which implies that 99% should eventually recover.
Whilst a larger correction in stocks should not be ruled out, the relative lack of selling pressure suggests that investors are prepared to reappraise their estimates of what price to earnings they will accept – remember interest rates have been cut and will probably be cut again. Where rates can be lowered no further, quantitative easing (including the purchase of stocks) and fiscal stimulus will aim to preserve value.
The historical evidence of the Spanish Flu suggests this pandemic will be short-lived. The recent market correction may prove sufficient but, with only two data points in more than 600 years, it is unwise to assume that it will not be different this time. Defensive equity strategies which focus on long-term value have been out of favour for more than a decade. Good companies with strong balance sheets and low levels of debt are well placed to weather any protracted disruption. They may also benefit from rotation out of index funds. When markets stabilise, the reduced level of interest rates will see a renewed wave of capital pouring into stocks. The only question today is whether there will be another correction or whether now is the time to buy.

![]()
Macro Letter – No 125 – 17-01-2020
US Bonds – 2030 Vision – A decade in the doldrums
Having reached their yield low at 1.32% in July 2016, US 10yr bond yields have been locked in, just shy of, a 2% range for the last two and half years (subsequent high 3.25% and low 1.43%). For yields to fall again, supply must fall, demand rise or central banks, recommence their experimental monetary policies of negative interest rates and quantitative easing. For yields to rise, supply must rise, demand fall or central banks, reverse their multi-year largesse. Besides supply, demand and monetary policy there are, however, other factors to consider.
Demographics
One justification for a rise in US bond yields would be an uptick in inflationary pressure. Aging demographic have been the principal driver of the downward trajectory of secular inflation. During the next decade, however, Generation Y borrowing will accelerate whilst Generation X has yet to begin their aggressive saving spree. The table below looks at the borrowing and saving patterns of the demographic cohorts in the US: –
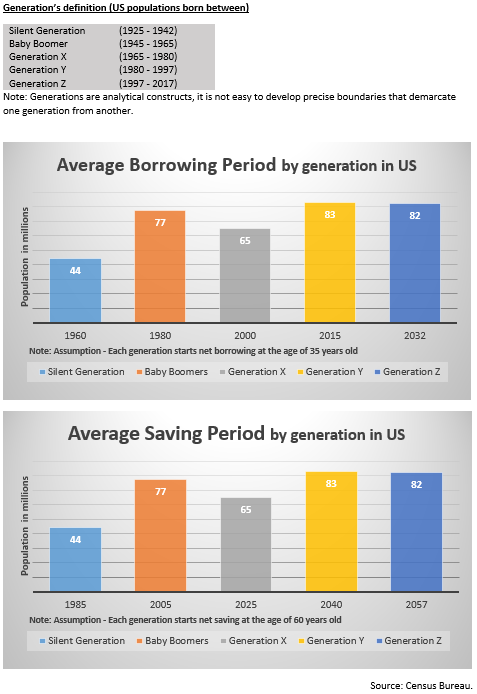
Source: US Census Bureau
Excepting the obesity and opioid epidemics, life expectancy will, nonetheless, continue to extend. The Gen Y borrowing binge will not override the aging demographic effect. It’s influence on the inflation of the next decade is likely to be modest (on these grounds alone we will not see the return of double-digit inflation) and the longer term aging trend, bolstered by improvements in healthcare, will return with a vengeance during the 2030’s, undermining the last vestiges of current welfare provisions. Much more saving will be required to pay for the increasing cost of healthcare and pensions. With bond yields of less than 4%, an aging (and hopefully healthier) population will need to continue working well beyond current retirement age in order to cover the shortfall in income.
Technology
Another secular factor which has traditionally kept a lid on inflation has been technology. As Robert Solo famously observed back in 1987, ‘You can see the computer age everywhere but in the productivity statistics.’ Part of the issue is that productivity is measured in currency terms. If the price of a computer remains unchanged for a decade but its capacity to compute increases 10-fold over the same period, absent new buyers of computers, new sales are replacements. In this scenario, the improvement in productivity does not lead to an uptick in economic growth, but it does demonstrably improve our standard of living.
Looking ahead the impact of machine learning and artificial intelligence is just beginning to be felt. Meanwhile, advances in robotics, always a target of the Luddite fringe, have been significant during the last decade, spurred on by the truncation of global supply chains in the wake of the great financial crisis. This may be to the detriment of frontier economies but the developed world will reap the benefit of cheaper goods.
Central Bank Omnipotence
When Paul Volcker assumed the helm of the Federal Reserve in the late 1970’s, inflation was eroding any gains from investment in government bonds. Armed with Friedman’s monetary theories, the man who really did remove the punch-bowl, raised short-term rates to above the level of CPI and gradually forced the inflation genie back into its bottle.
After monetary aggregate targets were abandoned, inflation targeting was widely adopted by many central banks, but, as China joined the WTO (2001) and exported their comparative advantage in labour costs to the rest of the world, those same central bankers’, with Chairman Bernanke in the vanguard, became increasingly petrified by the prospect of price deflation. Memories of the great depression and the monetary constraints of the gold exchange standard were still fresh in their minds. For an economy to expand, it was argued, the supply of money must expand in order to maintain the smooth functioning of markets: a lack of cash would stifle economic growth. Inflation targets of around 2% were deemed appropriate, even as technological and productivity related improvements insured that the prices of many consumer goods actually declined in price.
Inflation and deflation can be benign or malign. Who does not favour a stock market rally? Yet, who cares to witness their grocery bill spiral into the stratosphere? Who cheers when the latest mobile device is discounted again? But does not panic when the value of their property (on which the loan-to-value is already a consumption-sapping 90%) falls, wiping out all their equity? Blunt inflation targeting is frankly obtuse, but it remains the mandate of, perhaps, the most powerful unelected institutions on the planet.
When economic historians look back on the period since the collapse of the Bretton Woods agreement, they will almost certainly conclude that the greatest policy mistake, made by central banks, was to disregard asset price inflation in their attempts to stabilise prices. Meanwhile, in the decade ahead, upside breaches of inflation targets will be largely ignored, especially if growth remains anaemic. Central bankers’, it seems, are determined to get behind the curve, they fear the severity of a recession triggered by their own actions. In the new era of open communications and forward guidance they are reticent to increase interest rates, too quickly or by too great a degree, in such a heavily indebted environment. I wrote more about this in November 2018 in The Self-righting Ship – Debt, Inflation and the Credit Cycle: –
The current level of debt, especially in the developed economies, seems to be acting rather like the self-righting ship. As economic growth accelerates and labour markets tighten, central banks gradually tighten monetary conditions in expectation of inflation. As short-term rates increase, bond yields follow, but, unlike the pattern seen in the higher interest rate era of the 1970’s and 1980’s, the effect of higher bond yields quickly leads to a tempering of credit demand.
Some commentators will rightly observe that this phenomenon has always existed, but, at the risk of saying ‘this time it’s different,’ the level at which higher bond yields act as a break on credit expansion are much lower today in most developed markets.
Conclusions and Investment Opportunities
There have been several drivers of disinflation over the past decade including a tightening of bank regulation, increases in capital requirements and relative fiscal austerity. With short-term interest rates near to zero in many countries, governments will find themselves compelled to relax regulatory impediments to credit creation and open the fiscal spigot, at any sign of a recession, after all, central bank QE appears to have reached the limits of its effectiveness. The table below shows the diminishing returns of QE over time: –
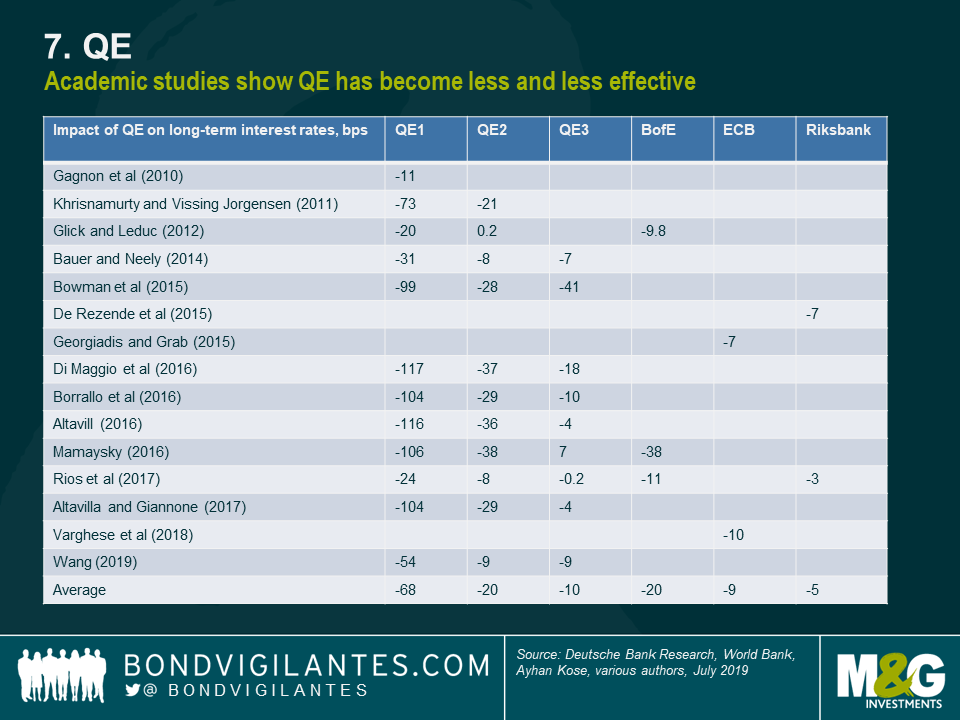
Source: M&G, Deutsche Bank, World Bank
Of course the central banks are not out of ammunition just yet, the Bank of Japan experiment with qualitative easing (they currently purchase ETFs, common stock may be next on their agenda) has yet to be adopted elsewhere and the Federal Reserve has so far resisted the temptation to follow the ECB into corporate bond acquisition.
For the US bond market the next decade may well see yields range within a relatively narrow band. There is the possibility of new record lows, but the upside is likely to be constrained by the overall indebtedness of both the private and public sector.

![]()
Macro Letter – No 108 – 18-01-2019
A world of debt – where are the risks?
Since the financial crisis of 2008/2009 global debt has increased to reach a new all-time high. This trend has been documented before in articles such as the 2014 paper from the International Center for Monetary and Banking Studies – Deleveraging? What deleveraging? The IMF have also been built a global picture of the combined impact of private and public debt. In a recent publication – New Data on Global Debt – IMF – the authors make some interesting observations: –
Global debt has reached an all-time high of $184 trillion in nominal terms, the equivalent of 225 percent of GDP in 2017. On average, the world’s debt now exceeds $86,000 in per capita terms, which is more than 2½ times the average income per-capita.
The most indebted economies in the world are also the richer ones. You can explore this more in the interactive chart below. The top three borrowers in the world—the United States, China, and Japan—account for more than half of global debt, exceeding their share of global output.
The private sector’s debt has tripled since 1950. This makes it the driving force behind global debt. Another change since the global financial crisis has been the rise in private debt in emerging markets, led by China, overtaking advanced economies. At the other end of the spectrum, private debt has remained very low in low-income developing countries.
Global public debt, on the other hand, has experienced a reversal of sorts. After a steady decline up to the mid-1970s, public debt has gone up since, with advanced economies at the helm and, of late, followed by emerging and low-income developing countries.
The recent picture suggests that the old world order, dominated by advanced economies, may be changing. For investors, this is an important consideration. Total debt in 2017 had exceeded the previous all-time high by more than 11%, however, the global debt to GDP ratio fell by 1.5% between 2016 and 2017, led by developed nations.
Setting aside the absolute level of interest rates, which have finally begun to rise from multi-year lows, it makes sense for rapidly aging, developed economies, to begin reducing their absolute level of debt, unfortunately, given that unfunded pension liabilities and the escalating cost of government healthcare provision are not included in the data, the IMF are only be portraying a partial picture of the state of developed economy obligations.
For emerging markets, the trauma of the 1998 Asian Crisis has finally waned. In the decade since the great financial recession of 2008 emerging economies, led by China, have increased their borrowing. This is clearly indicated in the chart below: –
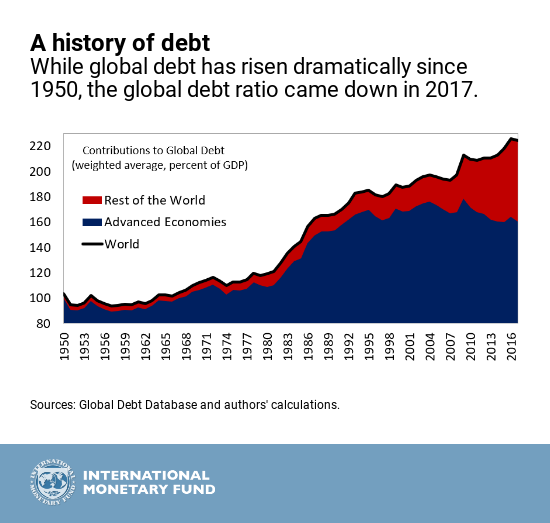
Source: IMF
The decline in the global debt to GDP ratio in 2017 is probably related to the change in Federal Reserve policy; the largest proportion of global debt is still raised in US$. Rather like the front-loaded US growth which transpired due the threat of tariff increases on US imports, I suspect, debt issuance spiked in expectation of a reversal of quantitative easing and an end to ultra-low US interest rates.
The IMF goes on to show the breakdown of debt by country, separating them into three groups; advanced economies, emerging markets and low income countries. The outlier is China, an emerging market with a debt to GDP ratio comparable to that of an advanced economy. The table below may be difficult to read (an interactive one is available on the IMF website): –
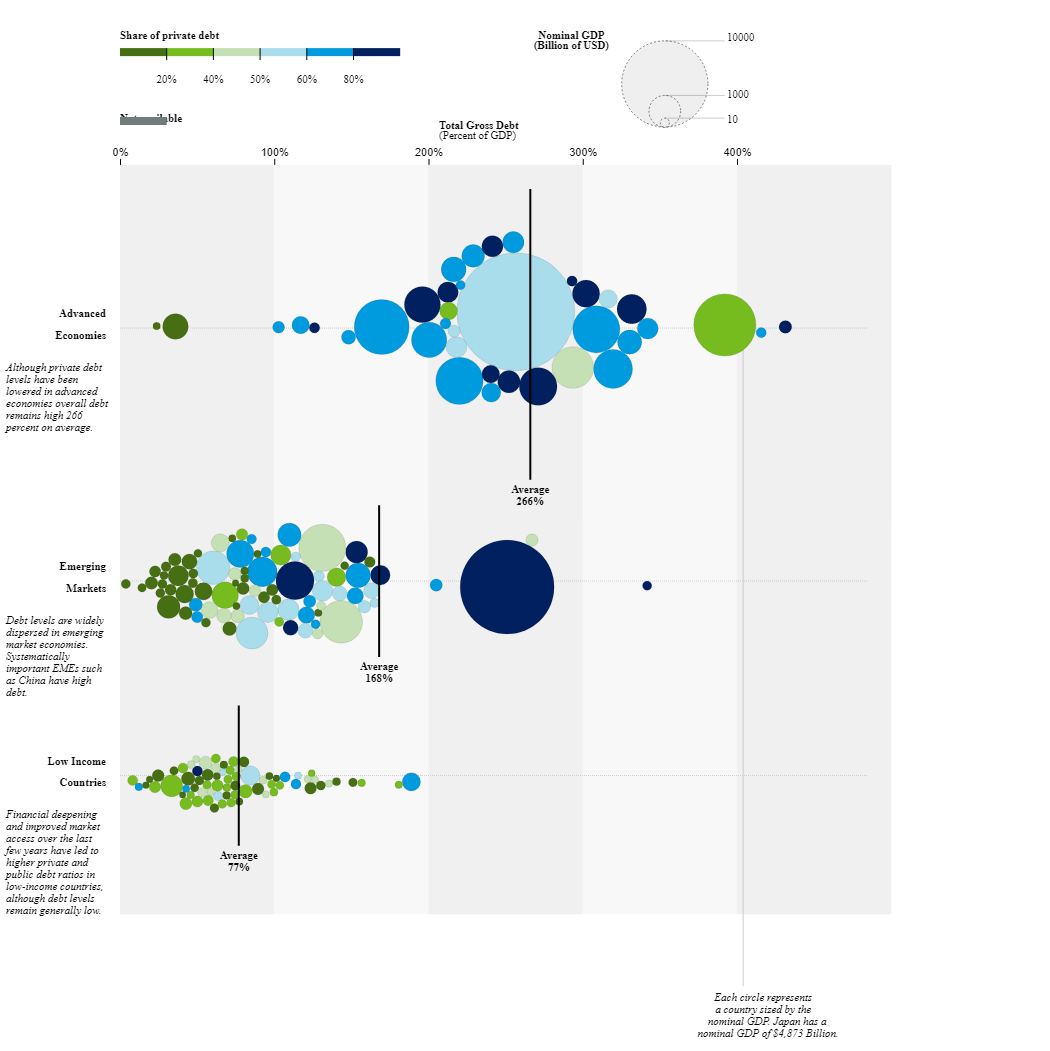
Source: IMF
At 81%, China’s private debt is much greater than its public debt, meanwhile its debt to GDP ratio is 254% – comparable with the US (256%). Fortunately, the majority of Chinese private debt is denominated in local currency. Advanced economies have higher debt to GDP ratios but their government debt ratios are relatively modest, excepting Japan. The Economist – Economists reconsider how much governments can borrow – provides food for thought on this subject.
Excluding China, emerging markets and low income countries have relatively similar levels of debt relative to GDP. In general, the preponderance of government debt in lower ratio countries reflects the lack of access to capital markets for private sector borrowers.
Conclusions and Investment Opportunities
Setting aside China, which, given its control on capital flows and foreign exchange reserves is hard to predict, the greatest risk to world financial markets appears to be from the private debt of advanced economies.
Following the financial crisis of 2008, corporate credit spreads narrowed, but not by as much as one might have anticipated, as interest rates tended towards the zero bound. The inexorable quest for yield appears to have been matched by equally enthusiastic issuance. The yield-quest also prompted the launch of a plethora of private debt investment products, offering enticing returns in exchange for illiquidity. An even more sinister trend has been the return of many of the products which exacerbated the financial crisis of 2008 – renamed, repackaged and repurposed. These investments lack liquidity and many are leveraged in order to achieve acceptable rates of return.
The chart below shows the 10yr maturity Corporate Baa spread versus US Treasuries since March 2007: –
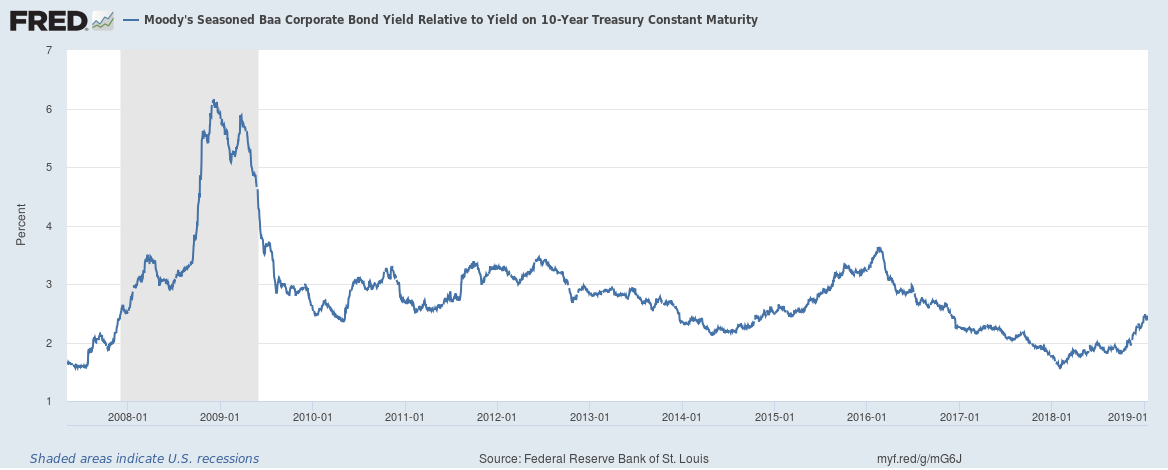
Source: Federal Reserve Bank of St Louis
The Baa spread has widened since its low of 1.58% in January 2018, but, at 2.46%, it is still only halfway between the low of 2018 and the high of February 2016 (3.6%).
The High Yield Bond spread experienced a more dramatic reaction into the close of 2018, but, since the beginning of January, appears to have regained its composure. The chart shows the period since September 2015: –
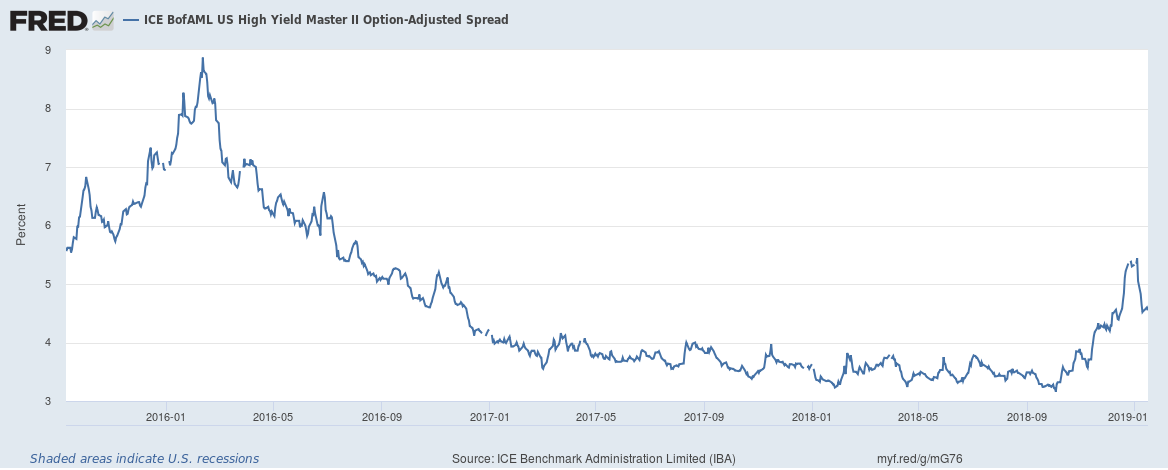
Source: Federal Reserve Bank of St Louis
Nonetheless, this looks more like a technical break-out. The spread may narrow to retest the break of 4% seen on November 15th, but the move looks impulsive. A return to the 3.25% – 3.75% range will be needed to quell market fears of an imminent full-blown credit-crunch.
If the next crisis does emanate from the private debt markets, governments will still be in a position to intervene; the last decade has taught us to accept negative government bond yields as a normal circumstance. Demographic trends have even led long dated interest rate swaps to trade even lower than risk-free assets.
A decade after the financial crisis, markets are fragile and, with an ever increasing percentage of capital market transactions dictated by non-bank liquidity providers, liquidity is ever more transitory. Credit spreads have often been the leading indicator of recessions, they may not provide the whole picture this time, but we should watch them closely during 2019.
![]()
Macro Letter – No 103 – 26-10-2018
Not waving but drowning – Stocks, debt and inflation?
The recent decline in the US stock market, after the longest bull-market in history, has prompted many commentators to focus on the negative factors which could sow the seeds of the next recession. Among the main concerns is the inexorable rise in debt since the great financial recession (GFR) of 2008. According to May 2018 data from the IMF, global debt now stands at $63trln, with emerging economy debt expansion, over the last decade, more than offsetting the marking time among developed nations. The IMF – Global Debt Database: Methodology and Sources WP/18/111 – looks at the topic in more detail.
The title of this week’s Macro letter comes from the poet Stevie Smith: –
I was much further out than you thought
And not waving but drowning.
It seems an appropriate metaphor for valuation and leverage in asset markets. In 2013 Thomas Pickety published ‘Capital in the 21st Century’ in which he observed that income inequality was rising due to the higher return on unearned income relative to labour. He and his co-authors gathering together one of the longest historical data-set on interest rates and wages – an incredible achievement. Their conclusion was that the average return on capital had been roughly 5% over the very long run.
This is not the place to argue about the pros and cons of Pickety’s conclusions, suffice to say that, during the last 50 years, inflation indices have tended to understate what most of us regard as our own personal inflation rate, whilst the yield offered by government bonds has been insufficient to match the increase in our cost of living. The real rate of return on capital has diminished in the inflationary, modern era. Looked at from another perspective, our current fiat money and taxation system encourages borrowing rather than lending, both by households, corporates, for whom repayment is still an objective: and governments, for whom it is not.
Financial innovation and deregulation has helped to oil the wheels of industry, making it easier to service or reschedule debt today than in the past. The depth of secondary capital markets has made it easier to raise debt (and indeed equity) capital than at any time in history. These financial markets are underpinned by central banks which control interest rates. Since the GFR interest rates have been held at exceptionally low levels, helping to stimulate credit growth, however, that which is not seen, as Bastiat might have put it, is the effect that this credit expansion has had on the global economy. It has led to a vast misallocation of capital. Companies which would, in an unencumbered interest rate environment, have been forced into liquidation, are still able to borrow and continue operating; their inferior products flood the market place crowding out the market for new innovative products. New companies are confronted by unfair competition from incumbent firms. Where there should be a gap in the market, it simply does not exist. At a national and international level, productivity slows and the trend rate of GDP growth declines.
We are too far out at sea and have been for decades. Markets are never permitted to clear, during economic downturns, because the short-term pain of recessions is alleviated by the rapid lowering of official interest rates, prolonging the misallocation of capital and encouraging new borrowing via debt – often simply to retire equity capital and increase leverage. The price of money should be a determinant of the value of an investment, but when interest rates are held at an artificially low rate for a protracted period, the outcome is massively sub-optimal. Equity is replaced by debt, leverage increases, zombie companies limp on and, notwithstanding the number of technology start-ups seen during the past decade, innovation is crushed before it has even begun.
In an unencumbered market with near price stability, as was the case prior to the recent inflationary, fiat currency era, I suspect, the rate of return on capital would be approximately 5%. On that point, Pickety and I are in general agreement. Today, markets are as far from unencumbered as they have been at any time since the breakdown of the Bretton Woods agreement in 1971.
Wither the stock market?
With US 10yr bond yields now above 3%, stocks are becoming less attractive, but until real-yields on bonds reach at least 3% they still offer little value – US CPI was at 2.9% as recently as August. Meanwhile higher oil prices, import tariffs and wage inflation all bode ill for US inflation. Nonetheless, demand for US Treasuries remains robust while real-yields, even using the 2.3% CPI data for September, are still exceptionally low by historic standards. See the chart below which traces the US CPI (LHS) and US 10yr yields (RHS) since 1971. Equities remain a better bet from a total return perspective: –
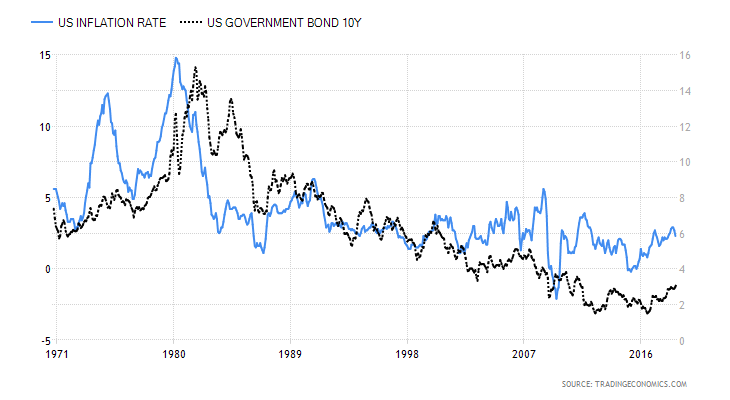
Source: Trading Economics
What could change sentiment, among other factors, is a dramatic rise in the US$, an escalation in the trade-war with China, or a further increase in the price of oil. From a technical perspective the recent weakness in stocks looks likely to continue. A test of the February lows may be seen before the year has run its course. Already around ¾ of the stocks in the S&P 500 have suffered a 10% plus correction – this decline is broad-based.
Many international markets have already moved into bear territory (declining more than 20% from their highs) but the expression, ‘when the US sneezes the world catches a cold,’ implies that these markets may fall less steeply, in a US stock downturn, but they will be hard-pressed to ignore the direction of the US equity market.
Conclusions and investment opportunities
Rumours abound of another US tax cut. Federal Reserve Chairman, Powell, has been openly criticised by President Trump; whilst this may not cause the FOMC to reverse their tightening, they will want to avoid going down in history as the committee that precipitated an end to Federal Reserve independence.
There is a greater than 50% chance that the S&P 500 will decline further. Wednesday’s low was 2652. The largest one month correction this year is still that which occurred in February (303 points). We are not far away, however, a move below 2637 will fuel fears. I believe it is a breakdown through the February low, of 2533, which will prompt a more aggressive global move out of risk assets. The narrower Dow Jones Industrials has actually broken to new lows for the year and the NASDAQ suffered its largest one day decline in seven years this week.
A close below 2352 for the S&P 500 would constitute a 20% correction – a technical bear-market. If the market retraces to the 2016 low (1810) the correction will be 38% – did someone say, ‘Fibonacci’ – if we reach that point the US Treasury yield curve will probably be close to an inversion: and from a very low level of absolute rates. Last week the FRBSF – The Slope of the Yield Curve and the Near-Term Outlook – analysed the recession predicting power of the shape of the yield curve, they appear unconcerned at present, but then the current slope is more than 80bp positive.
If the stock correction reaches the 2016 lows, a rapid reversal of Federal Reserve policy will be required to avoid accusations that the Fed deliberately engineered the disaster. I envisage the Fed calling upon other central banks to render assistance via another concert party of quantitative, perhaps backed up by qualitative, easing.
At this point, I believe the US stock market is consolidating, an immanent crash is not on the horizon. The GFR is still too fresh in our collective minds for history to repeat. Longer term, however, the situation looks dire – history may not repeat but it tends to rhyme. Among the principal problems back in 2008 was an excess of debt, today the level of indebtedness is even greater…
We are much further out than we thought,
And not waving but drowning.
![]()
Macro Letter – No 91 – 16-02-2018
A safe place to hide – inflation and the bond markets
US Bonds
I used to think if there was reincarnation, I wanted to come back as the president or the pope or a .400 baseball hitter. But now I want to come back as the bond market. You can intimidate everybody – James Carville 1993
Back in the May 1981 US official interest rates hit 20% for the third time in 14 months, the yield on US 10yr Treasury Bond yields lagged somewhat and only reached their zenith in September of that year, at 15.82%. In those days the 30yr Bond was the global bellwether for fixed income securities; its yield high was only 15.20%, the US yield curve was inverted and America languished in the depths of a deep recession.
More than a decade later in 1993 James Carville, then advisor to President Bill Clinton, was still in awe of the power of the bond market. But is that still the case today? Back then, inflation was the genie which had escaped from the bottle with the demise of the Bretton Woods agreement. Meanwhile, Paul Volker, then Chairman of the Federal Reserve was putting into practice what William McChesney Martin, one of his predecessors, had only talked about, namely taking away the punch bowl. Here, for those who are unfamiliar with the speech, is an extract; it was delivered, by Martin, to the New York Bankers Association on 19th October 1955:-
If we fail to apply the brakes sufficiently and in time, of course, we shall go over the cliff. If businessmen, bankers, your contemporaries in the business and financial world, stay on the sidelines, concerned only with making profits, letting the Government bear all of the responsibility and the burden of guidance of the economy, we shall surely fail. … In the field of monetary and credit policy, precautionary action to prevent inflationary excesses is bound to have some onerous effects–if it did not it would be ineffective and futile. Those who have the task of making such policy don’t expect you to applaud. The Federal Reserve, as one writer put it, after the recent increase in the discount rate, is in the position of the chaperone who has ordered the punch bowl removed just when the party was really warming up.
Back in the October 1955 the Discount rate was 2.30% and the 10yr yield was 2.88%. The economy had just emerged from a recession and would not embark on its next downturn until mid-1957.
Today the US yield curve is also unusually flat, especially by comparison with the inflationary era of the 1970’s, 1980’s and 1990’s. In some ways, however, (barring the inflationary blip in 1951-52) it looks similar to the 1950’s. Here is a chart showing the 10yr yield (blue – LHS) and US inflation (dotted – RHS):-

Source: Trading Economics
I believe that in order to protect the asset markets (by which I mean, principally, stocks and real estate) the Federal Reserve (charged as it is with the twin, but not mutually exclusive, objectives of full-employment and stable prices) may decide to focus on economic growth and domestic harmony at the expense of a modicum of, above target, inflation. When Fed Chairman, Martin, talked of removing the punch bowl back in 1955, inflation had already subsided from nearly 10% – mild deflation was actually working its way through the US economy.
Central Bank balance sheets
Today there are several profound differences with the 1950’s, not least, the percentage of the US bond market which is held by Central Banks. As the chart below shows, Central Banks balance sheet expansion continues, at least, at the global level: it now stands at $14.6trn:-
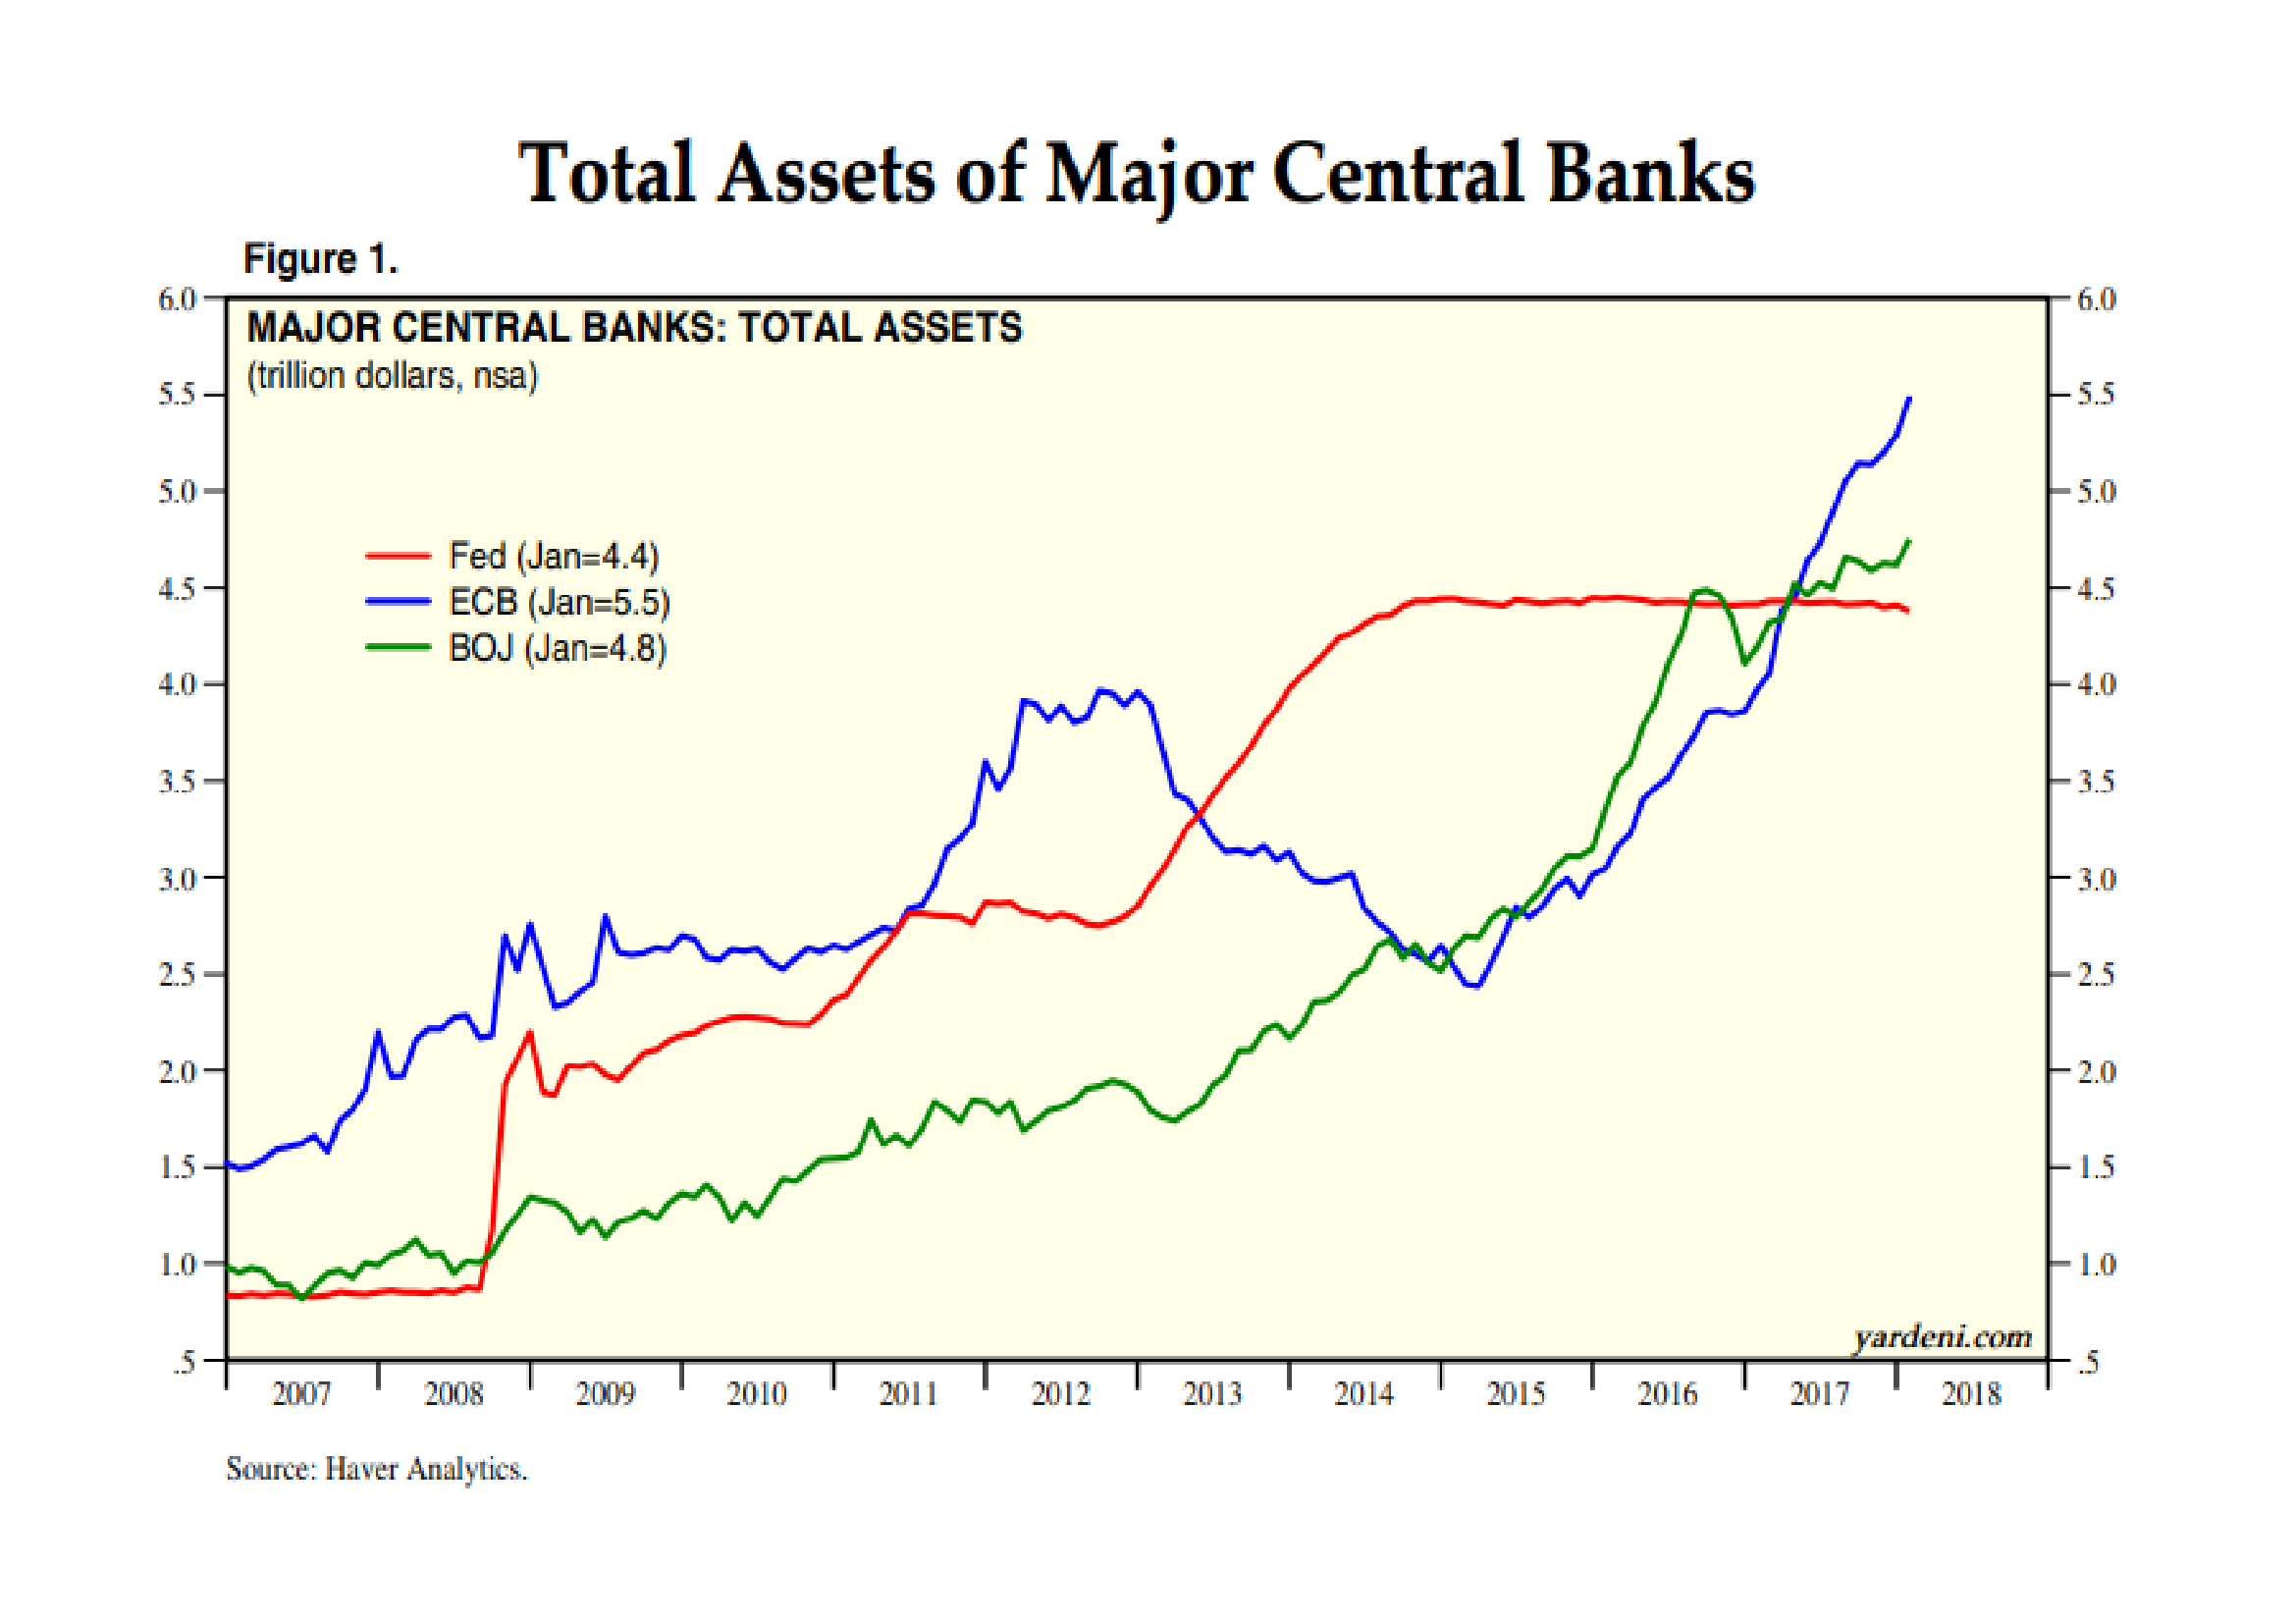
Source: Haver Analytics, Yardeni Research
Like the Fed, the BoJ and ECB have been purchasing their own obligations, by contrast the PBoC’s modus operandi is rather different. The largest holders of US public debt (principally T-Bonds and T-Bills) are foreign institutions. Here is the breakdown as at the end of 2016:-
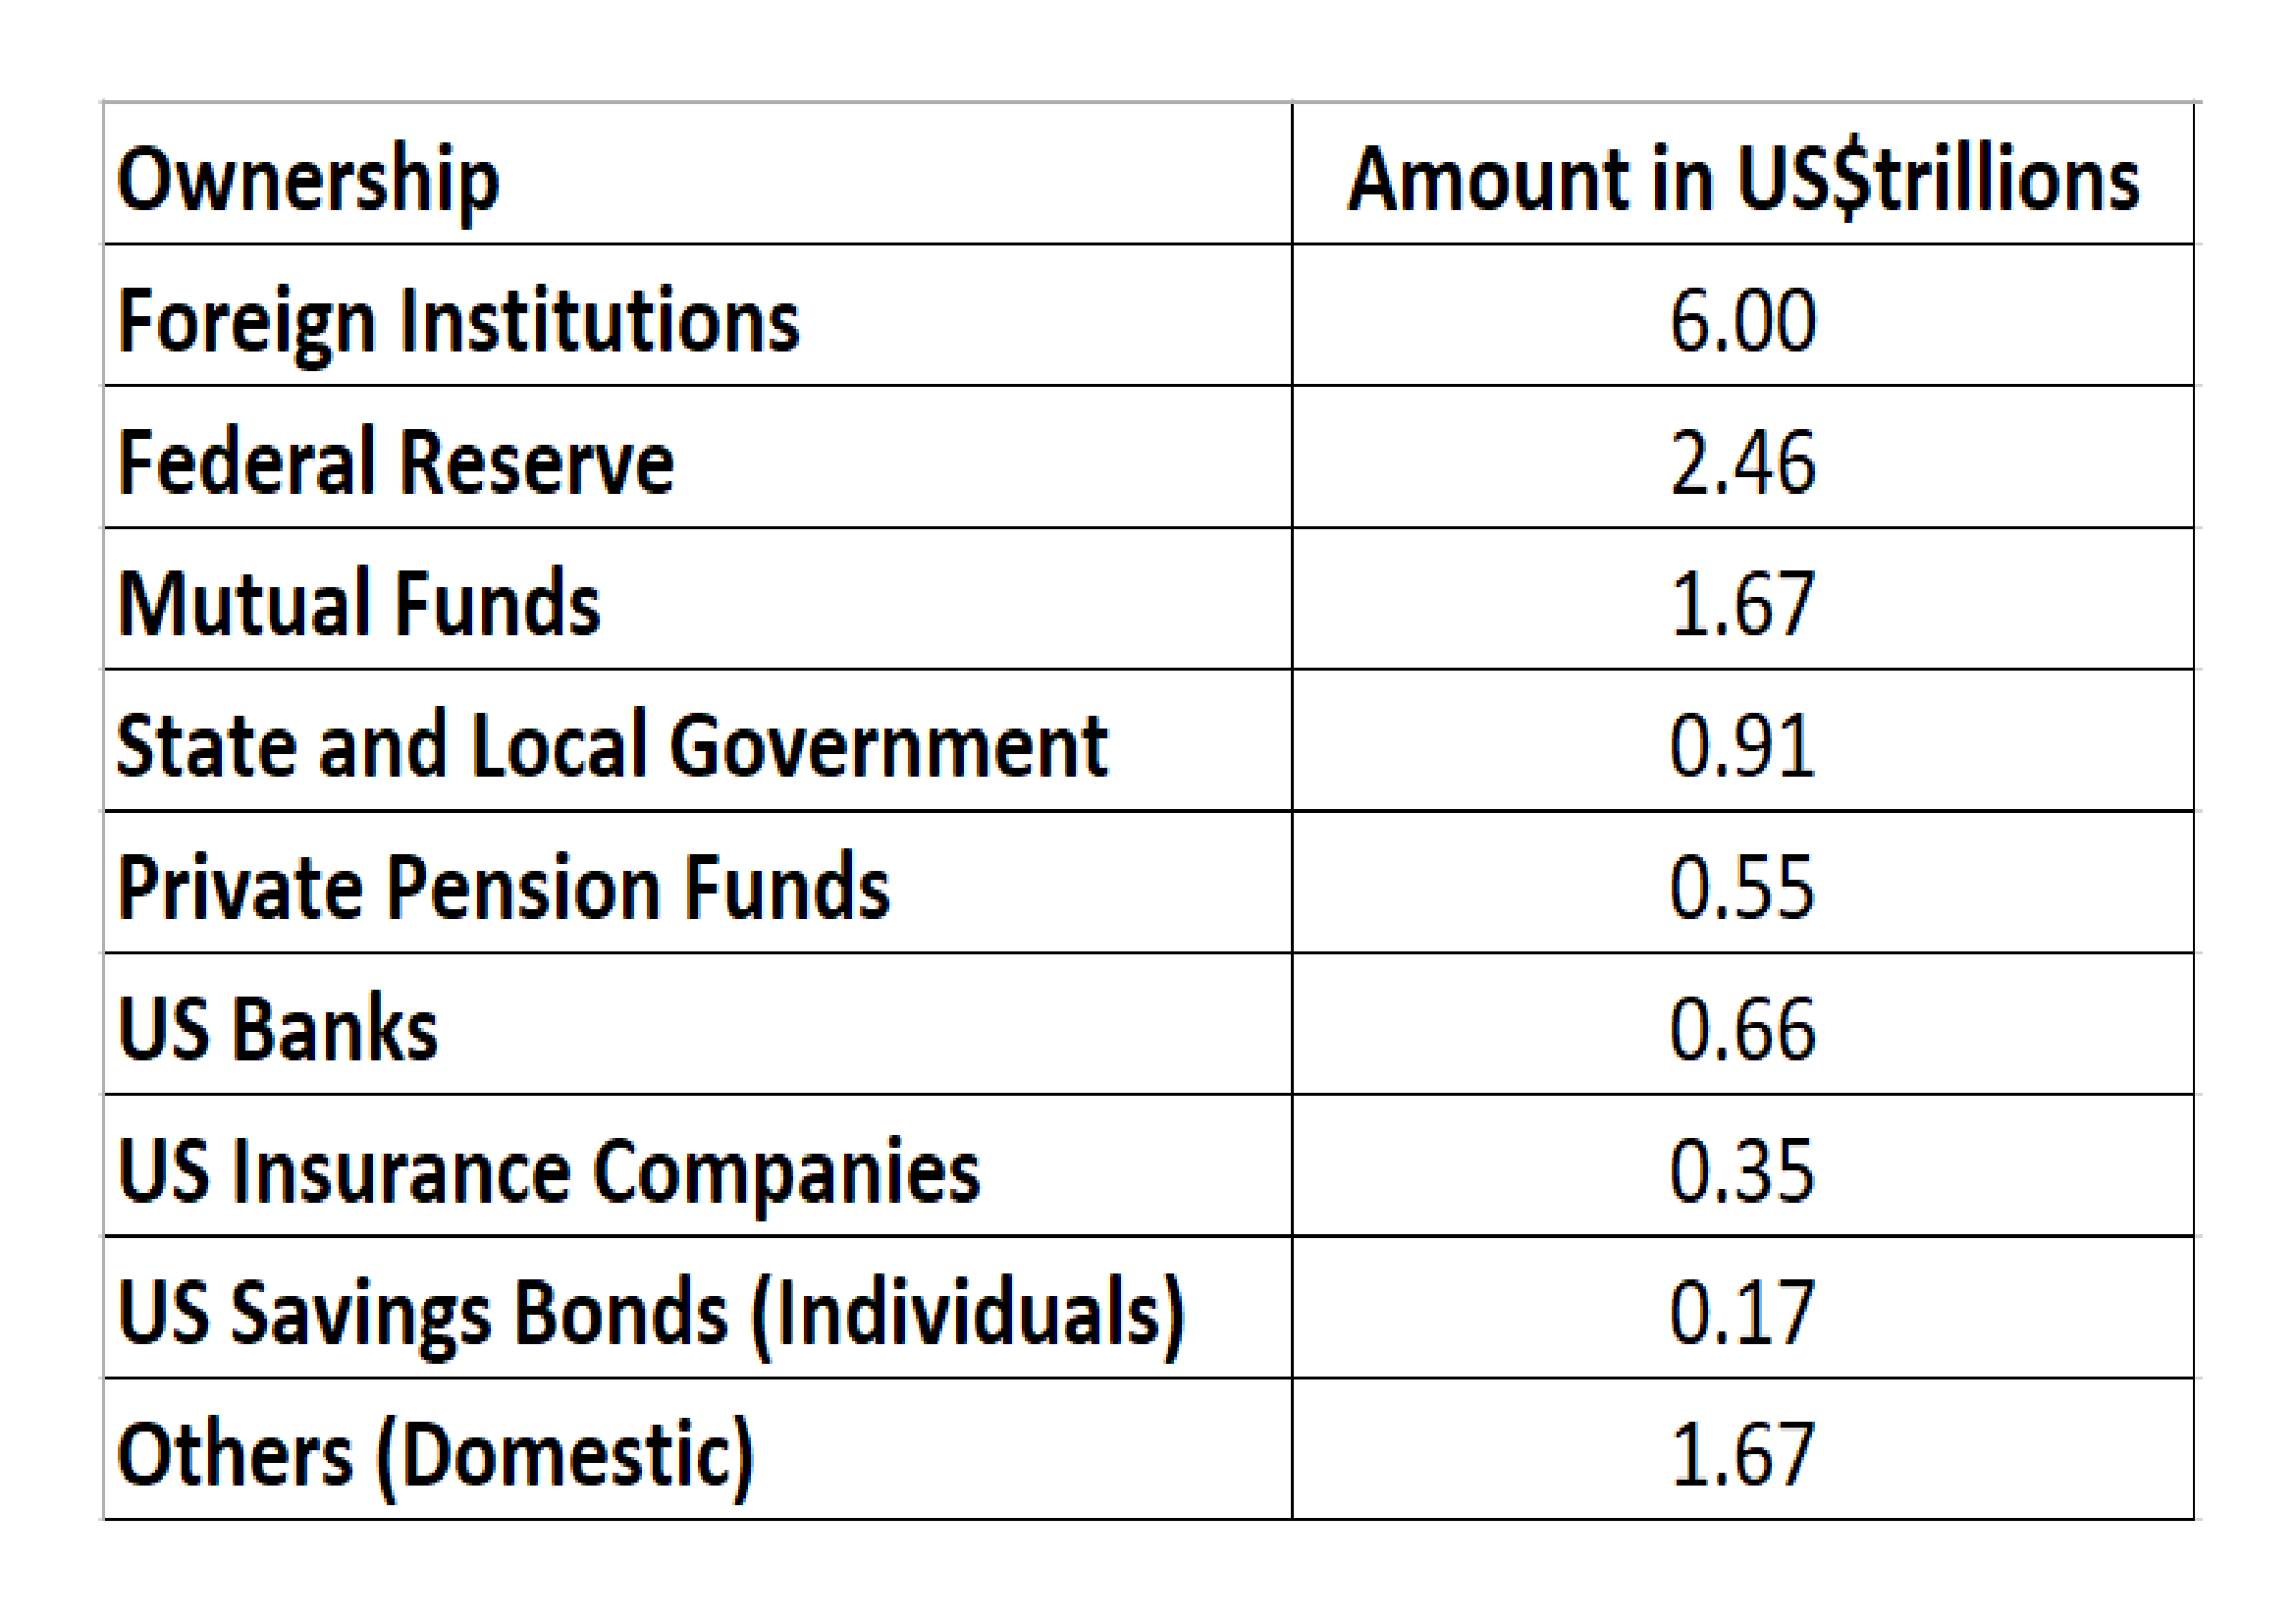
Source: US Treasury
As of November 2017 China has the largest holding of US debt – US$1.2trn (a combination of the PBoC and state owned enterprises), followed by Japan -US$1.1trn, made up of both private and public pension fund investments. It is not in the interests of China or Japan to allow a collapse in the US bond market, nor is it in the interests of the US government; their ability borrow at historically low yields during the last few years has not encouraged the national debt to decline, nor the budget to balance.
Bond Markets in Europe and Japan
The BoJ continues its policy of yield curve control – targeting a 10bp yield on 10yr JGBs. Its balance sheet now stands at US$4.8trn, slightly behind the ECB and PBoC which are vying for supremacy mustering US$5.5trn apiece. Thanks to the persistence of the BoJ, JGB yields have remained between zero and 10bp since November 2016. As of December 2017 the BoJ owned 46.2% of the total issuance. The ECB, by contrast, holds a mere 19.2% of Eurozone debt.
Another feature of the Eurozone bond market, during the last couple of years, has been the continued convergence in yields between the core and periphery. The chart below shows the evolution of the yield of 10yr Greek Government Bonds (LHS) and German Bunds (RHS). The spread is now at almost its lowest level ever. This may be a reflection of the improved performance of the Greek economy but it is more likely to be driven by fixed income investors continued quest for yield:-
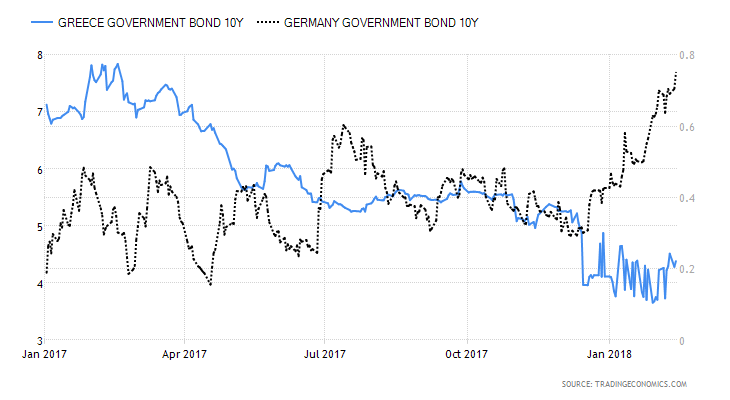
Source: Trading Economics
By contrast with Greece (where yields have fallen) and Germany (where they are on the rise) 10yr Italian BTPs and Spanish Bonos have remained broadly unchanged, whilst French OATs have seen yields rise in sympathy with Germany. Hopes of a Eurobond backed by the EU, to replace the obligations of peripheral nation states, whilst vehemently denied in official circles, appears to remain high.
Japanese and European economic growth, which has surprised on the upside over the past year, needs to prove itself more than purely cyclical. Both regions are reliant on the relative strength of US the economic recovery, together with the continued structural expansion of China and India. The jury is out on whether either Japan or the EU can achieve economic terminal velocity without strong export markets for their goods and services.
The one country in the European area which is behaving differently is the UK; yields have risen but, it stands apart from the rest of the Eurozone; UK Gilts dance to a different tune. Uncertainty about Brexit caused Sterling to decline, especially against the Euro, import prices rose in response, pushing inflation higher. 10yr Gilt yields bottomed in August 2016 at 50bp. Since then they have risen to 1.64% – this is still some distance from the highs of January 2014 when they tested 3.09%. 2yr Gilts are different matter, with a current yield of 71bp they are 63bp from their lows but just 22bp away from the 2014 high of 93bp.
Conclusions and Investment Opportunities
From a personal investment perspective, I have been out of the bond markets since 2013. My reasoning (which proved expensive) was that the real-yields on the majority of markets was already extremely negative and the notional yields were uncomfortably close to zero. Of course these markets went much, much further than I had anticipated. Now I am tempted by the idea of reallocating, despite yields being lower than they were when I exited previously. Inflation in the US is 2.1%, in the Euro Area it is 1.3% whilst in Japan it is still just 1%.
As a defensive investment one should look for short duration bonds, but in the US this brings the investor into conflict with the hawkish policy stance of the Fed; that is, what my friend Ben Hunt of Epsilon Theory dubs, the Inflation Narrative. For a contrary view this Kansas City Fed paper may be of interest – Has the Anchoring of Inflation Expectations Changed in the United States during the Past Decade?
In Japan yields are still too near the zero bound to be enticing. In Germany you need to need to go all the way out to 6yr maturity Bunds before you receive a positive yield. There is an alternative to consider – 2yr Gilts:-
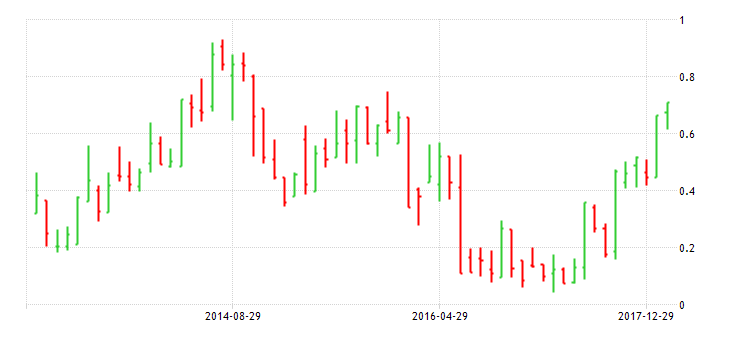
Source: Trading Economics
UK inflation is running at 3% – that puts it well above the BoE target of 2%. Rate increases are anticipated. 2yr Gilt yields have recently followed the course steered by the US and Germany, taking out the highs last seen in December 2015, however, if (although I really mean when) a substantial stock market correction occurs, 2yr Gilt yields have the attraction of being near the top of their five year range – unlike 2yr Schatz which are nearer the bottom of theirs. 2yr Gilts will benefit from a slowdown in Europe and any uncertainty surrounding Brexit. The BoE will be caught between the need to quell inflation and the needs of the economy as a whole. 2yr Gilts also offer the best roll-down on the UK yield curve. The 1yr maturity yields 49bp, whilst the 3yr yields 83bp.
With inflation fears are on the rise, especially in the US and UK, 2yr Gilts make for an uncomfortable investment today, however, they are a serious contender as a safe place to hide, come the real stock market correction.

![]()
Macro Letter – No 88 – 08-12-2017
China – leading indicator? Stocks, credit policy, rebalancing and money supply
Chinese 10yr bond yields have been rising steadily since October 2016. They never reached the low or negative levels of Japan or Germany. 1yr bonds bottomed earlier at 1.76% in June 2015 having tested 1% back in 2009.
The pattern and path of Chinese rates is quite different from that of US Treasuries. Last month rates increased to their highest since 2014 and the Shanghai Composite index finally appears to have taken notice. The divergence, however, between Shanghai stocks and those of the US is worth investigating more closely.
The chart below shows the yield on 10yr Chinese Government Bonds since 2007 (LHS) and the 3 month inter-bank deposit rate over the same period (RHS):-
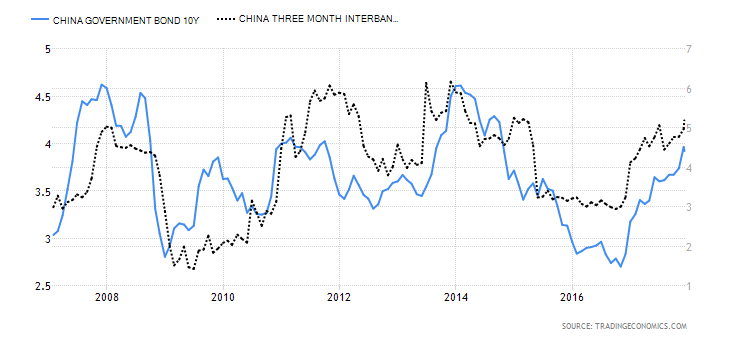
Source: Trading Economics
From a recent peak in 2014, yields declined steadily until October 2016, since when they have begun to rise quite sharply.
The next chart shows the change in yield of Government bonds and AAA Corporate bonds across the entire yeild curve:-
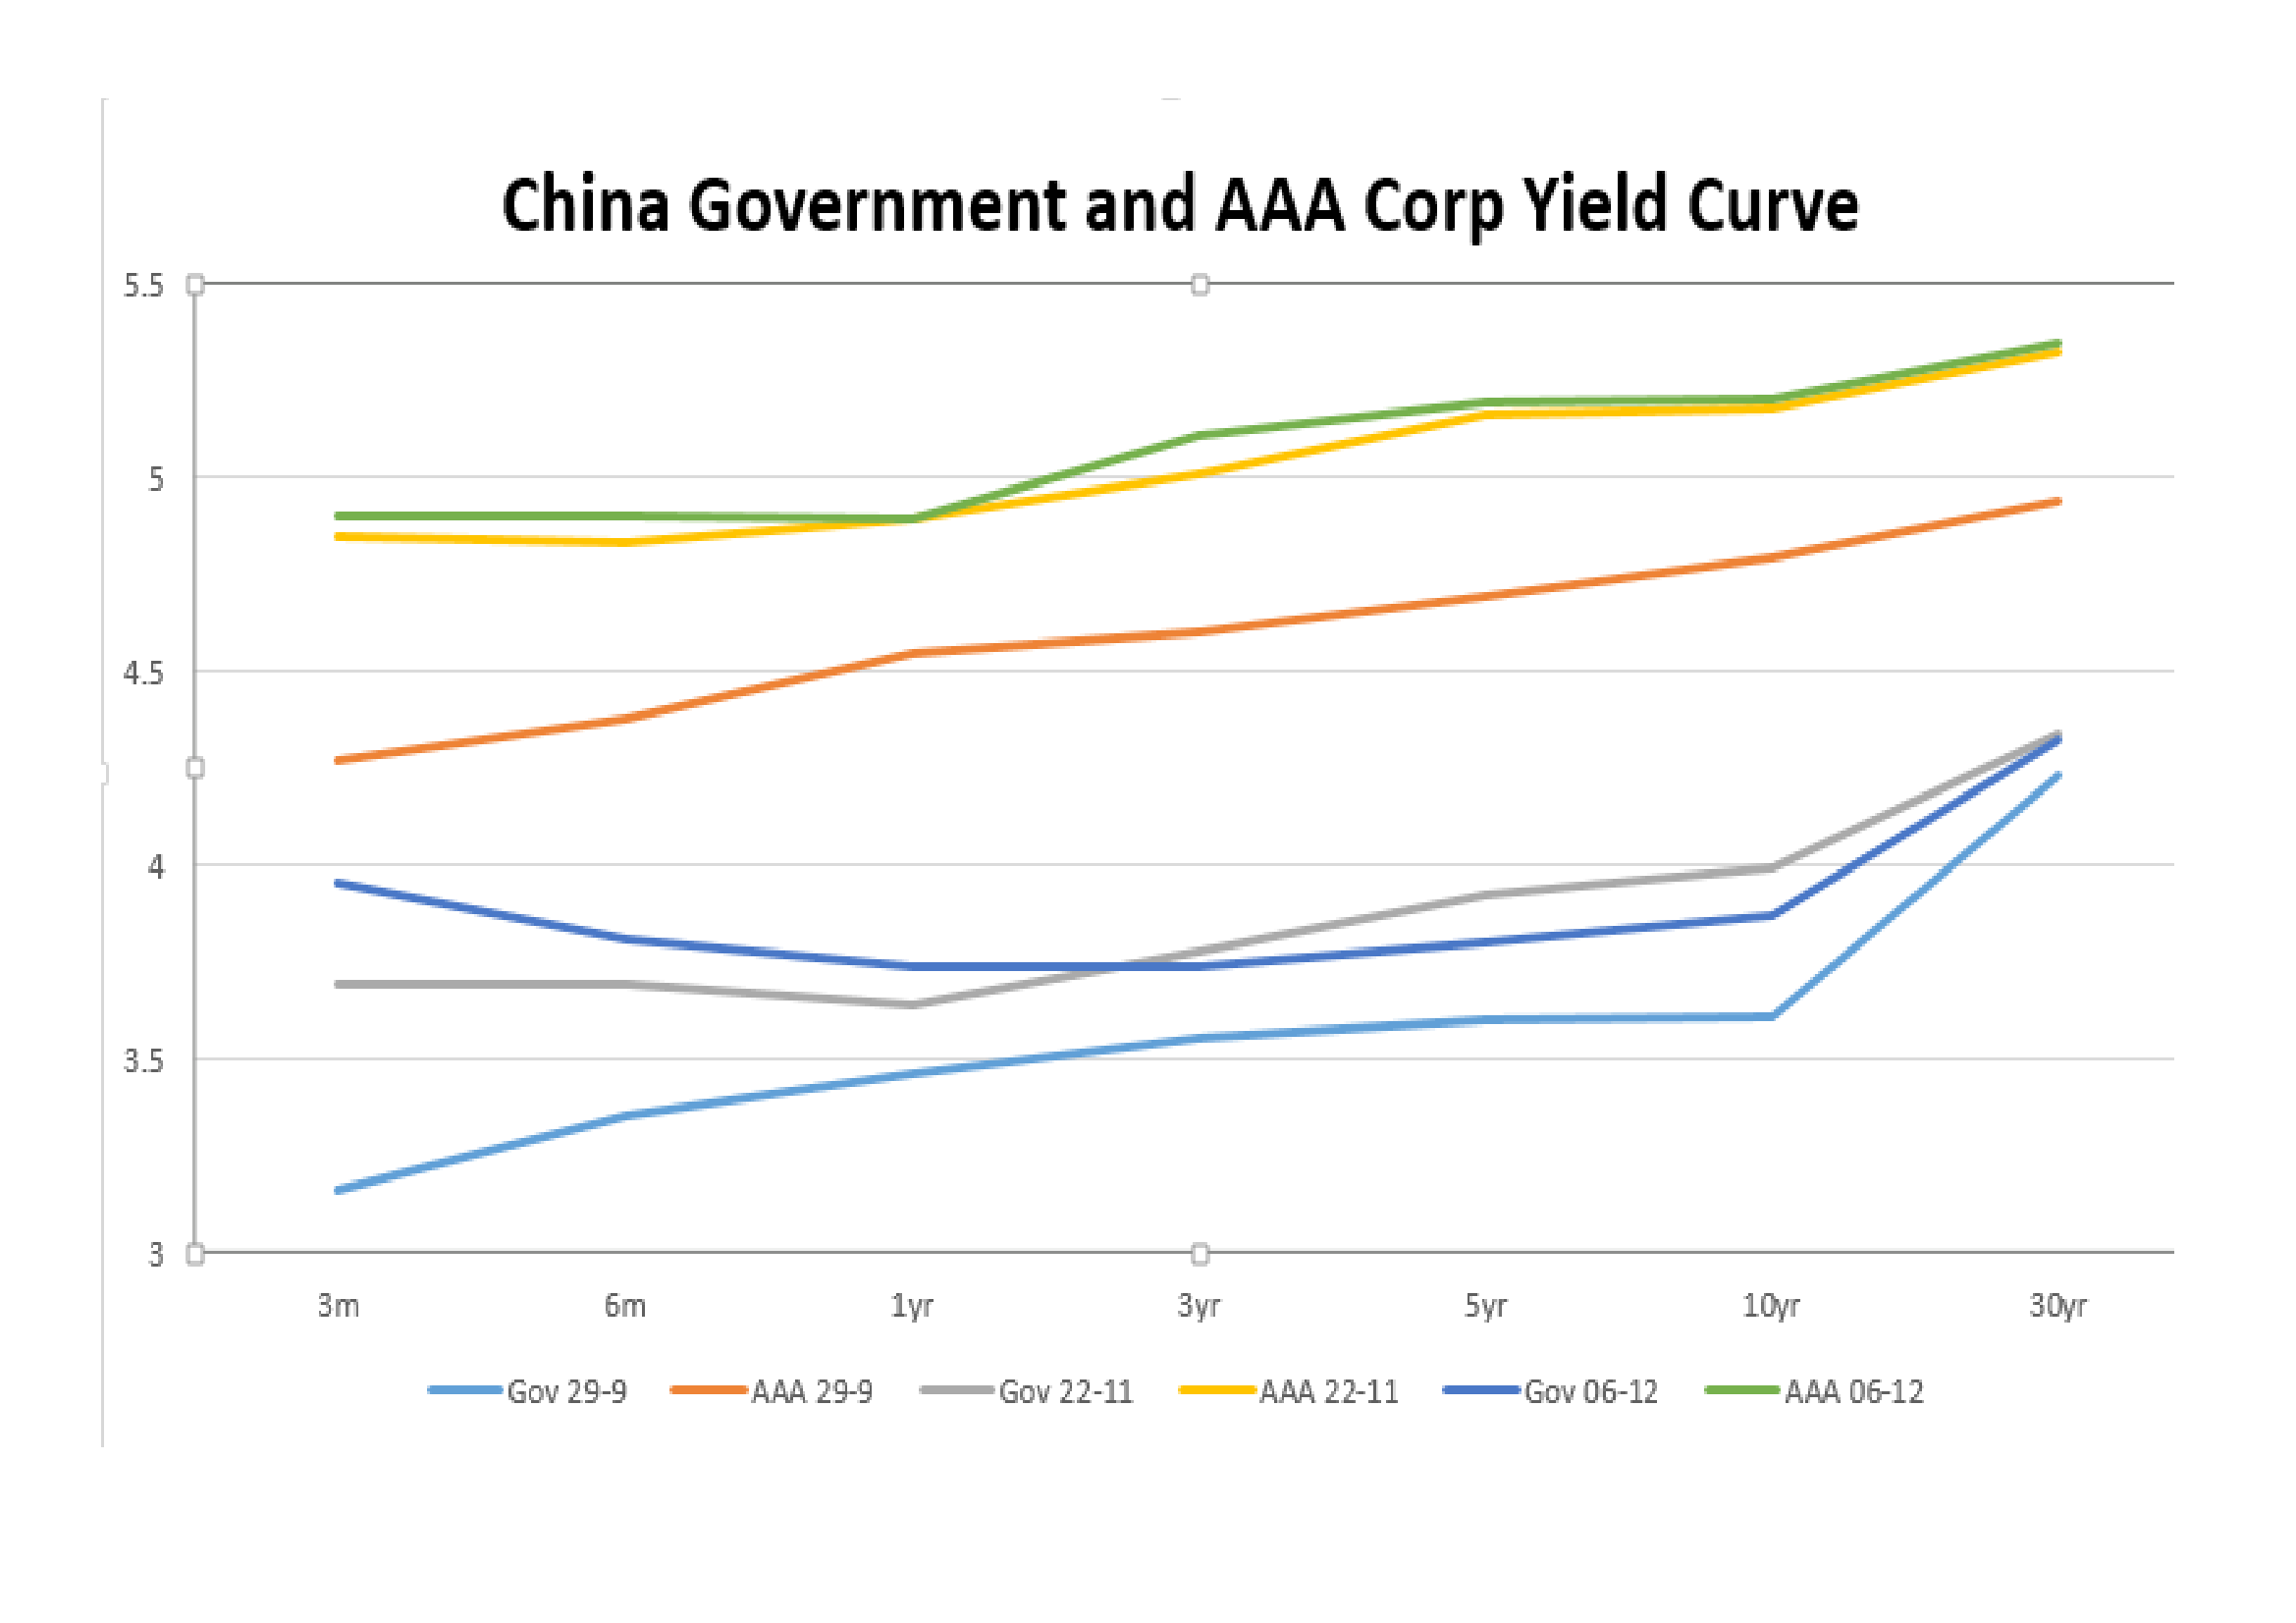
Source: PBoC
The dates I chose were 29th September – the day before the People’s Bank of China (PBoC) announced their targeted lending plan. The 22nd November – the day before the Shanghai index reversed and 6th December – bringing the data set up to date.
The general observation is simply that yields have risen across the maturity spectrum, but the next chart, showing the change in the spread between government and corporate paper reveals some additional nuances:-
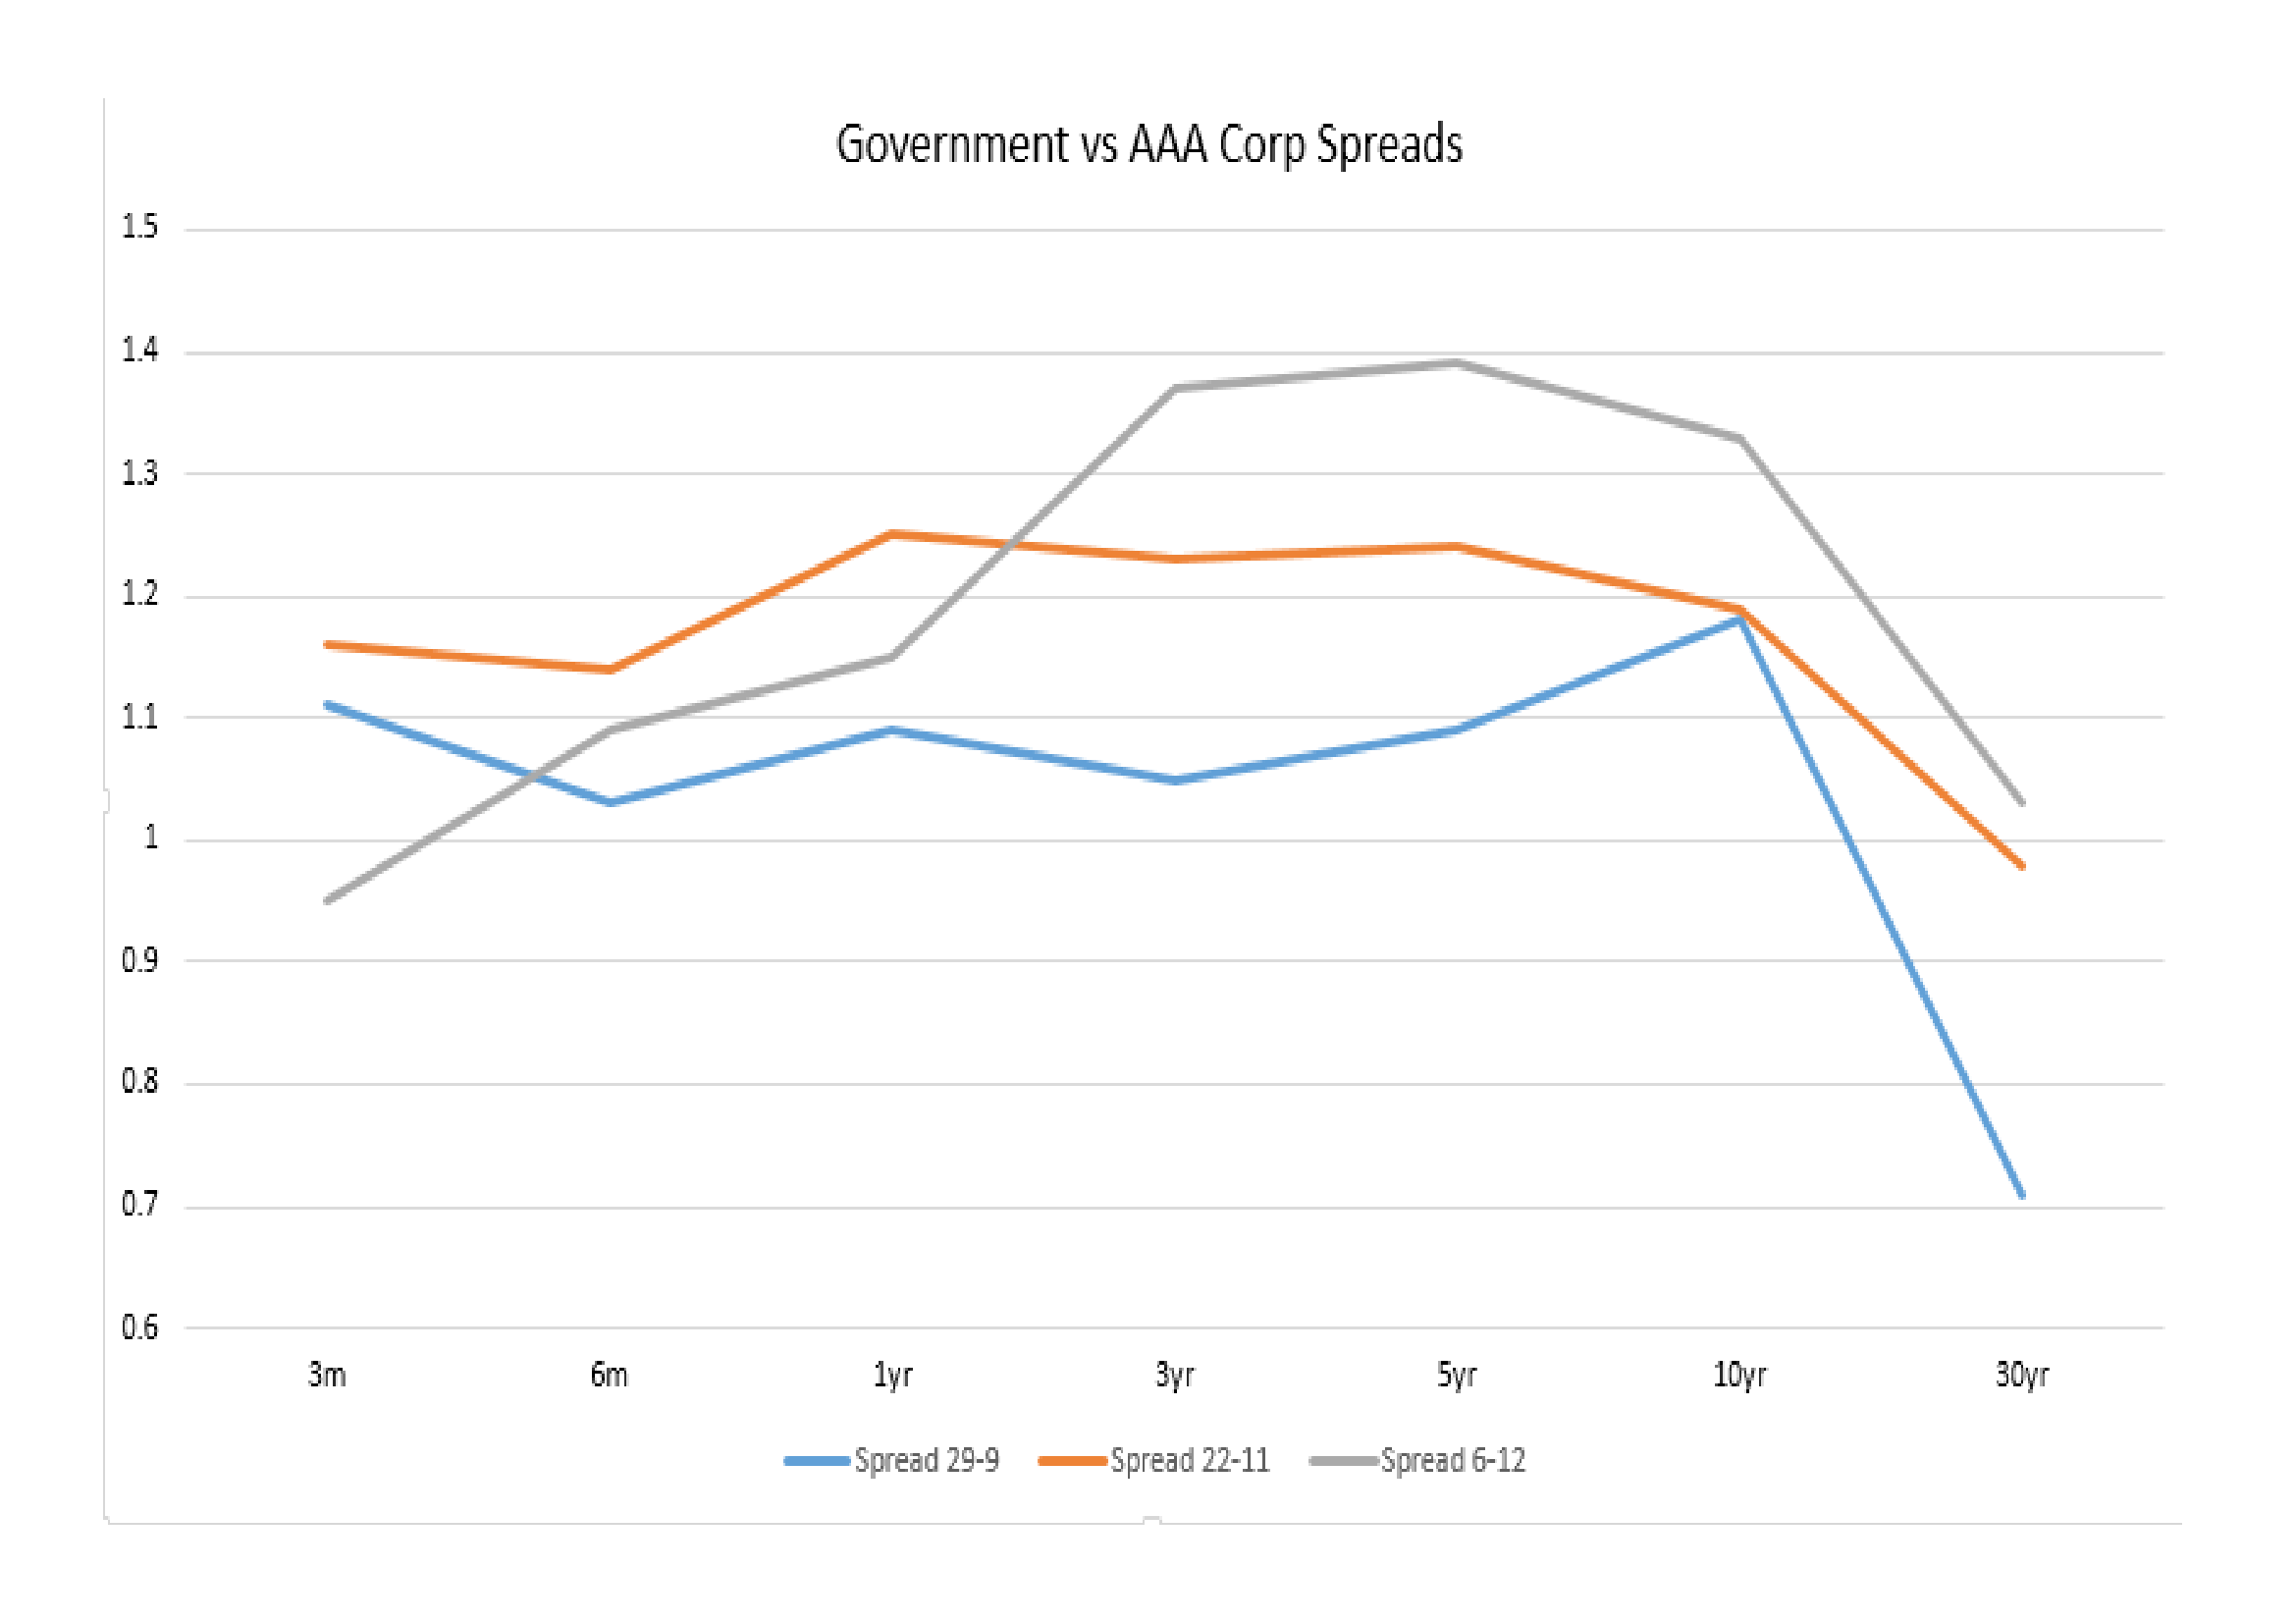
Source: PBoC
Spreads have generally widened as monetary conditions have tightened. The widening has been most pronounced in the 30yr maturity. The widening of credit spreads may be driven by the prospect of $1trln of corporate debt which is due to mature between now and 2019.
Another factor may be the change in policy announced by the PBoC on September 30th. Bloomberg – China’s Central Bank Unveils Targeted Lending Plan to Aid Growth provides an excellent overview:-
Banks will enjoy 0.5 percentage point RRR cut if eligible lending exceeds 1.5 percent or more of their new lending in 2017
Deduction will be 1.5 percentage point if eligible lending reaches 10 percent or more of new lending in 2017, or if “inclusive finance” loans take up 10 percent of total outstanding loans in 2017
Rural commercial banks who meet an earlier requirement that at least 10 percent of new lending is local can receive a 1 percentage point reduction
The RRR is the Reserve Requirement Ratio. This is a targeted easing of lending requirements aimed at directing credit to small and medium sized enterprises (SMEs) rather than state owned enterprises (SOEs) and encouraging lending to the agricultural sector. It also favour banks over the shadow banking sector. This policy shift was a rapid response to a trend which has been evident this year. Whilst credit continues to expand the percentage of credit directed to SMEs dropped from 50% in 2016 to 30% in 2017 – this policy aims to rebalance the supply of credit.
Despite expectations that the first half of 2017 would be strongest, the Chinese economy continues to grow above official forecasts, Q3 GDP came in at 6.8%. M2 money supply growth, by contrast, was only 8.8% in October versus 9.2% in September. The chart below shows the declining pattern over the past five years:-
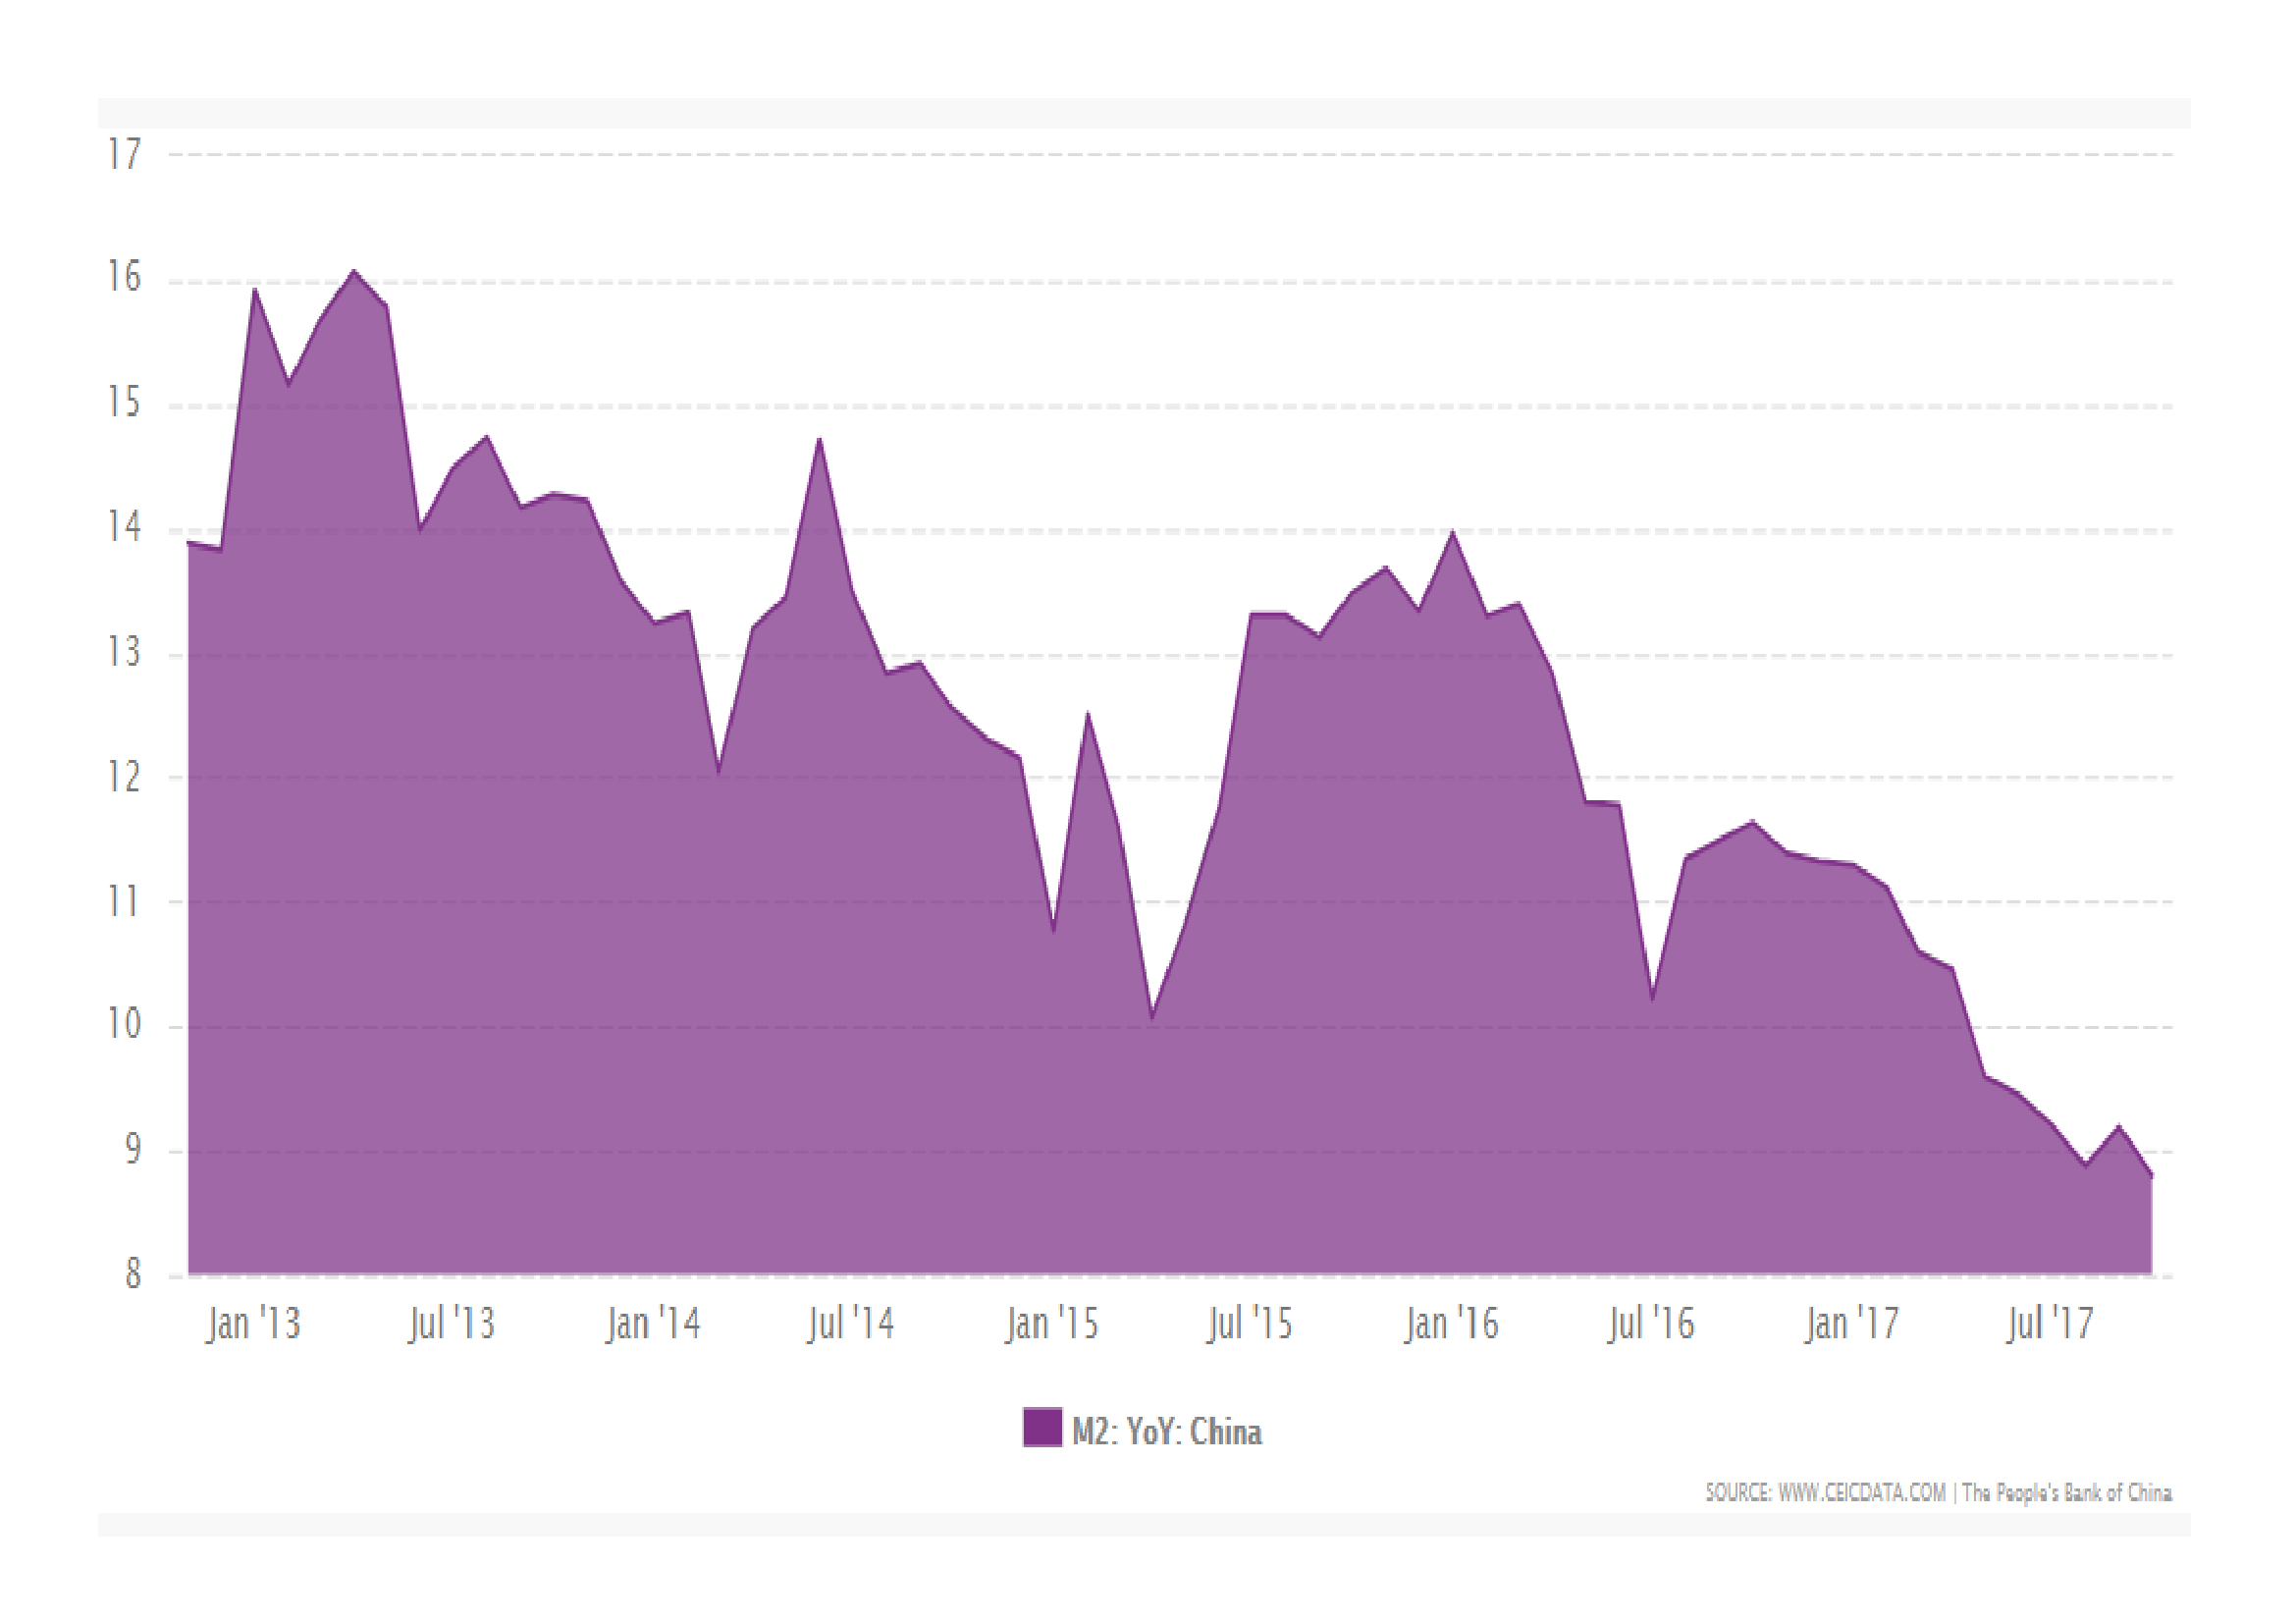
Source: CEIC, PBoC
8.8% M2 growth still looks high when compared with the US (6%) the EU (5.1%) or Japan (3.9%) but with GDP increasing by 6.8% it does not look excessive. It is worth noting, however, that the PBoC target for M2 growth in 2017 is 12% down from 13% in 2016.
What impact has this had on stocks? Not much, so far, is the answer:-

Source: Trading Economics, Shanghai SE
Chinese stocks, as I have mentioned previously, do not look excessively expensive by several measures, however, this is not to suggest that they will not fall. According to Star Capital, at the end of September the PE ratio for China was 7.6 but the CAPE ratio was a much higher 17.3. The Dividend yield (3.9%) offers some comfort nonetheless.
Conclusions and Investment Opportunities
Chinese economic growth remains spectacular but the authorities are interested in promoting inclusive growth rather than encouraging individual speculation. Official interest rates have been 4.35% since October 2015, which is the lowest they have ever been, however, the reverse repo rate was increased in January from 2.25% to 2.45% and the standing loan facility rate increased in March from 3.1% to 3.3%. The bond market expects this mild tightening bias to continue. Meanwhile, inflation, which was 1.9%, up from 0.8% in February, is hardly cause for concern.
Chinese stocks can be divided into SOEs and Non-SOEs. Since the beginning of 2017 the sectors have diverged sharply, as this chart of the WisdomTree China ex-State-Owned Enterprises Fund (CXSE) versus the MSCI China Index (NDEUCHF), indicates:-

Source: WisdomTree, MSCI
Even since the end of November, when stocks fell abruptly, the outperformance of, what some are calling new-China, has been maintained. This is not to suggest that PBoC policy is deliberately designed to support the new-China economy, but when the interests of the Chinese people and that of enterprises align it can be a winning combination.
It is still too soon to predict the end of the rise in Chinese stocks, the authorities, however, are determined not to allow a repeat of the speculative bubble of 2015. The combination of a continued decline in the pace of money supply growth and higher bond yields, may see Chinese stocks decline in response to monetary tightening before those of developed nation countries. Chinese stocks trade differently to those listed in more open markets, nonetheless, the importance of China should not be underestimated: it might even be the leading indicator for world markets.

![]()
Macro Letter – No 87 – 24-11-2017
Bull market breather or beginning of the end?
Stock markets have finally taken a breather over the last fortnight, although the S&P 500 has made a new, marginal, high this week. Cause for concern has been growing, however, in the bond markets where 2yr US bonds have seen a stately rise in yields. The chart below shows the constant maturity 2yr (blue) and 10yr (red) Treasury Note since January 2016:-
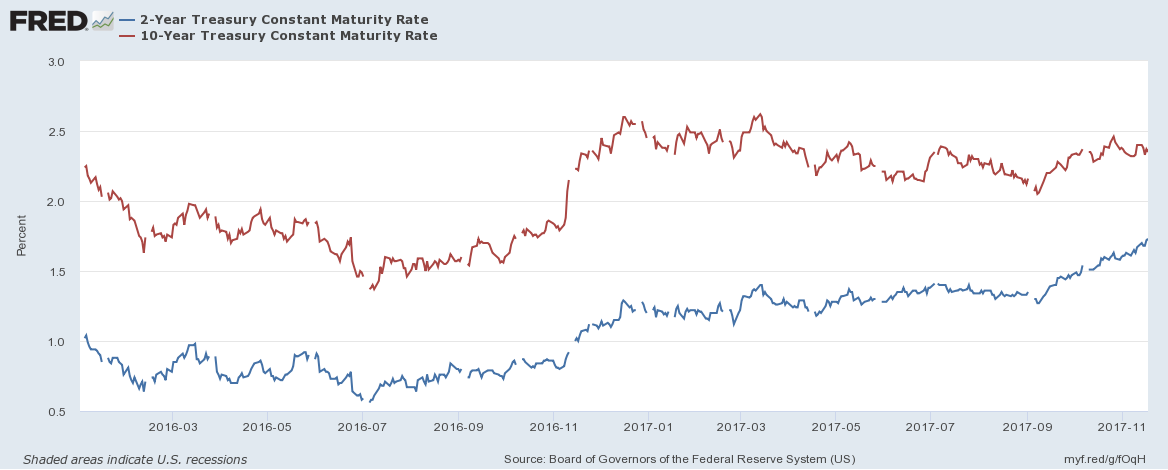
Source: Federal Reserve Bank of St Louis
The flattening of the yield curve has led many commentators to predict an imminent recession. Looking beyond the Treasury market, however, the picture looks rather different. The next chart shows the spread of Moody’s Aaa and Baa corporate bond yields over 10yr Treasuries:-
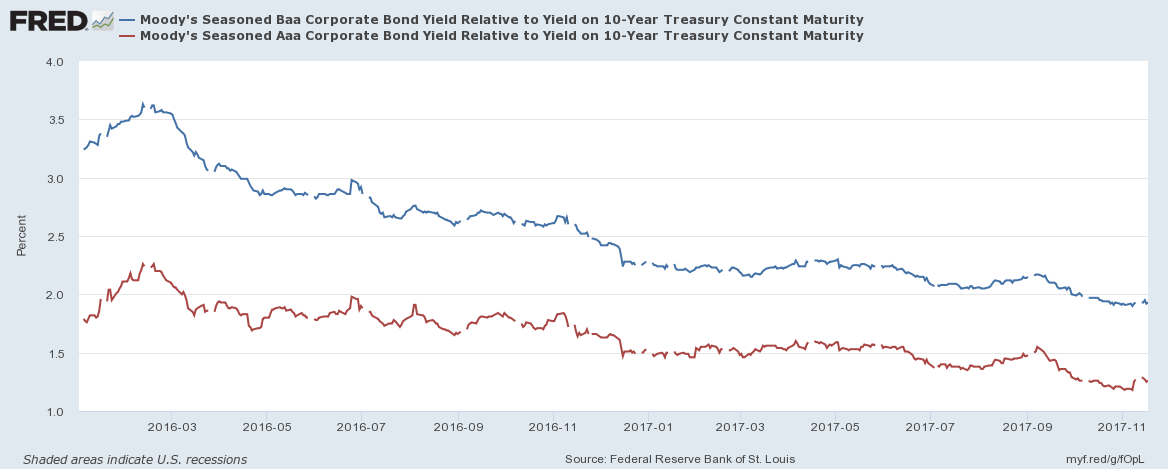
Source: Federal Reserve Bank of St Louis, Moody’s
Spreads have continued to tighten despite the rise in short-term rates. In absolute terms their yields have risen since the beginning of November but this is from record lows. The High Yield Index (purple) shows this more clearly in the chart below:-
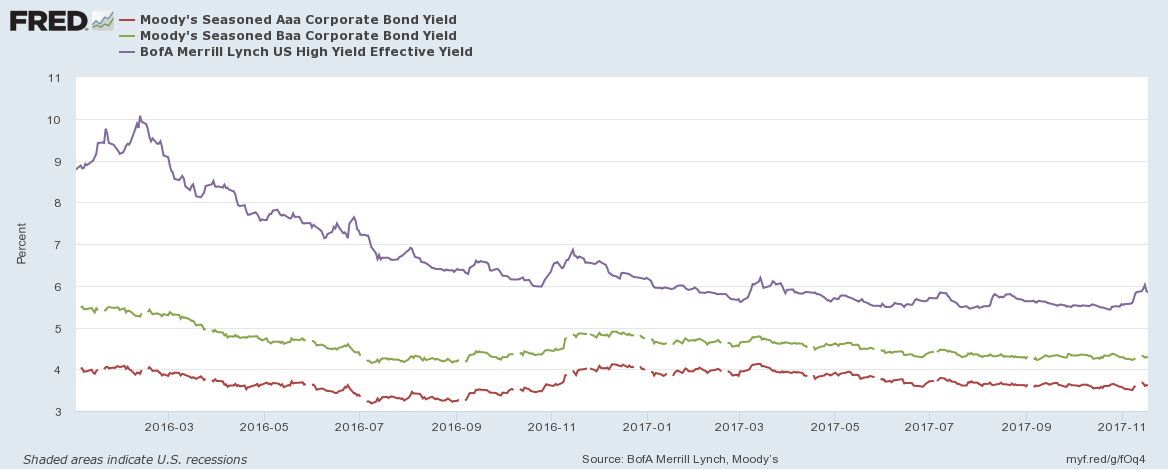
Source: Federal Reserve Bank of St Louis, Moody’s, Merrill Lynch
A similar spike in yields was evident in November 2016. I believe, in both cases, this may be due to position squaring ahead of the Thanksgiving holidays and the inevitable decline in liquidity typical of December trading. There are differences between 2016 and this year, however, the strength of the high-yield bond bull market was even more pronounced last year but Treasury 2yr Note yields had only bottomed in July, it was too soon to predict a bear market and the Federal Reserve were assuming a less hawkish stance. This year the rising yield of 2yr Notes has been more clear-cut, which may encourage further liquidation over the next few weeks, however, with economic growth forecasts being revised higher, rating agencies have upgraded many corporate issuers. Credit quality appears to be improving even as official interest rates rise and the US Treasury yield curve flattens.
In Macro Letter – No 74 – 07-04-2017 – US 30yr Swaps have yielded less than Treasuries since 2008 – does it matter? I examined the evolution of the interest rate swap (IRS) market over the last few years. I’ve updated the table showing the spread between T-Bonds and IRS across maturities:-
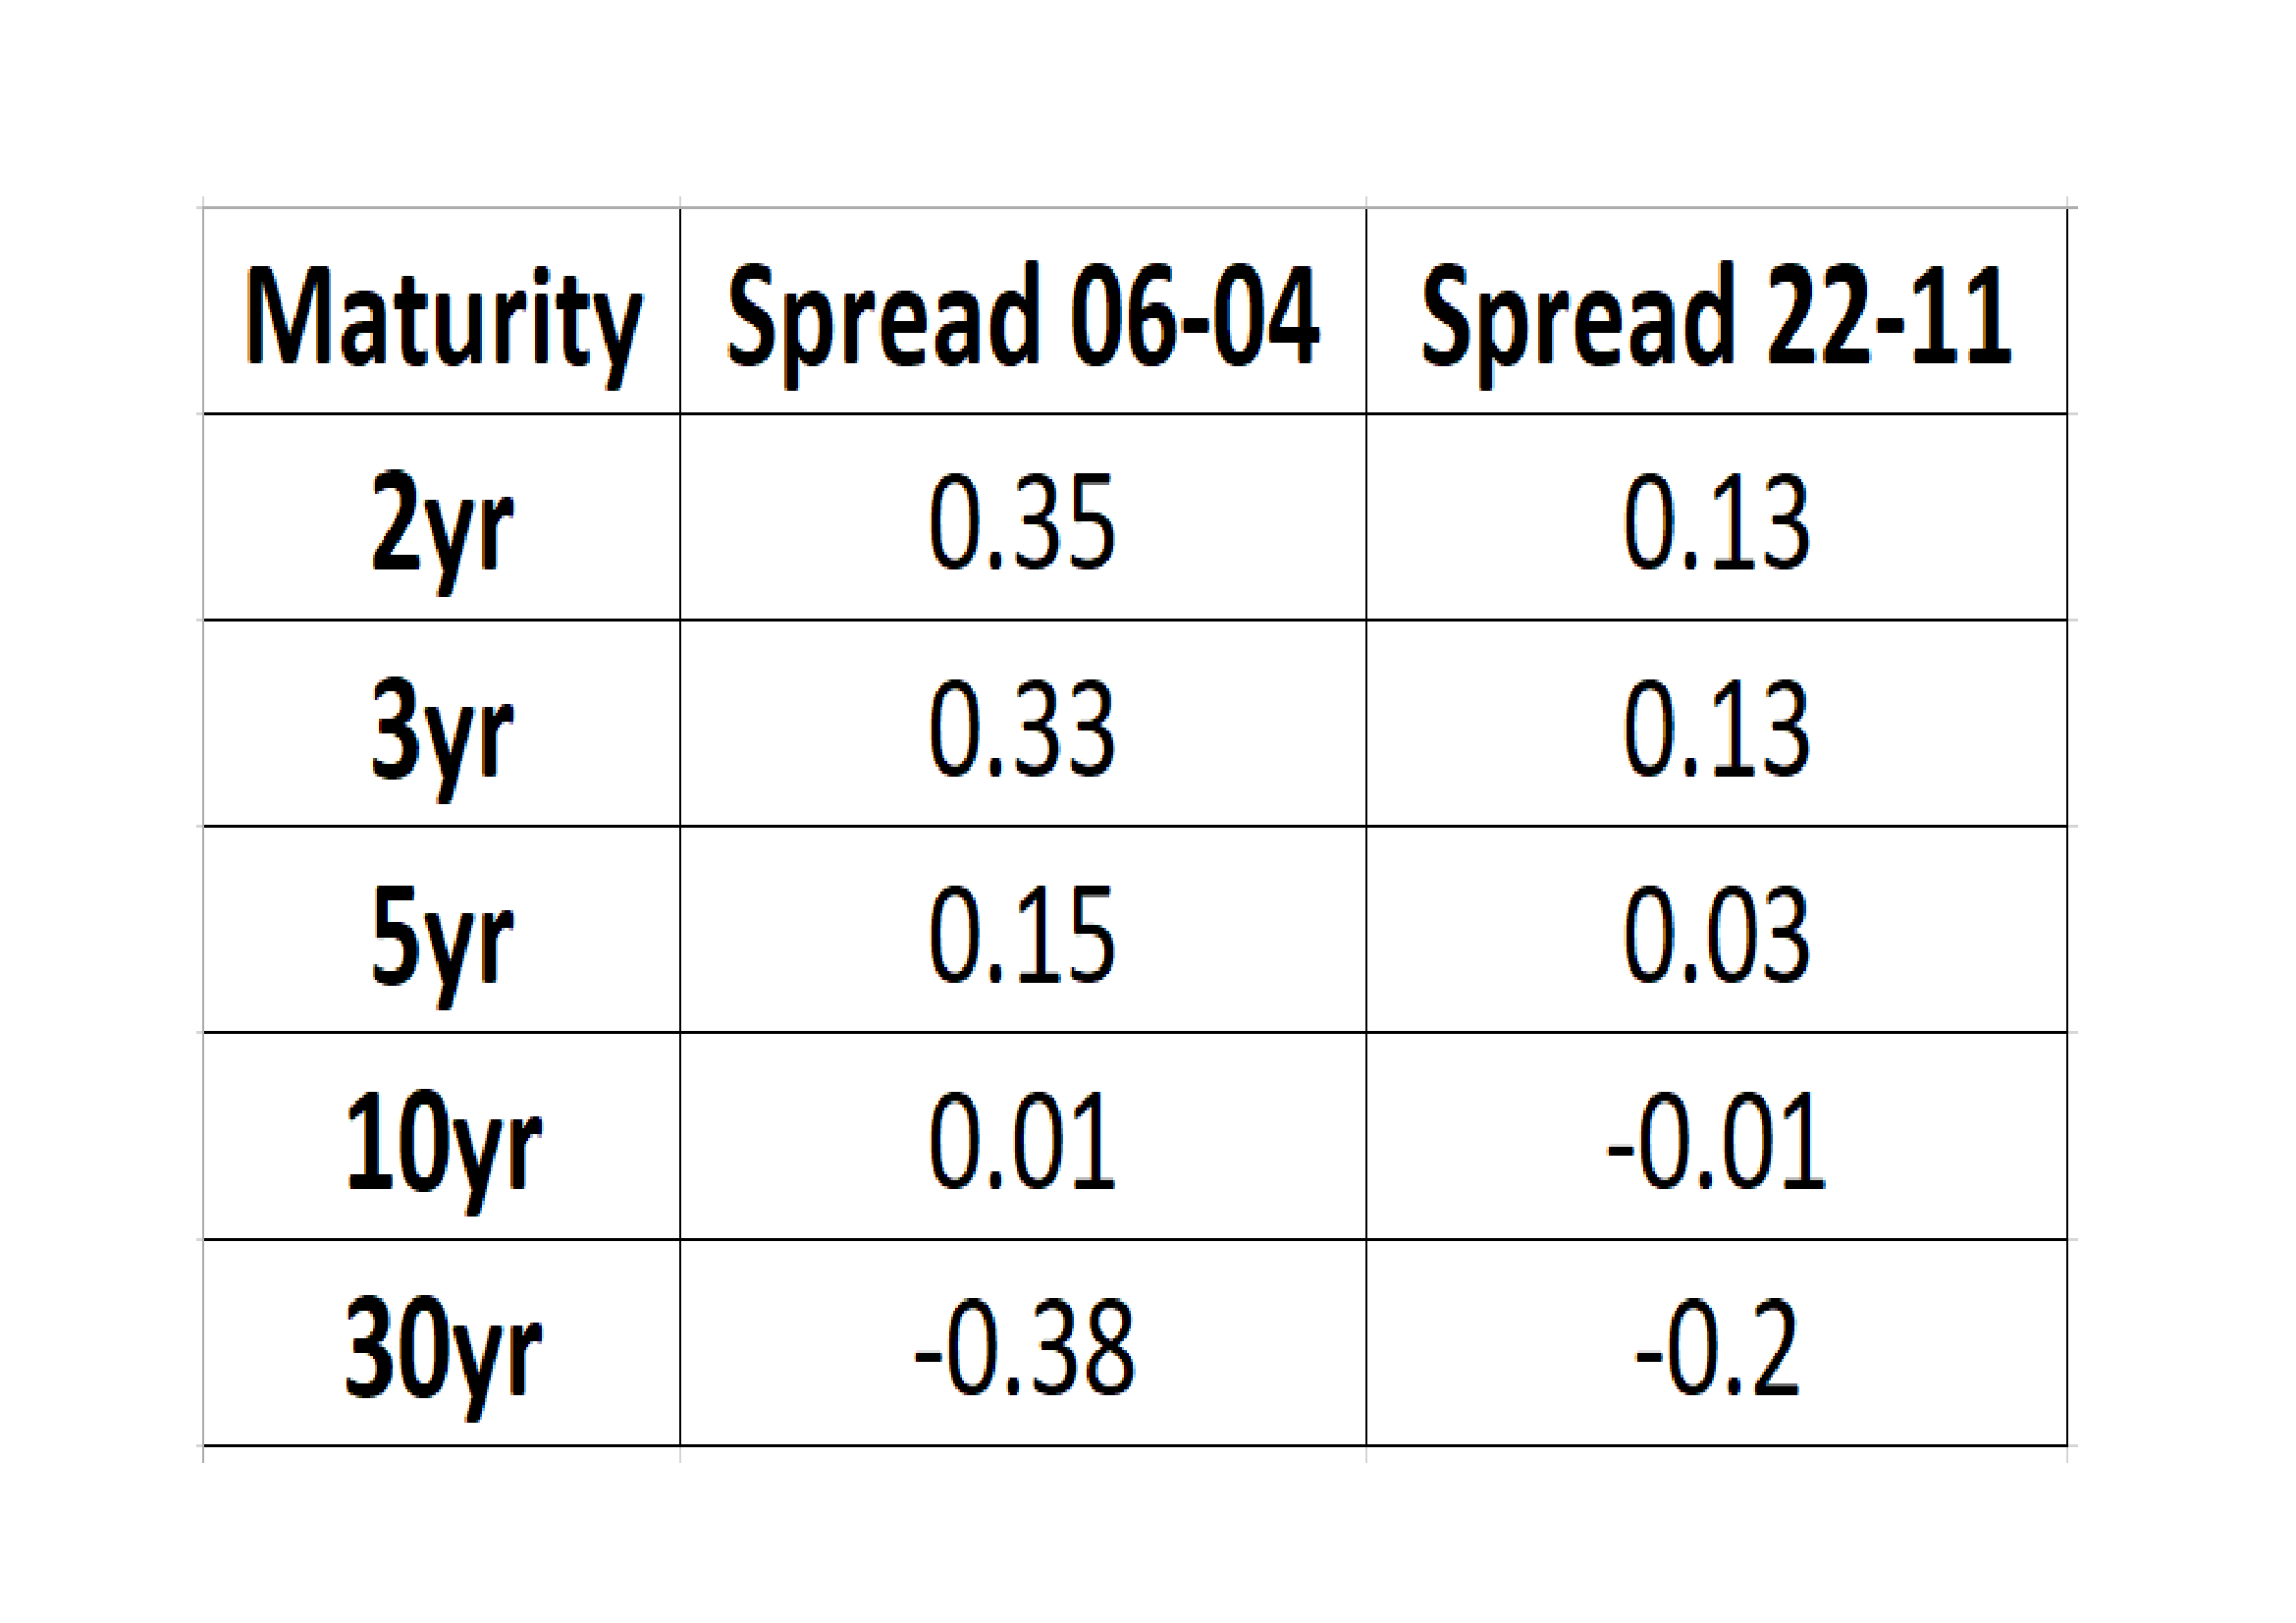
Source: Investing.com, The Financials.com
At the 10yr maturity the differential between IRS and Treasuries has barely changed, but elsewhere along the yield curve, compression has occurred, with maturities of less than 10 years narrowing whilst the 30yr IRS negative spread has also compressed, from nearly 40 basis points below Treasuries to just 20 basis points today. In other words, the flattening of the IRS yield curve has been much less dramatic than that of the Treasury yield curve – 2yr/30yr IRS has flattening by 36 basis points since early April, whilst 2yr/30yr Treasuries has flattened by 76 basis points over the same period.
It is important to note that while the IRS curve has been flattening less rapidly it still remains flatter than the Treasury curve (IRS 2’s/30’s = 0.67% Treasury 2’s/30’s = 1.00%). One interpretation is that the IRS curve has been reflecting the weakness of economic growth for a protracted period while the Treasury curve has been artificially steepened by the zero interest rate policy of the Federal Reserve.
Conclusions and Investment Opportunities
Many commentators have pointed to the flattening of the Treasury yield curve as evidence of an imminent recession, the IRS curve, however, has flattened by far less, partly because it was flatter to begin with. Perhaps the IRS curve reflects the lower trend growth of the US economy since the great recession. An alternative explanation is that it is a response to investment flows and changes in the regulatory regime (as discussed in Macro letter – No74). One thing appears clear, the combination of unconventional central bank policies, such as quantitative easing (QE) and the relentless, investor ‘quest for yield’ over the last decade has distorted the normal signalling power of the bond market.
Economic growth forecasts continue to be revised upwards, prompting central banks to begin reducing the quantum of QE in aggregate. Corporate earnings have generally been rising, credit quality improving. We are nearer the end of the bull market than the beginning, but it is much too soon to predict the end, on the basis of the recent rise in corporate bond yields.


Macro Letter – Supplemental – No 4 – 12-5-2017
Is there any value in the government bond markets?
Since the end of the great financial recession, bond yields in developed countries have fallen to historic lows. The bull market in stocks which began in March 2009, has been driven, more than any other factor, by the fall in the yield of government bonds.
With the Federal Reserve now increasing interest rates, investors are faced with a dilemma. If they own bonds already, should they continue to remain invested? Inflation is reasonable subdued and commodity prices have weakened recently as economic growth expectations have moderated once more. If investors own stocks they need to be watching the progress of the bond market: bonds drove stocks up, it is likely they will drive them back down as well.
The table below looks at the relative valuation between stocks and bonds in the major equity markets. The table (second item below) is ranked by the final column, DY-BY – Dividend Yield – Bond Yield, sometimes referred to as the yield gap. During most of the last fifty years the yield gap has been inverse, in other words dividend yields have been lower than bond yields, the chart directly below shows the pattern for the S&P500 and US 10yr government bonds going back to 1900:-
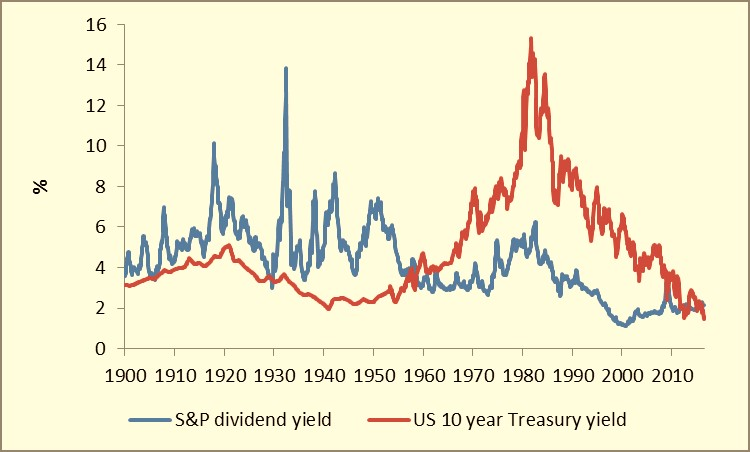
Source: Newton Investment Management
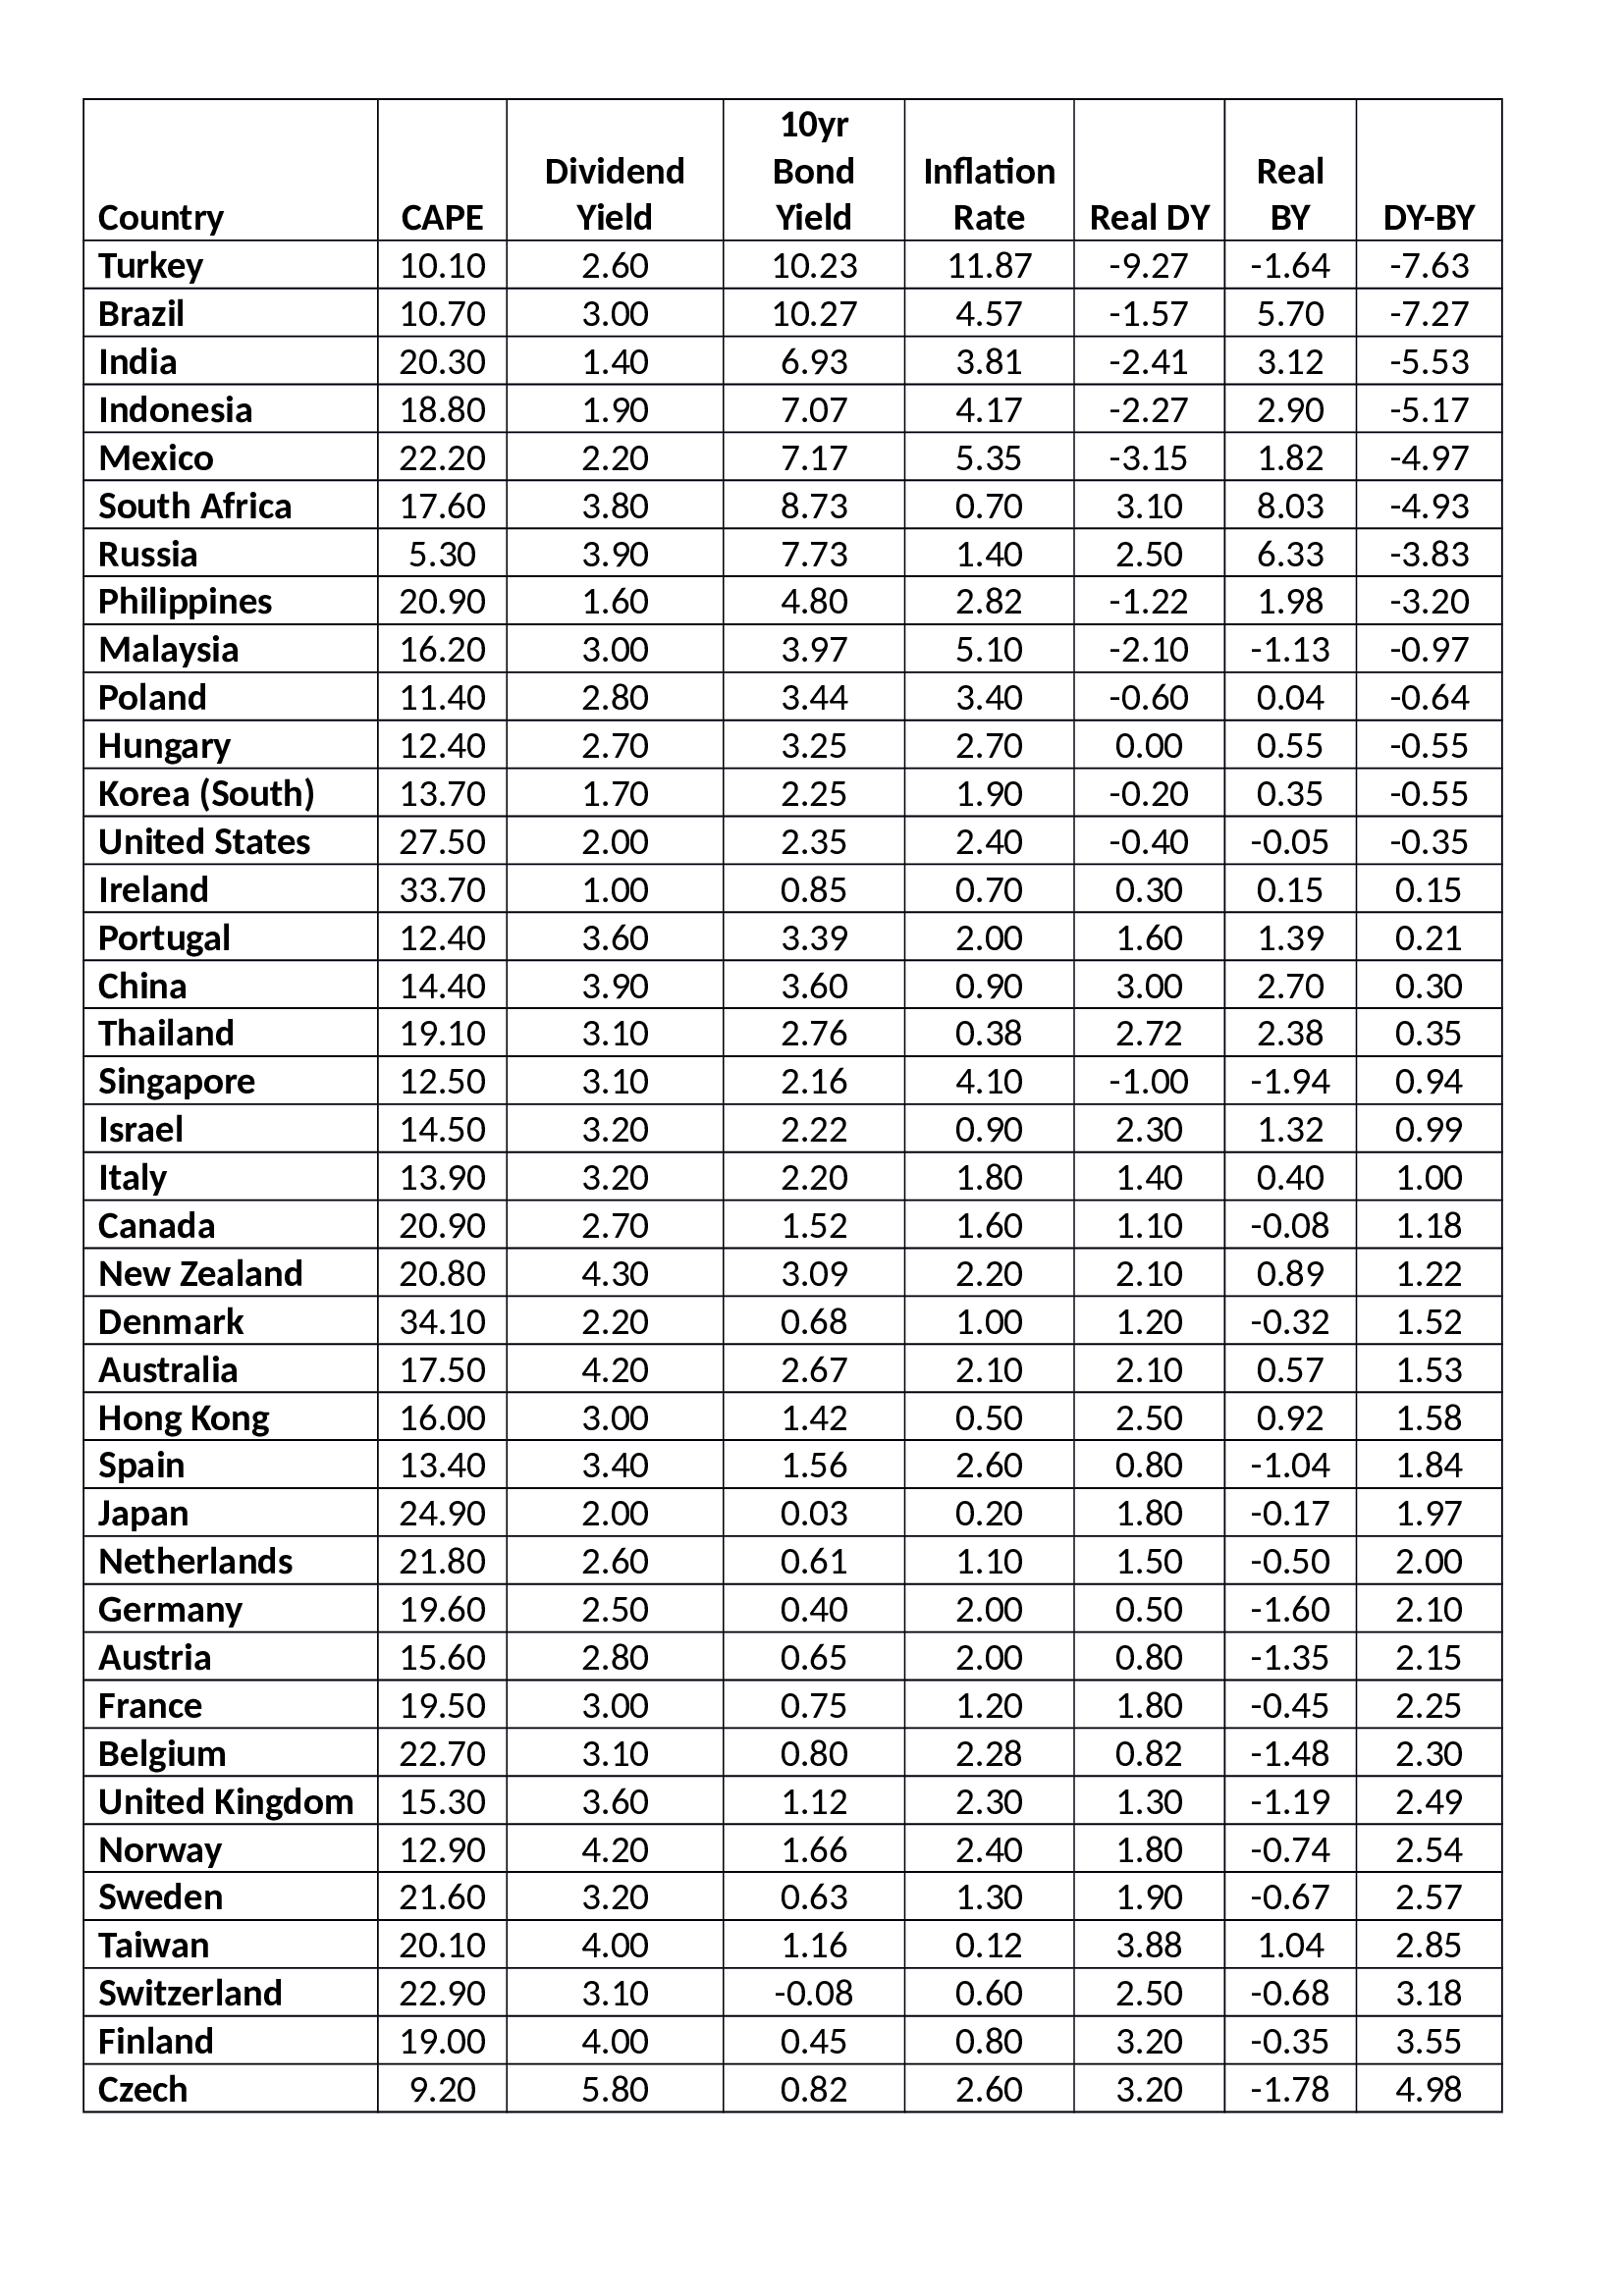
Source: StarCapital, Investing.com, Trading Economics
The CAPE – Cyclically Adjusted Price Earnings Ratio and Dividend Yield Data is from the end of March, bond yields were taken on Monday morning 8th May, so these are not direct comparisons. The first thing to notice is that an inverse yield gap tends to be associated with countries which have higher inflation. This is logical, an equity investment ought to offer the investor an inflation hedge, a fixed income investor, by contrast, is naturally hedged against deflation.
Looking at the table in more detail, Turkey tops the list, with an excess return, for owning bonds rather than stocks, of more than 7%, yet with inflation running at a higher rate than the bond yield, the case for investment (based simple on this data) is not compelling – Turkish bonds offer a negative real yield. Brazil offers a more interesting prospect. The real bond yield is close to 6% whilst the Bovespa real dividend yield is negative.
Some weeks ago in Low cost manufacturing in Asia – The Mighty Five – MITI V – I looked more closely at India and Indonesia. For the international bond investor it is important to remember currency risk:-
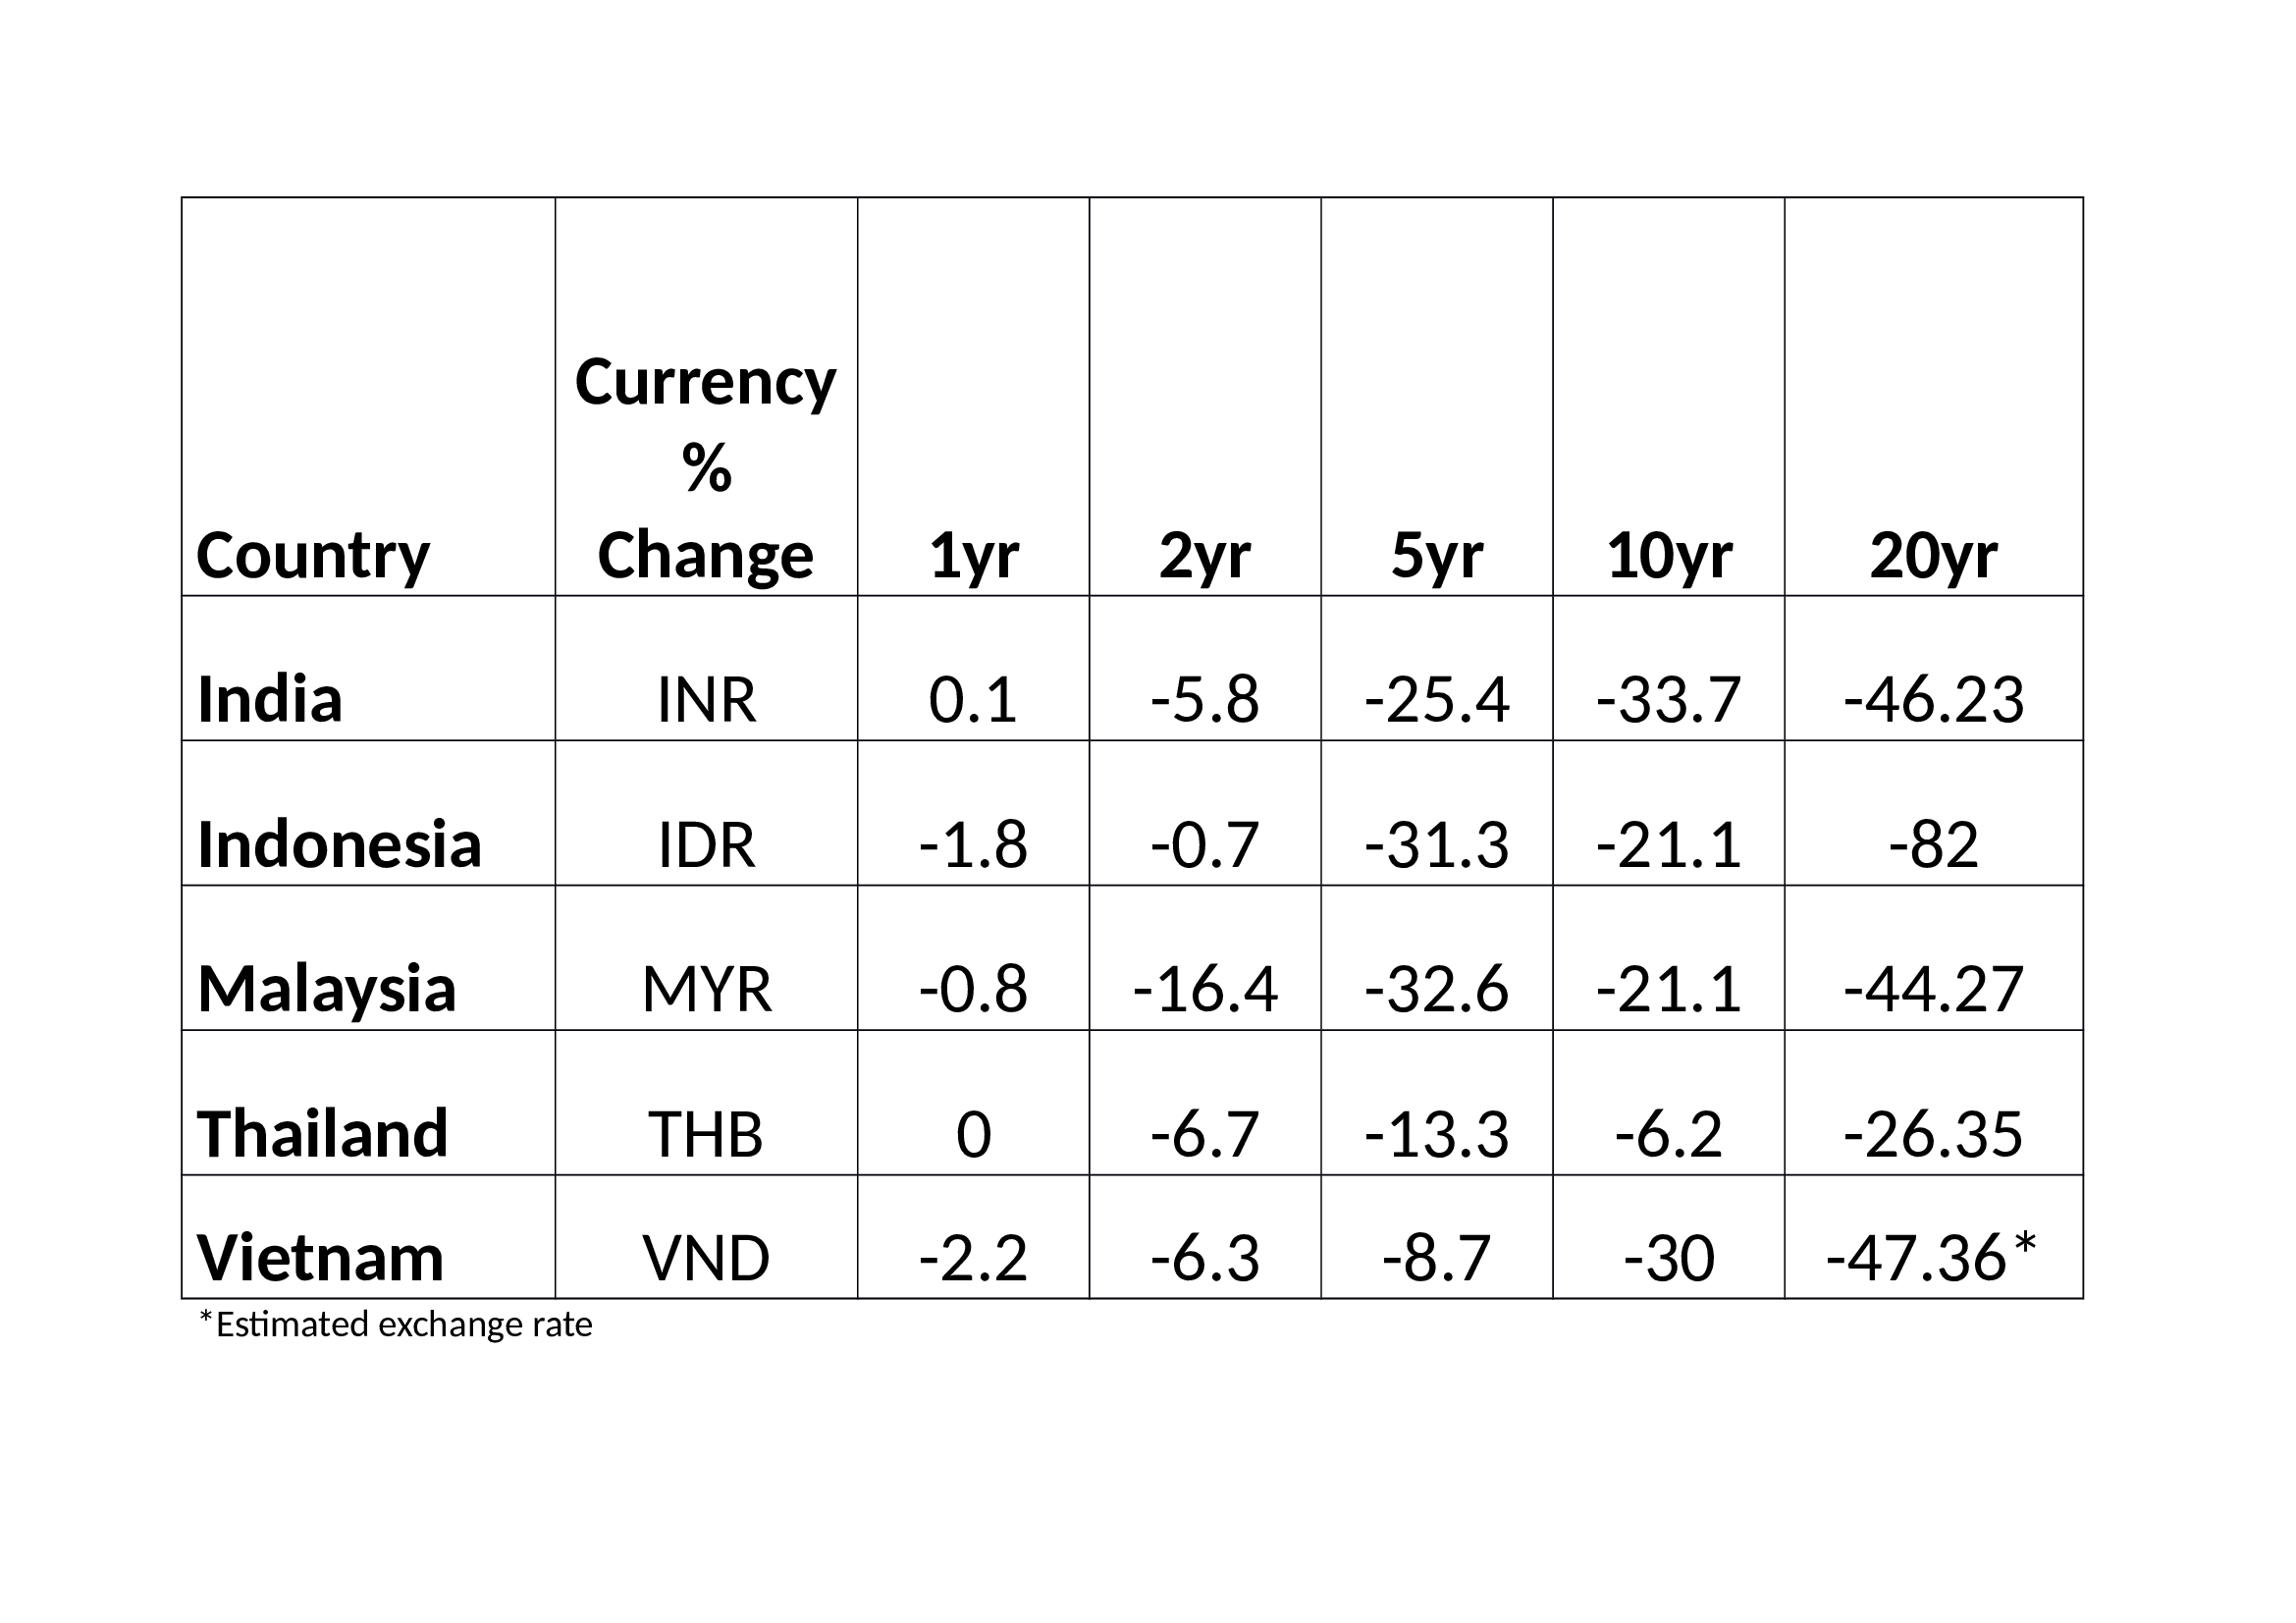
Source: Trading Economics, World Bank
If past performance is any guide to future returns, and all investment advisors disclaim this, then you should factor in between 2% and 4% per annum for a decline in the value of the capital invested in Indian and Indonesian bonds over the long run. This is not to suggest that there is no value in Indian or Indonesian bonds, merely that an investor must first decide about the currency risk. A 7% yield over ten years may appear attractive but if the value of the asset falls by a third, as has been the case in India during the past decade, this may not necessarily suffice.
Looking at the first table again, the relationship between bond yields in the Eurozone has been distorted by the actions of the ECB, nonetheless the real dividend yield for Finnish stocks at 3.2% is noteworthy, whilst Finnish bonds are not. Greek 10yr bonds are testing their lowest levels since August 2014 this week (5.61%) which is a long way from their highs of 2012 when yields briefly breached 40% during the Eurozone crisis. Emmanuel Macron’s election as France’s new President certainly helped but the German’s continue to baulk at issuing Eurobonds to bail out their profligate neighbours.
Conclusion and Investment Opportunity
Returning to the investor’s dilemma. Stocks and bonds are both historically expensive. They have been driven higher by a combination of monetary and quantitative easing by Central Banks and subdued inflation. For long-term investors such as pension funds, which need to invest in fixed income securities to match liabilities, the task is Herculean, precious few developed markets offer a real yield at all and none offer sufficient yield to match those pension liabilities.
During the bull-market these long-term investors actively increased the duration of their portfolios whilst at the same time the coupons on new issues fell steadily: new issues have a longer duration as well. It would seem sensible to shorten portfolio duration until one remembers that the Federal Reserve are scheduled to increase short term interest rates again in June. Short rates, in this scenario will rise faster than long-term rates. Where can the fixed income portfolio manager seek shelter?
Emerging market bonds offer limited liquidity since their markets are much smaller than those of the US and Europe. They offer the investor higher returns, but expose them to heady cocktail of currency risk, credit risk and the kind of geopolitical risk that ultra-long dated developed country bonds do not.
A workable solution is to consider credit and geopolitical risk at the outset and then actively manage the currency risk, or sub-contract this to an overlay manager. Sell long duration, low yielding developed country bonds and buy a diversified basket of emerging market bonds offering acceptable real return and, given that in many emerging markets corporate bonds offer lower credit risk than their respective government bond market, buy a carefully considered selection of liquid corporate names too. Sadly, many pension fund managers will not be permitted to make this type of investment for fiduciary reasons.
In answer to the original question in my title? Yes, I do believe there is still value in the government bond markets, but, given the absence of liquidity in many of the less developed markets – which are the ones offering identifiable value – the portfolio manager must be prepared to actively hedge using liquid markets to avoid a forced liquidation – currency hedging is one aspect of the strategy but the judicious use of interest rate swaps and options is a further refinement managers should consider.
This strategy shortens the duration of the bond portfolio because, not only purchase bonds with a shorter maturity, but also ones with a higher coupon. Actively managing currency risk (or delegating this role to a specialist currency overlay operator) whilst not entirely mitigating foreign exchange exposures, substantially reduces them.
Emerging market equities may well offer the best long run return, but a portfolio of emerging market bonds, with positive rather than negative real-yields, is far more compelling than continuously extending duration among the obligations of the governments of the developed world.

Macro Letter – No 74 – 07-04-2017
US 30yr Swaps have yielded less than Treasuries since 2008 – does it matter?
Global investors are drawn to US fixed income markets, among other reasons, because of the depth of liquidity. The long term investor, wishing to match assets against liabilities would traditionally purchase US Treasury bonds (T-bonds). This pattern of investment has not changed, but the yield on longer dated Treasuries has become structurally higher than the yield on interest rate swaps (IRS).
In a normally functioning market the lowest yield for a given maturity is usually the yield on government bonds – the so called risk free rate – however, regulatory and monetary policy changes have undermined this relationship.
Writing in March 2016 for Forbes, Darrell Duffie of Stanford University – Why Are Big Banks Offering Less Liquidity To Bond Markets? described the part of the story which relates to the repo market:-
The new Supplementary Leverage Ratio (SLR) rule changes everything for the repo market. For the largest U.S. banks, the SLR, meant to backstop risk-adjusted capital requirements, now requires 6% capital for all assets, regardless of their risk. For a typical large dealer bank, the SLR is a binding constraint and therefore pushes up the bank’s required equity for a $100 million repo trade by as much as for any other new position of the same gross size, for example a risky real estate loan of $100 million. This means that the bank’s required profit on a repo trade must be in the vicinity of the profit on a risky real estate loan in order for the repo trade to be viable for shareholder value maximization. That profit hurdle has become almost prohibitive for repo intermediation, so banks are providing dramatically less liquidity to the repo market. As a result, the spread between repo rates paid by non-banks and by banks has roughly tripled. The three-month treasury-secured repo rates paid by non-bank dealers are now even higher than three-month unsecured borrowing rates paid by banks, a significant market distortion. Trade volume in the bank-to-non-bank dealer market for U.S. government securities repo is less than half of 2012 levels.
Other factors that are distorting the Bond/Swap relationship include tighter macro prudential regulation and reduced dealer balance sheet capacity. Another factor is the activities of companies issuing debt.
Companies exchange floating rates of interest for fixed rates. When a company sells fixed-rate debt, it can use a swap to offset the payment of a bond coupon and pay a lower floating rate. Heavy corporate issuance can depress the spread between swaps and bonds. This can be exacerbated when dealers are swamped by sales of T-bonds. A combination of heavy company issuance being swapped and higher dealer inventories of Treasury debt, might explain why swap spreads turn negative over shorter periods.
Back in 2015, when the 10yr spread turned sharply negative, Deutsche Bank estimated that the long term fair value for swaps was 3bp higher than the same maturity T-bond. But negative spreads have continued. A side effect has been to raise the cost of US government financing, but Federal Reserve buying has probably more than compensated for this.
The declining volume of transactions in the repo market is one factor, the declining liquidity in the T-bond market is another. The quantitative easing policies of the Federal Reserve have lowered yields but they have also lowered liquidity of benchmark issues.
The final factor to consider is the demand for leveraged investment. One solution to the problem of matching assets versus liabilities is to leverage one’s investment in order to generate the requisite yield. This does, however, dramatically increase the risk profile of one’s portfolio. The easiest market in which to leverage a fixed income investment remains the IRS market but, as a white paper published last May – PNC – Why are swap rates trading below US Treasury Rates? highlights, the cost of leverage in the swap market has, if anything, increased more than in the bond repo market:-
The regulatory requirement for central clearing of most interest rate swaps (except for swaps with commercial end users) has removed counterparty risk from such swap contracts. Regulatory hedging costs and balance sheet constraints have also come into effect over the past few years. These rules have significantly reduced the market-making activity of swap dealers and increased the cost of leverage for such dealers. This is evidenced in the repo rates versus the Overnight Interest Swap* (OIS) basis widening. This basis widening strips rate expectations (OIS) from the pure funding premium (repo) rates. Swaps and Treasuries are less connected than in the past. The spread between them is a reflection of the relative demand for securities, which need to be financed, versus derivatives, which do not.
*The LIBOR-OIS Spread: The difference between LIBOR and OIS is called the LIBOR-OIS Spread and is deemed to be the health taking into consideration risk and liquidity. (An Overnight Index Swap (OIS) is a swap where the floating payments are based on the overnight Federal Funds Rate.)
For a more nuanced explanation, the publication, last month by Urban J. Jermann of the Wharton School, of a paper entitled – Negative Swap Spreads and Limited Arbitrage – is most insightful. Here are his conclusions based on the results of his arbitrage model:-
Negative swap spreads are inconsistent with an arbitrage-free environment. In reality, arbitrage is not costless. I have presented a model where specialized dealers trade swaps and bonds of different maturities. Costs for holding bonds can put a price wedge between bonds and swaps. I show a limiting case with very high bond holding costs, expected swap spreads should be negative. In this case, no term premium is required to price swaps, and this results in a significantly lower fixed swap rate. As a function of the level of bond holding costs, the model can move between this benchmark and the arbitrage-free case. The quantitative analysis of the model shows that under plausible holding costs, expected swap spreads are consistent with the values observed since 2008. Demand effects would operate in the model but are not explicitly required for these results.
My model can capture relatively rich interest rate dynamics. Conditional on the short rate, the model predicts a negative link between the term spread and the swap spread. The paper has presented some empirical evidence consistent with this property.
The chart below, which covers the period from 1999 up to Q3 2015, shows the evolution before and after the Great Financial Crisis. It is worth noting that the absolute yield may be an influence on this relationship too: as yields have risen in the past year, 30yr swap spreads have become less negative, 5yr and 10yr spreads have reverted to positive territory:-
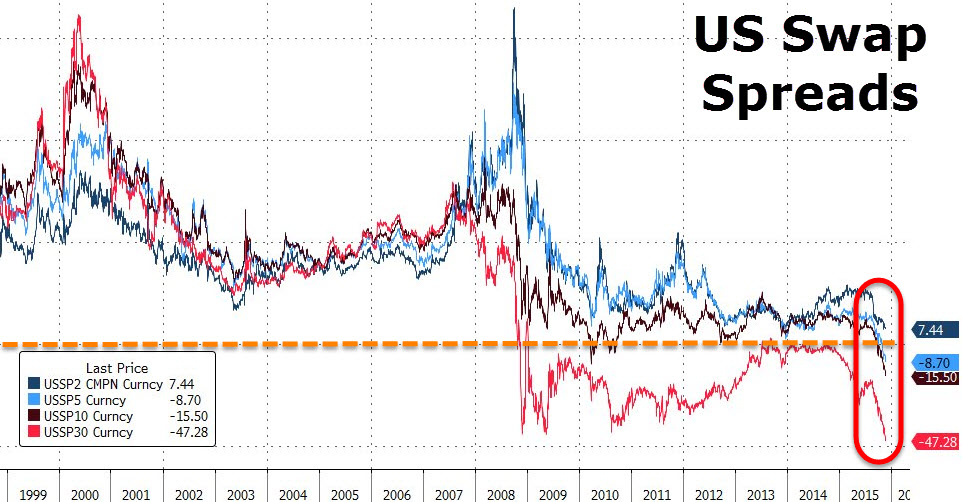
Source: ZeroHedge, Goldman Sachs
This table shows the current rates and spreads (6-4-2017):-

Source: Investing.com, The Financials.com
Conclusion and investment opportunity
The term “Risk-Free Rate” has always been suspect to my mind. As an investor, one seeks the highest return for the lowest risk. How different investors define risk varies of course, but, in public markets, illiquidity is usually high on the list of risks for which an investor would wish to be paid. If longer dated US T-bonds trade at a structurally higher yield than IRS’s, it is partly because they are perceived to lack their once vaunted liquidity. Dealers hold lower inventories of bonds, repo volumes have collapsed and central counterparty clearing of swaps has vastly reduced the counterparty risks of these, derivative, instruments. Added to this, as Jermann points out in his paper, frictional costs and uncertainty, about capital requirements and funding availability, make arbitrage between swaps and T-bonds far less clear cut.
When the German bond market collapsed during the unification crisis of the late 1980’s, it was Bund futures rather than Bunds which were preferred by traders. They offered liquidity and central counterparty clearing: and they did not require a repurchase agreement to set up the trade.
Today the IRS market increasingly determines the cost of finance, during the next crisis IRS yields may rise or fall by substantially more than the same maturity of US T-bond, but that is because they are the most liquid instruments and are only indirectly supported by the Central Bank.
At its heart, the Great Financial Crisis revolved around a drying up of liquidity in multiple financial markets simultaneously. Tightening of regulation and increases in capital requirements since the crisis has permanently reduced liquidity in many of these markets. Meanwhile, increasingly sophisticated technology has increased the speed at which liquidity provision can be withdrawn.
It behoves the Federal Reserve to become an active participant in the IRS market. Control of the swap market is likely to be the key to maintaining market stability, come the next crisis. IRS’s, replete with their leveraged investors, have assumed the mantle which was once the preserve of the US Treasury market.
In previous crises the “flight to quality” effect was substantial, in the next, with such a small free float of actively traded T-bonds, which are not already owned by the Federal Reserve, the effect is likely to be much greater. The latest FOMC Minutes suggest the Fed may turn its attention towards reducing the size of its balance sheet but the timing is still unclear and the first asset disposals are likely to be Mortgage Backed Securities rather than T-bonds.
Meanwhile, although interest rates have risen from historic lows they remain far below their long run average. Pension funds and other long term investors still require 7% or more in annualised returns in order to meet their liabilities. They are being forced to continuously increase their investment risk and many have chosen to use the swap market. The next crisis is likely to see an even more pronounced unravelling than in 2008/2009. The unravelling may not happen for some while but the stresses are likely to be focused on the IRS market.
