Macro Letter – No 133 – 06-11-2020
The prospects for Emerging and Frontier Markets in the post-Covid environment
- The Covid pandemic has accelerated several economic trends
- Technology industries will benefit
- Less developed countries will suffer
- This crisis could see ‘The African Century’ postponed
During the past six months the global economy has been assailed by a multitude of vicissitudes. But on closer inspection, the pandemic has served to accelerate a number of economic and political trends which were in train long before the outbreak in Q1 of this year.
Back in February, when the crisis was largely confined on China and financial markets were still in denial, I wrote in – When the facts change: –
Global supply chains have been shortening ever since the financial crisis, the Sino-US trade war has merely added fresh impetus to the process. As for financial markets, stock prices around the world declined in January but those markets farthest from the epicentre of the outbreak have since recovered in some cases making new all-time highs.
Then came the panic of March. Stocks collapsed, developed market government bonds rallied, the VIX Index quadrupled: and central banks and government Treasuries intervened to an unprecedented degree in order to right the ship. Our leaders triumphed, stock markets recovered, bond yields moderated, short-term interest rates in several emerging market economies were slashed and the policy of quantitative easing spread, from the ‘developed’ core, to countries which could barely have contemplated such asset purchases during previous global crisies. Here are few of the actions taken by EM central banks: –
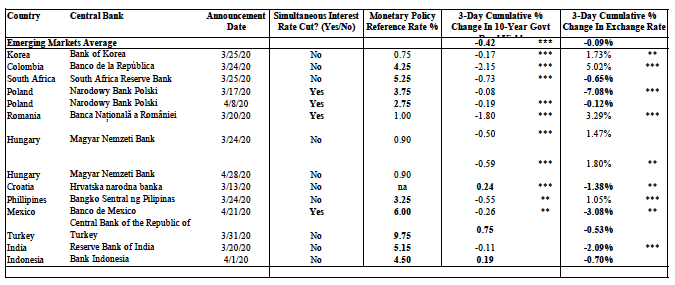
Source: VoxEU CEPR, Hartley and Rebucci
To some degree, masked by the gyrations of the stock market, certain longer-term economic trends have simply accelerated. Technology companies have taken centre-stage, with digital transformation changing the working practices of, perhaps, half the global labour-force. In the US it is estimated that the percentage of people now able to work remotely has risen from 41% to 59%, but whereas prior to the pandemic, remote work amounted to the occasional day, here or there, remote working has now become the new normal.
There has been a seismic shift in the real-estate market. Demand for commercial office space has declined, demand for larger residential units and for houses (with outdoor space) rather than apartments. This is an entirely predictable response to these changes in the nature of work.
Other technological trends have also accelerated. The robotics revolution is replacing humans in a wide array of industries in the way it transformed the car assembly line some decades ago. Add in advances in the digitisation of logistics and the era of ‘just in time production’ can much more effectively offset the higher cost of domestic manufacture. Global supply chains have been shortening since the great financial crisis. Since the spring these trends have gained additional momentum.
In March, in an article for AIER I asked – Is this the End of Globalization?Among the topics I discussed was the impact these supply chain trends may have on Emerging and Frontier markets: –
In his July 2019 essay for Project Syndicate, In Praise of Demographic Decline, Adair Turner observes:
Our expanding ability to automate human work across all sectors – agriculture, industry, and services – makes an ever-growing workforce increasingly irrelevant to improvements in human welfare. That’s good news for most of the world, but not for Africa.
The author goes on to suggest that for countries in demographic decline, automation of manufacturing processes is an economic boon, whereas for countries with rising fertility it is an impediment to improvements in their per capita standard of living.
As with many trends among developed countries, Japan, where deaths outnumber births by an average of 1,000 people per day, is in the vanguard in embracing technology to counter the demographic deficit. The shortening of GVC’s will simply hasten their innovation in automation.
I went on to look at the rising use of robots: –
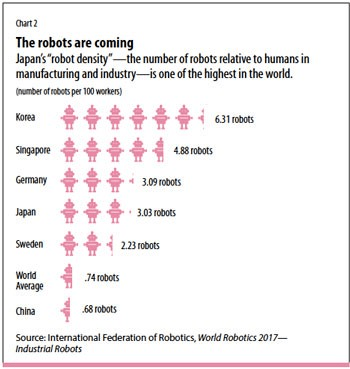
Source: IMF, International Federation of Robotics
The infographic above comes from a June 2018 IMF publication entitled, Land of the Rising Robotsin which the authors’ conclude: –
…the wave of change is clearly coming and will affect virtually all professions in one way or another. Japan is a relatively unique case. Given the population and labor force dynamics, the net benefits from increased automation have been high and could be even higher, and such technology may offer a partial solution to the challenge of supporting long-term productivity and economic growth.
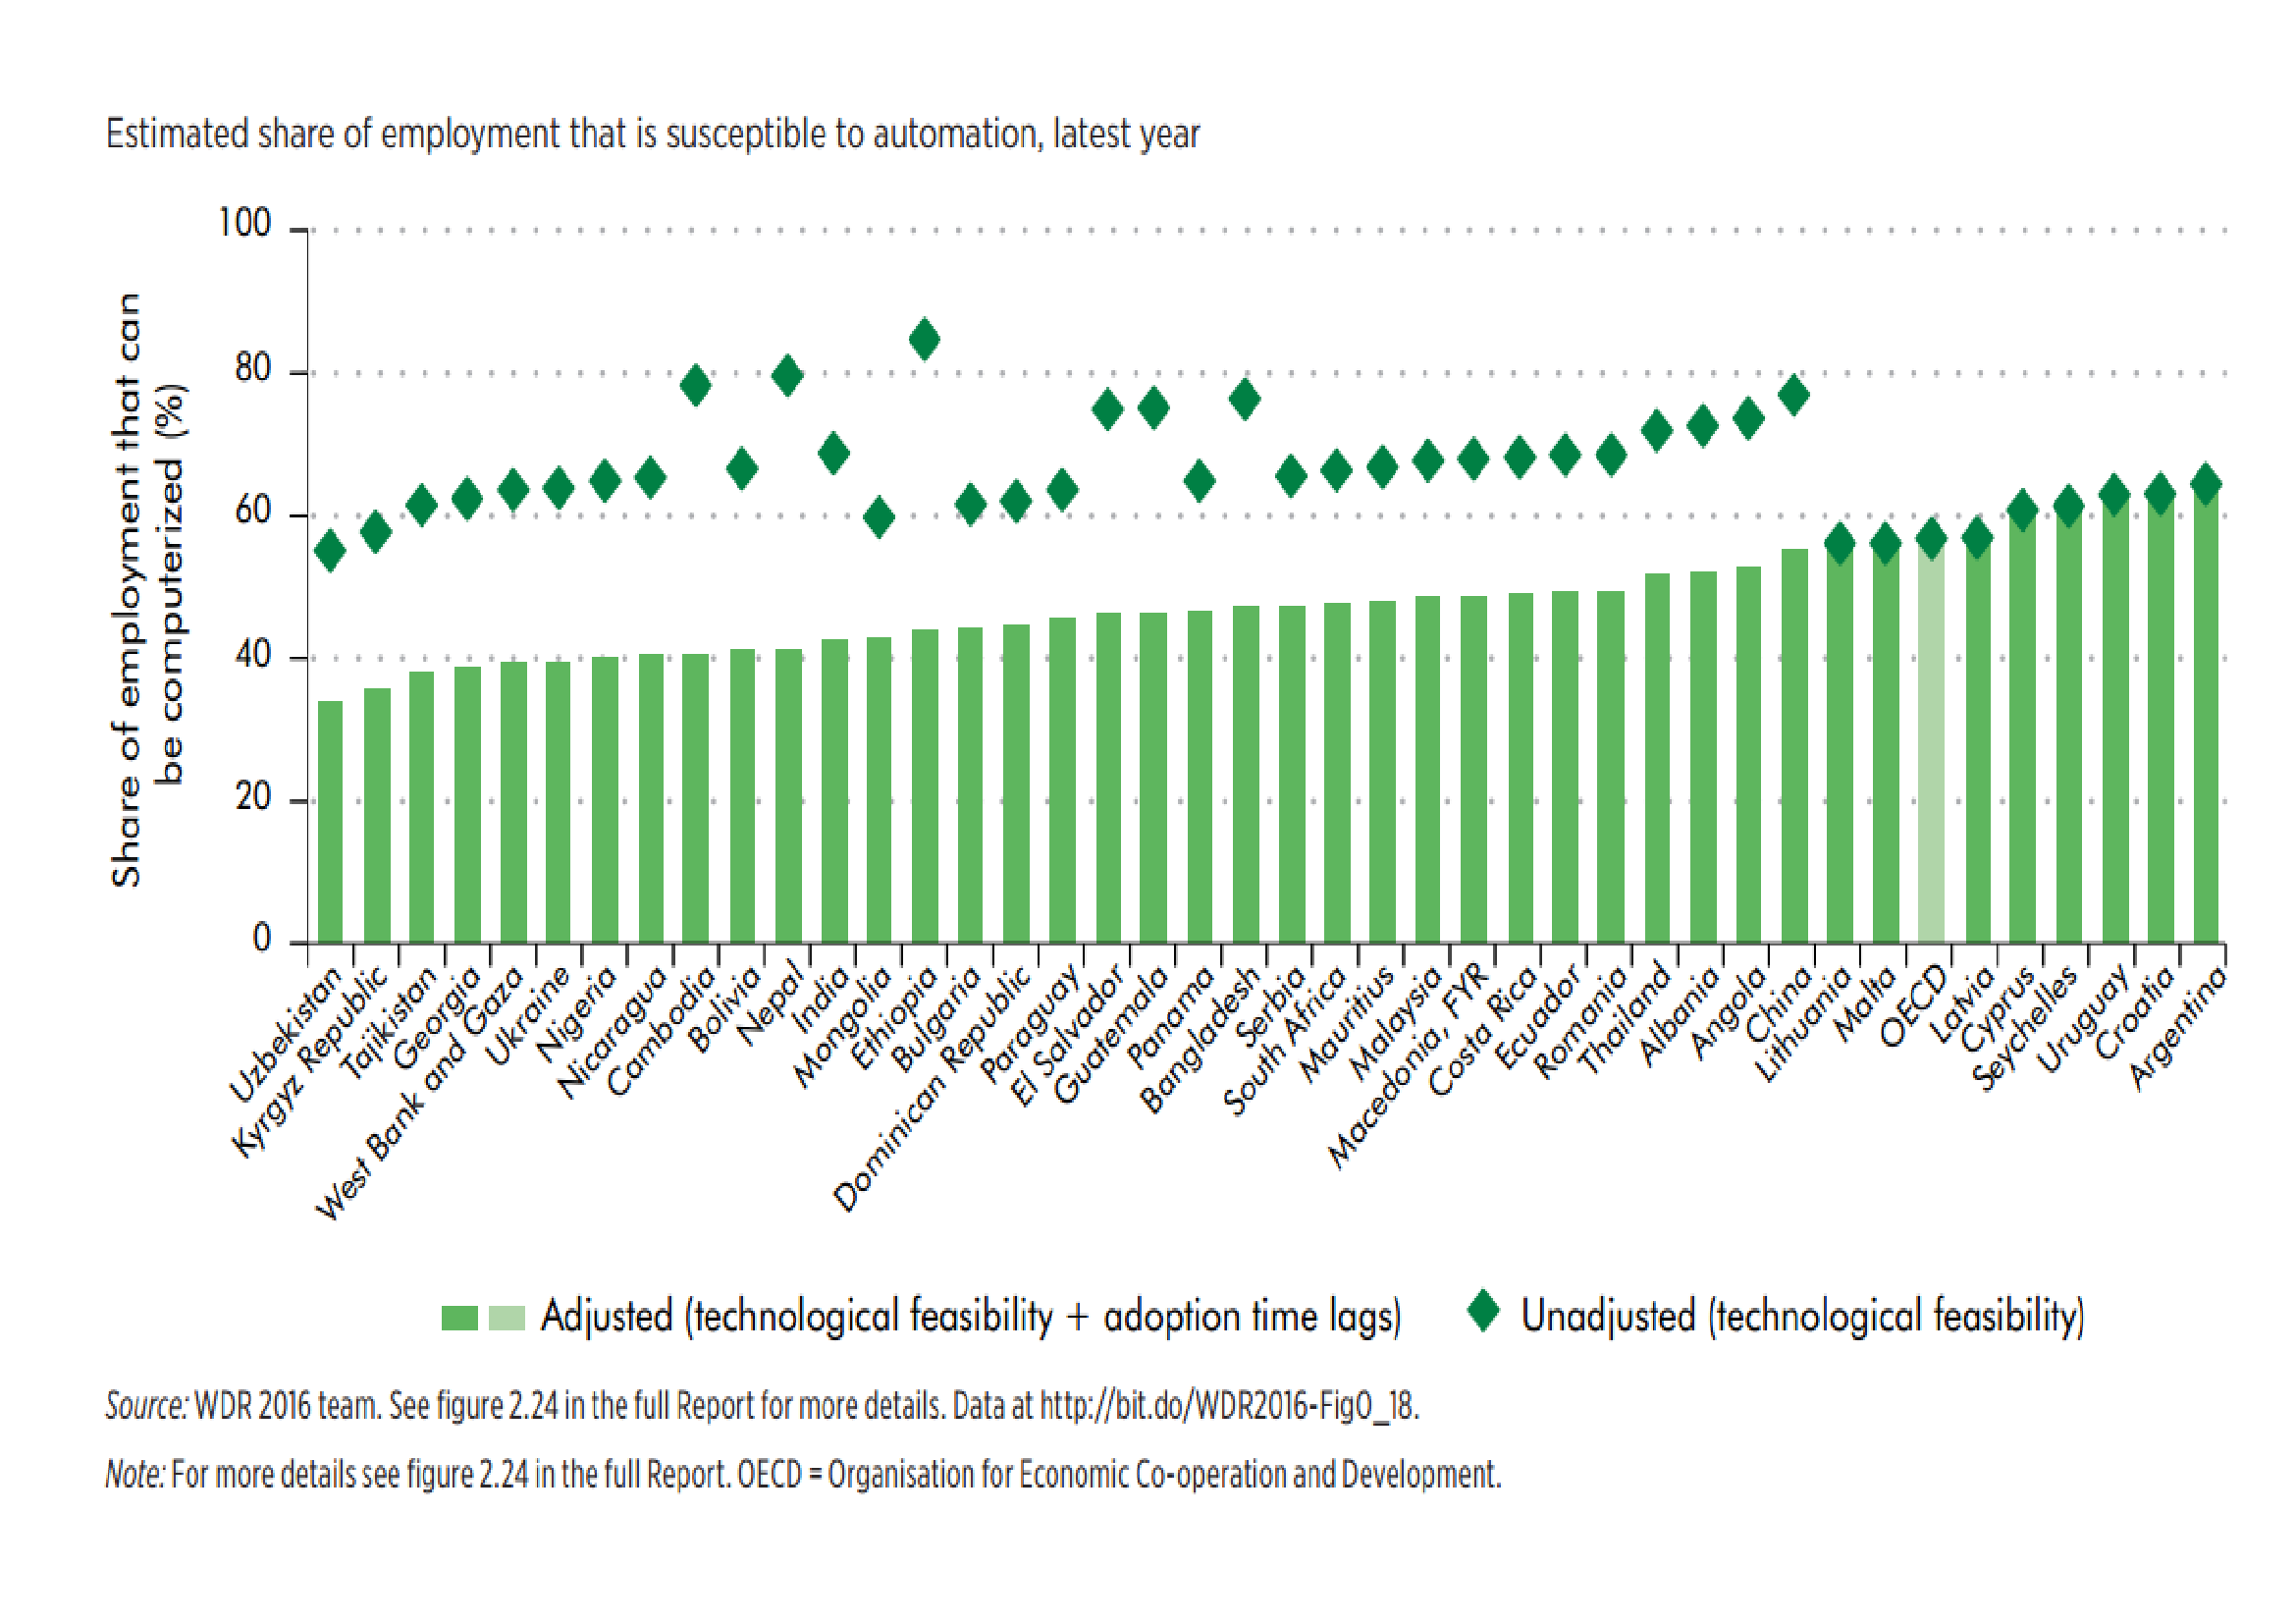
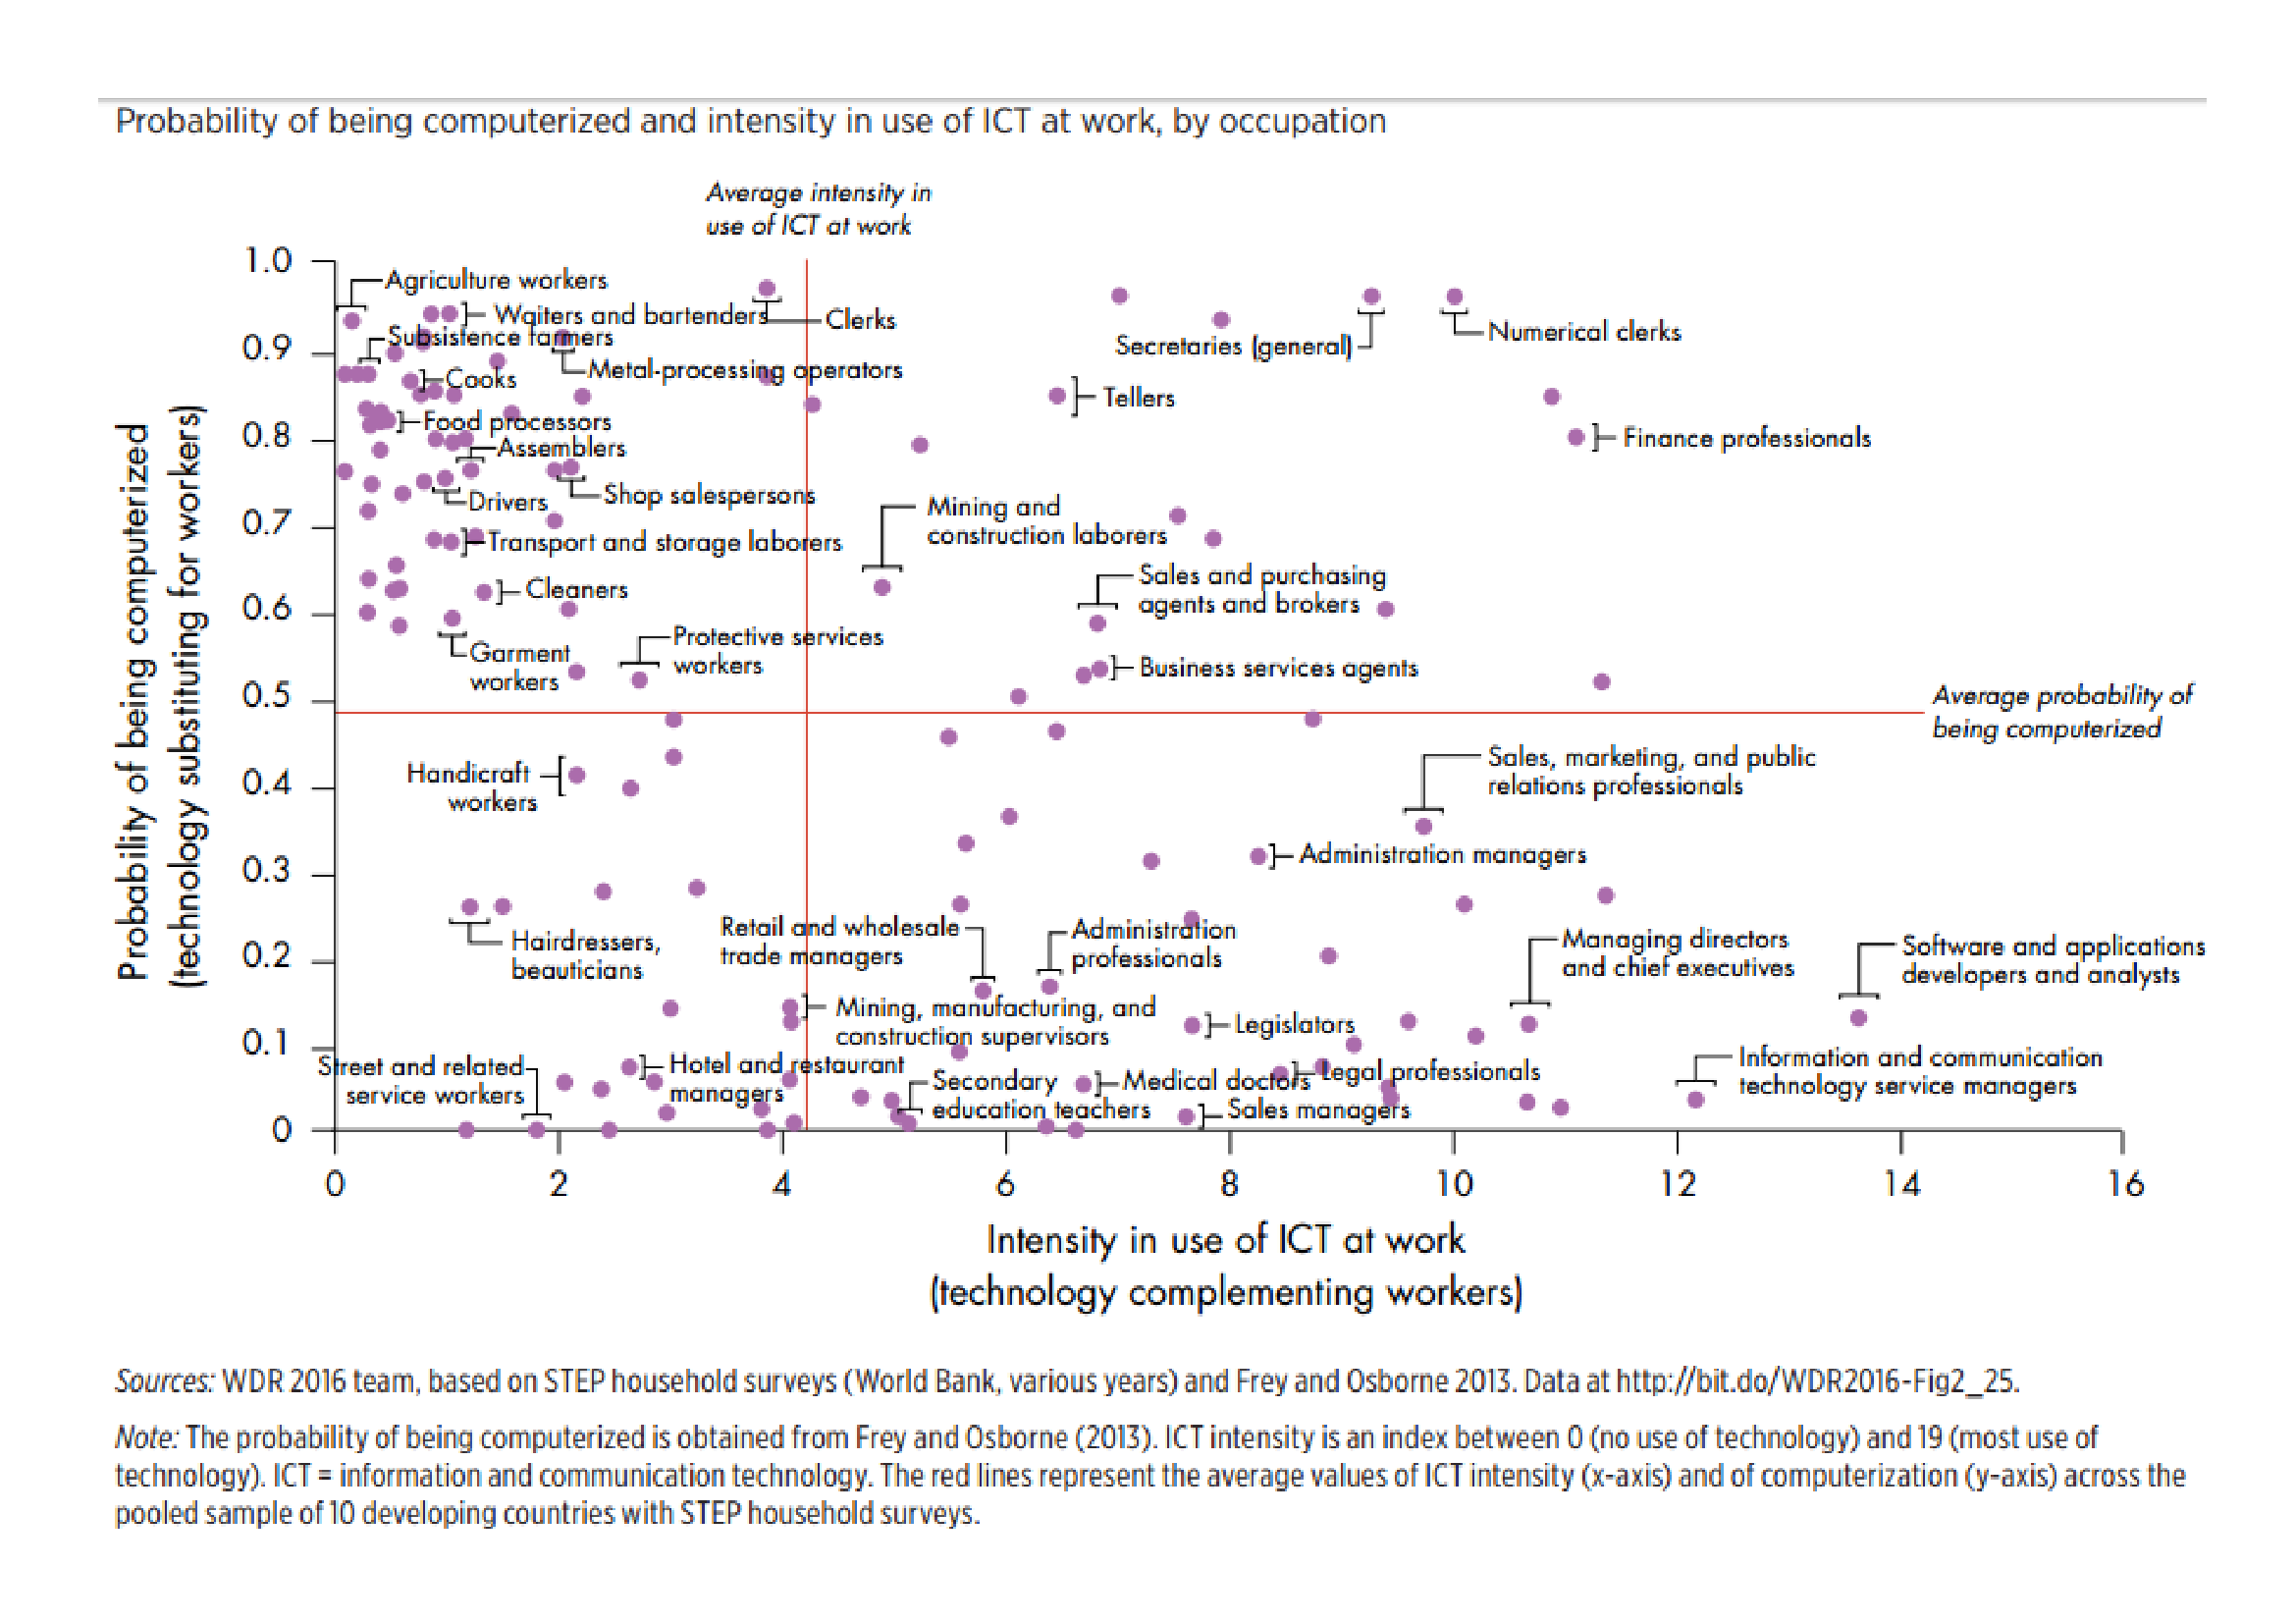
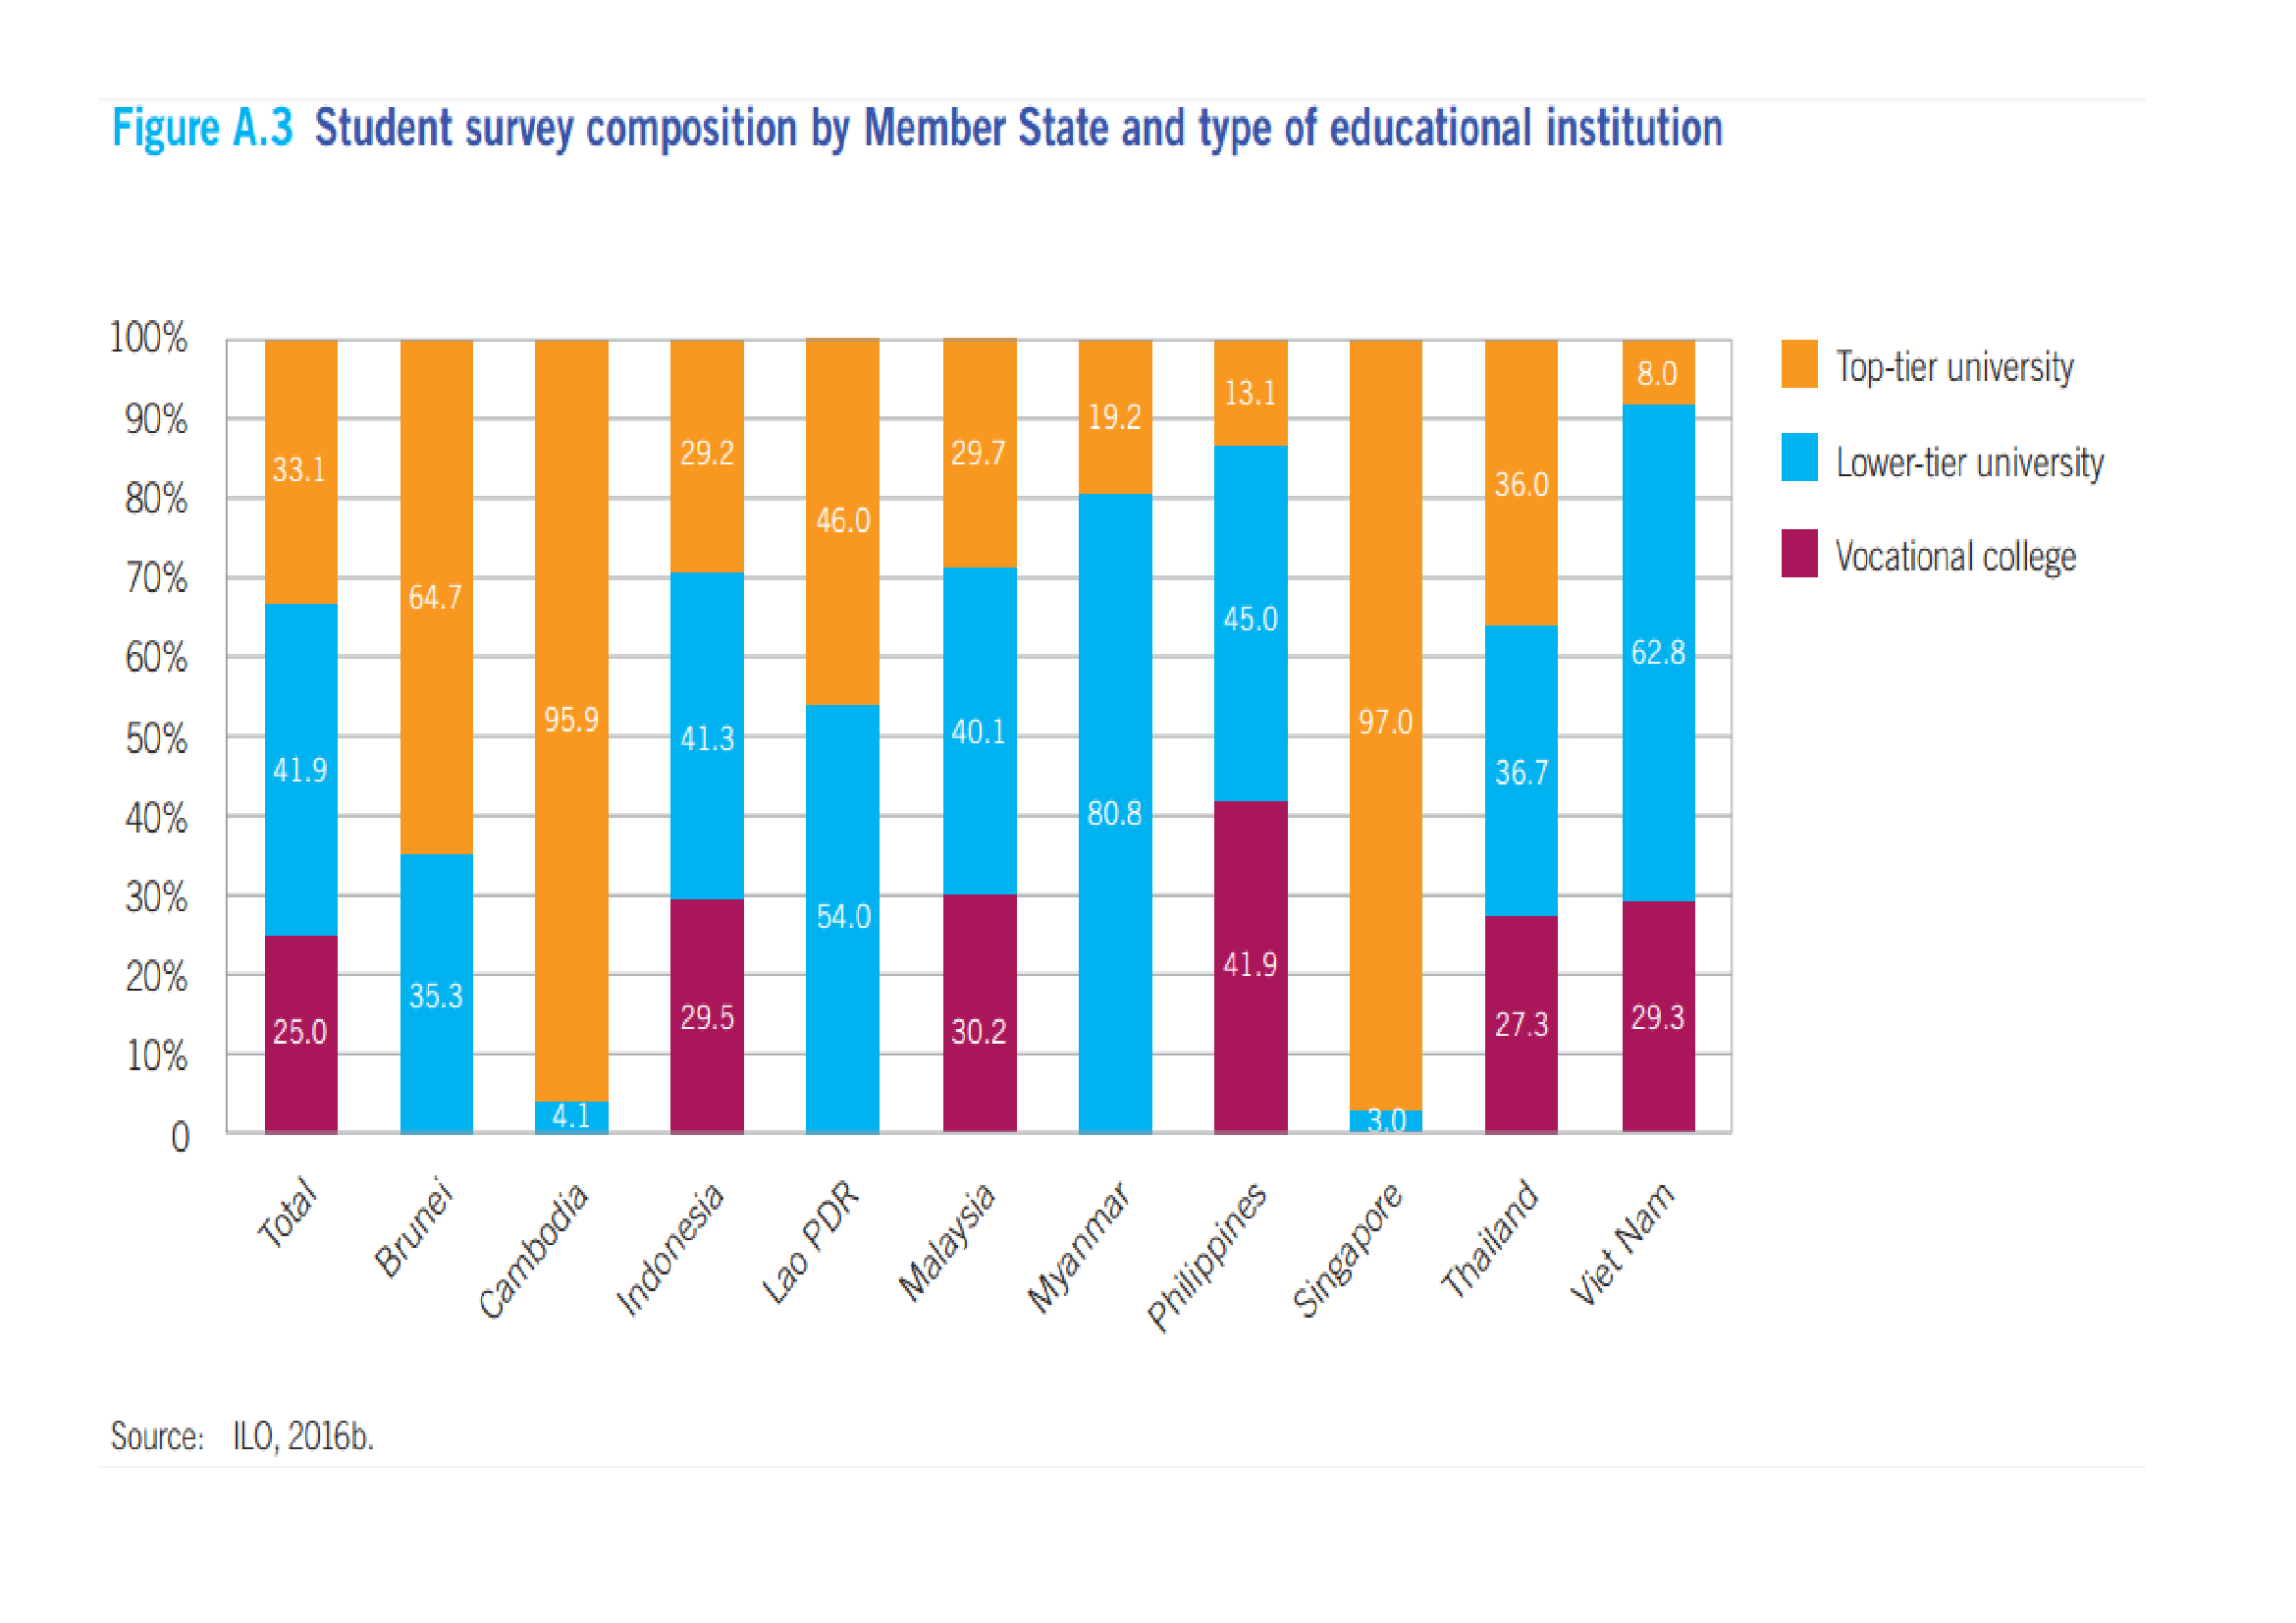
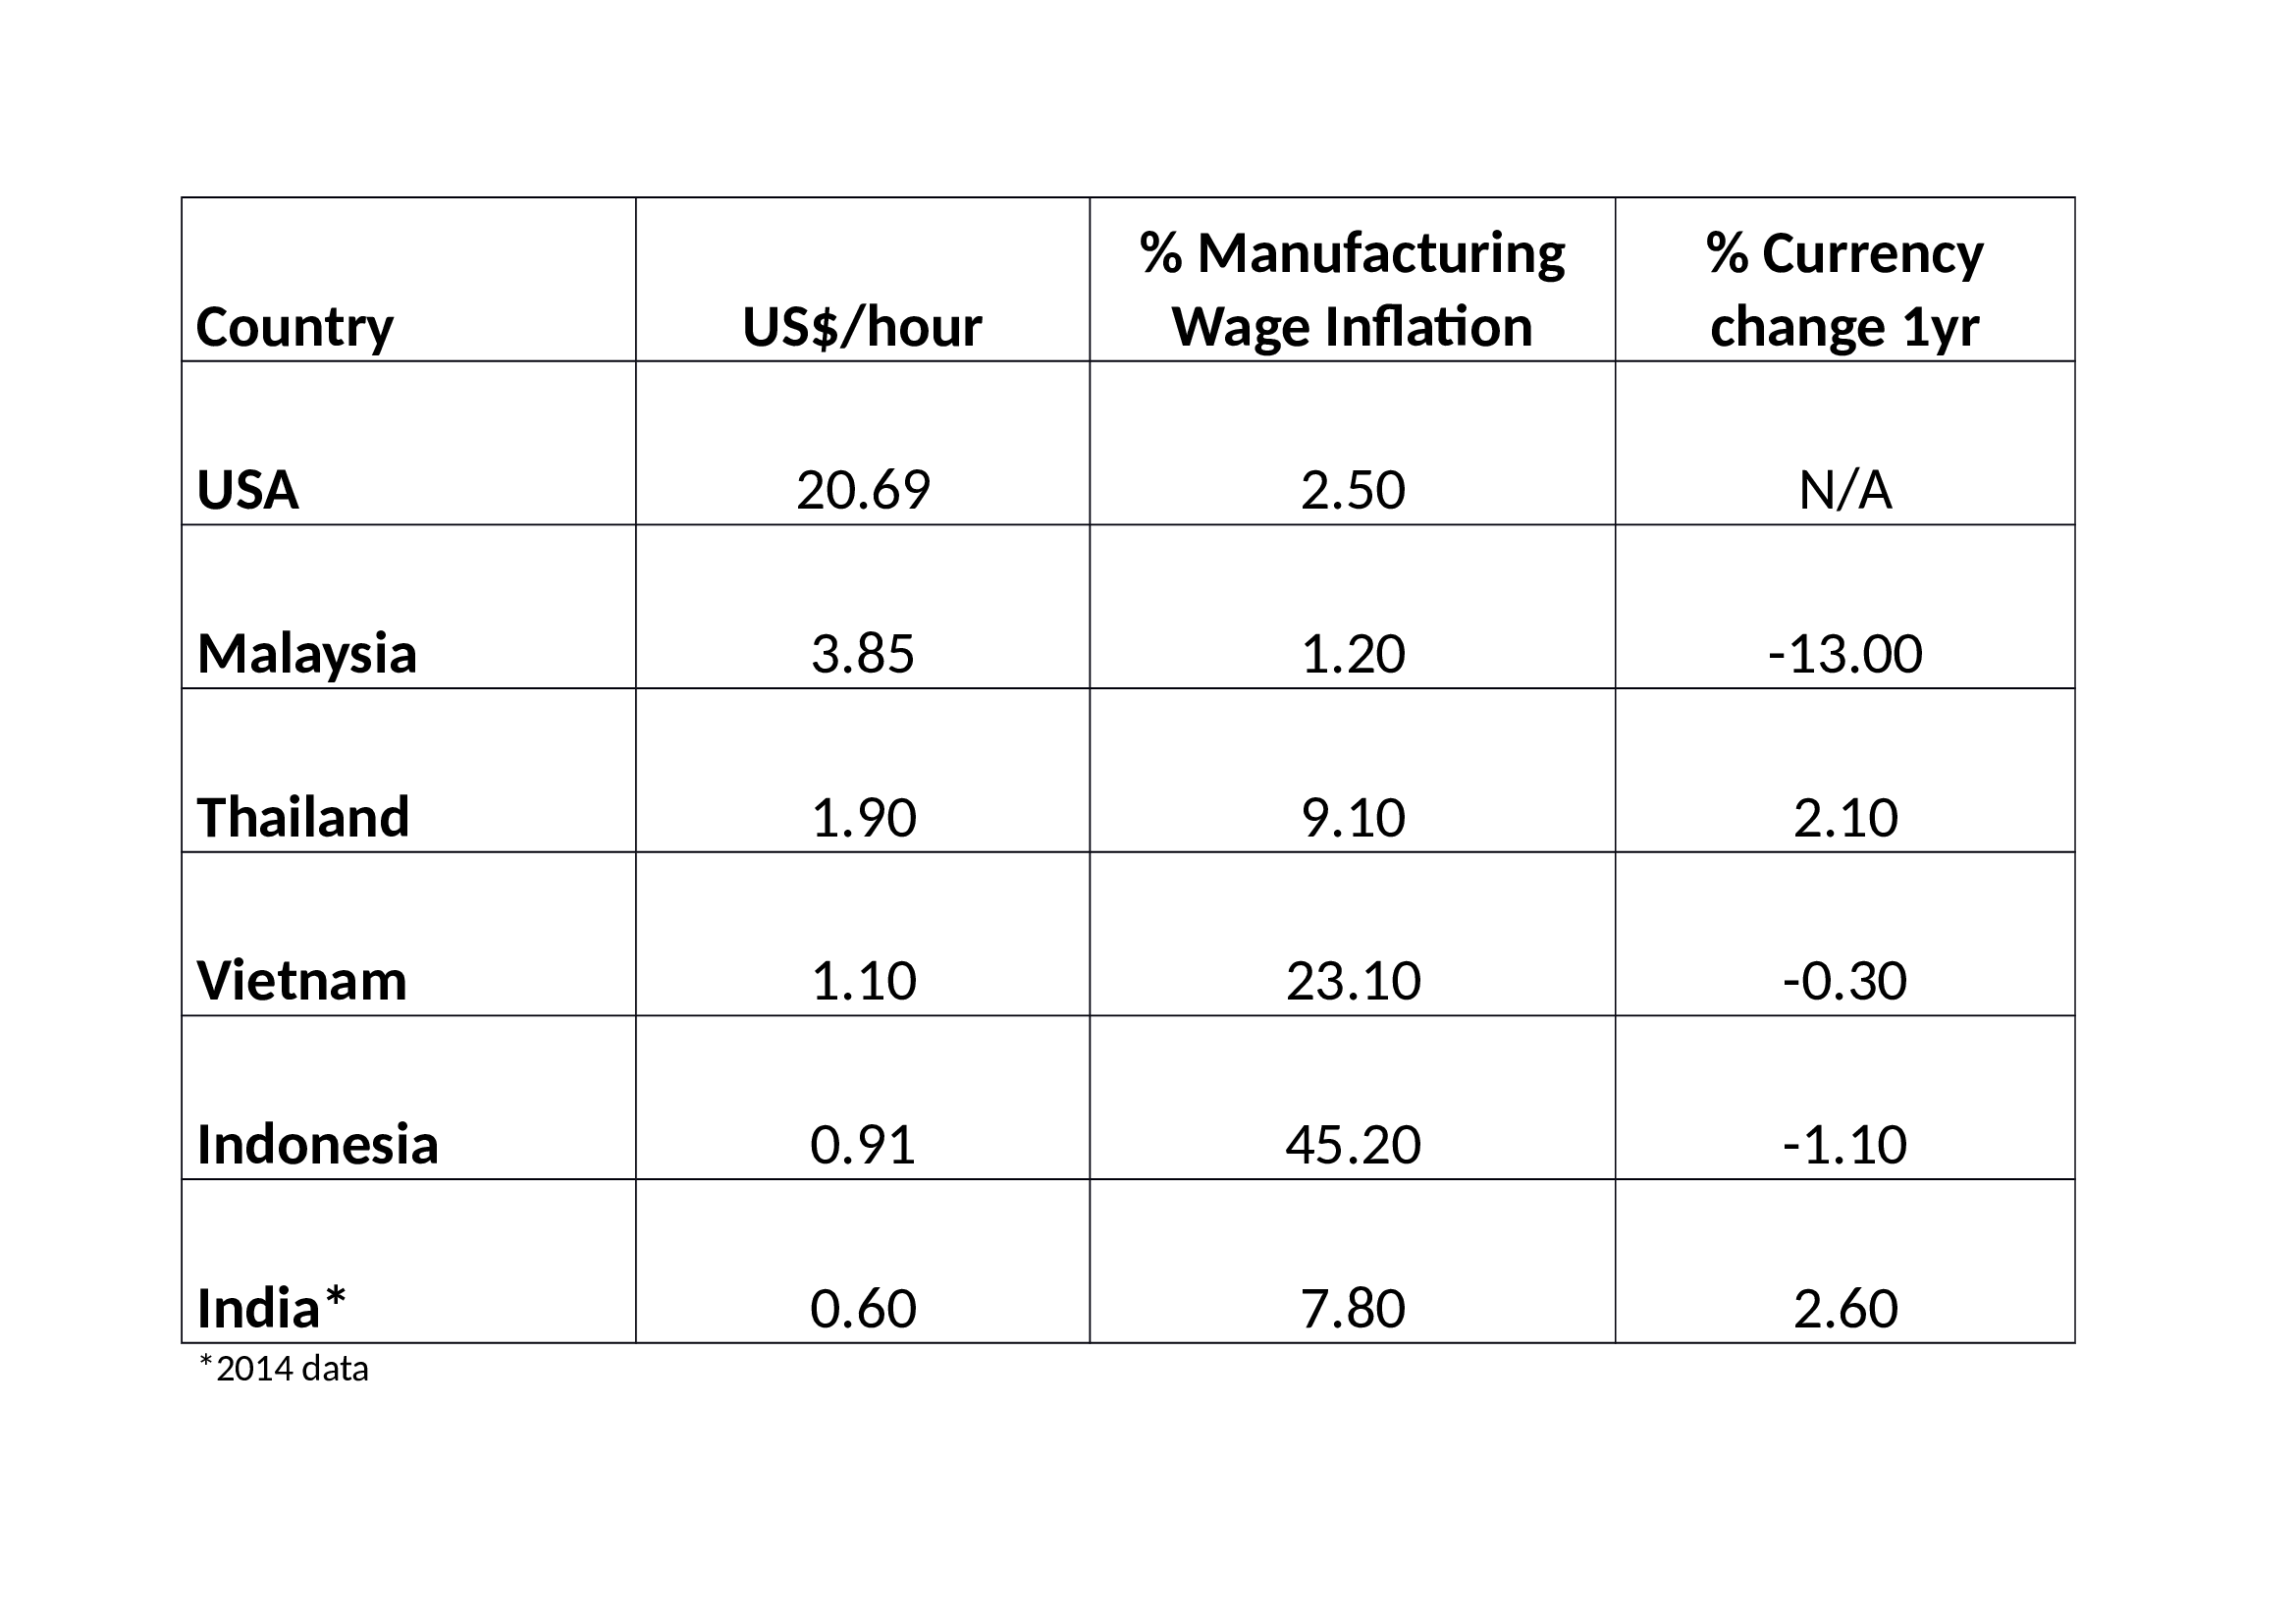
Last year, the McKinsey Global Institute looked at the job security of different occupations in the face of automation in the US. Countries with lower average earnings will be slower to adopt automation but their comparative advantage is likely to be eroded, especially if the worlds’ trade policies grow more protectionist: –
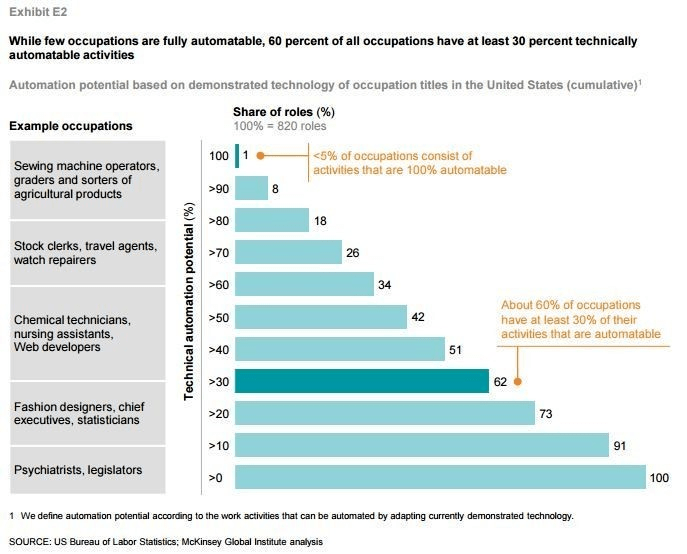
Source: Mckinsey Global Institute
In labour-force terms, most of the roles which can be automated are unskilled. As long as EM and Frontier countries can maintain a comparative advantage in labour input costs, their unemployment rates will remain low. The threat of developed nation automation, however, imposes a ceiling on wages in all countries and developing nations will feel the effect most directly.
Returning to Lord Turner’s article for Project Syndicate – In Praise of Demographic Decline– the author quotes from the UN 2019 population projection which indicates that Asia, Europe and the Americas have almost achieved population stability. The problem of automation on employment prospects is therefore lower in these countries. It is poorer countries whose populations are young and still growing which are most at risk . This is especially true of Africa where the UN projects the population will soar from 1.34bln to 4.28bln by the end of the century.
Turner tentatively suggests there may be a universal rule of human behaviour; that rich, successful societies choose to adopt fertility rates which lead to gradual population decline. He also challenges the concept of the ‘working age’ population (15 to 64 years) questioning why, if longevity is increasing, that upper bound should still apply, going on to surmise: –
…in a world of rapidly expanding automation potential, demographic shrinkage is largely a boon, not a threat. Our expanding ability to automate human work across all sectors – agriculture, industry, and services – makes an ever-growing workforce increasingly irrelevant to improvements in human welfare. Conversely, automation makes it impossible to achieve full employment in countries still facing rapid population growth.
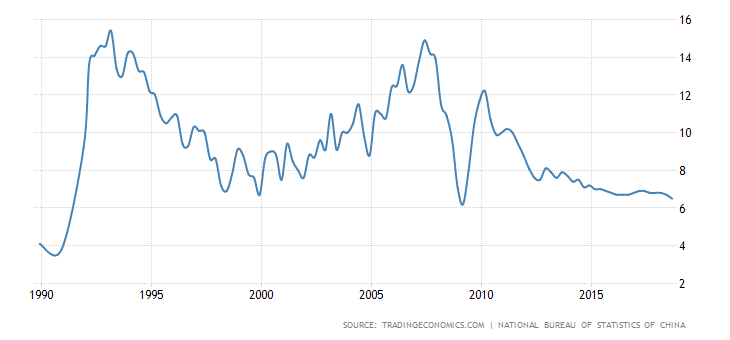
The author compares India, where the population continues to expand, with China, which has been aggressively embracing automation as its population ages and the effect of its ‘one child’ policies has caused its population to plateau – growing old before they grow rich.
If the greatest demographic challenges face countries with rapid population growth, then Africa may find its route to middle income status impeded, especially if developed nation manufacturing can be almost entirely automated.
As Turner concludes: –
Automation has turned conventional economic wisdom on its head: there is greater prosperity in fewer numbers.
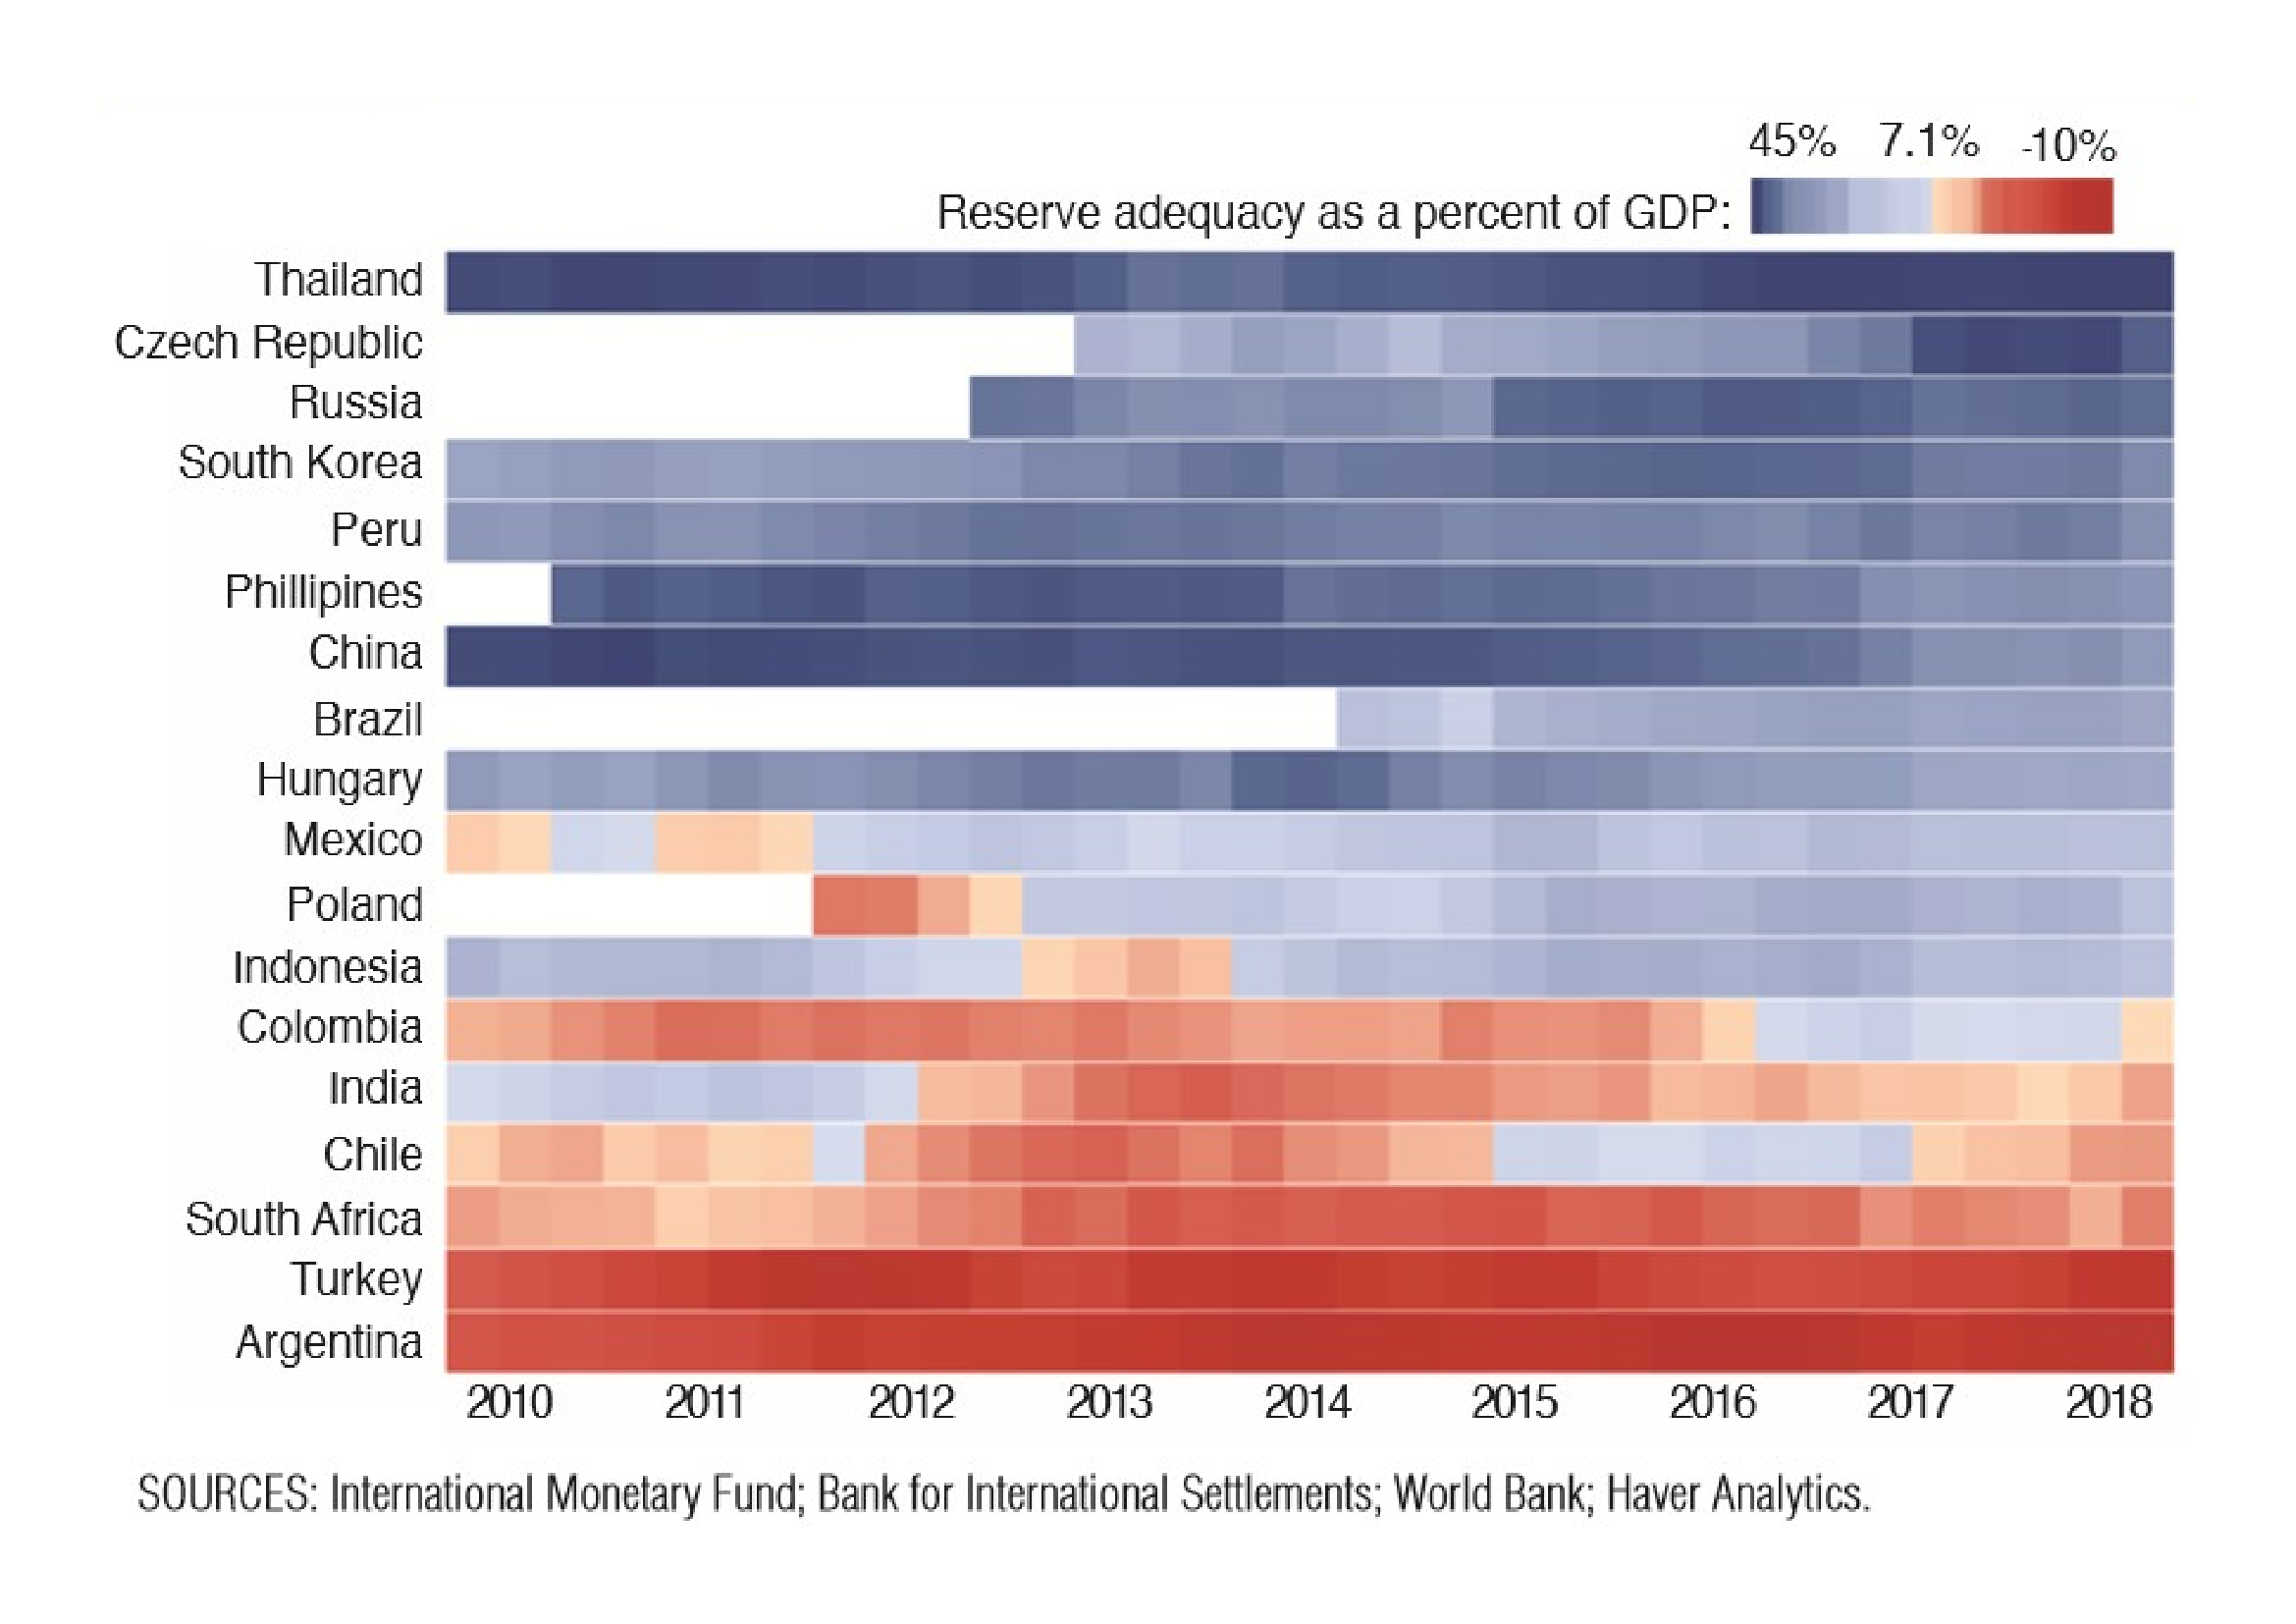
The Covid-19 pandemic has caused other weaknesses of emerging economies to be laid bare. The IMF – How COVID-19 Will Increase Inequality in Emerging Markets and Developing Economies – published earlier this month, observes that, several years prior to the crisis, EM income inequality had begun to rise, along with worryingly high levels youth inactivity. They also note increasing educational inequality and an absence of economic opportunities for woman. All these trends have accelerated during the past nine months, to such an extent that the improvements of the last decade have been swept aside: –
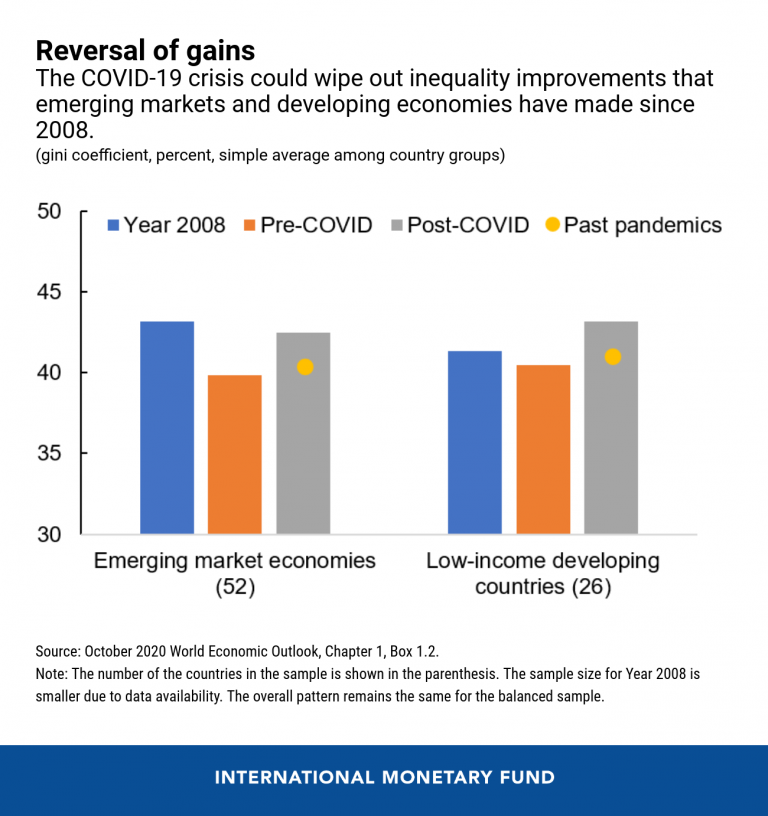
Source: IMF
In their 2nd May briefing on EM bonds, The Economist took up this theme asking – Which emerging markets are in most in peril?The authors listed several EM bond issuers who had defaulted even before the current crisis had begun: –
Argentina has missed a $500m payment on its foreign bonds. If it cannot persuade creditors to swap their securities for less generous ones by May 22nd, it will be in default for the ninth time in its history… Ecuador, which has postponed $800m of bond payments for four months to help it cope with the pandemic; Lebanon, which defaulted on a $1.2bn bond in March; and Venezuela, which owes barrelfuls of cash (and crude oil) to its bondholders, bankers and geopolitical benefactors in China and Russia… Zambia, which is seeking to hire advisers for a “liability-management exercise”, an agreement to pay creditors somewhat less, somewhat later than it promised.
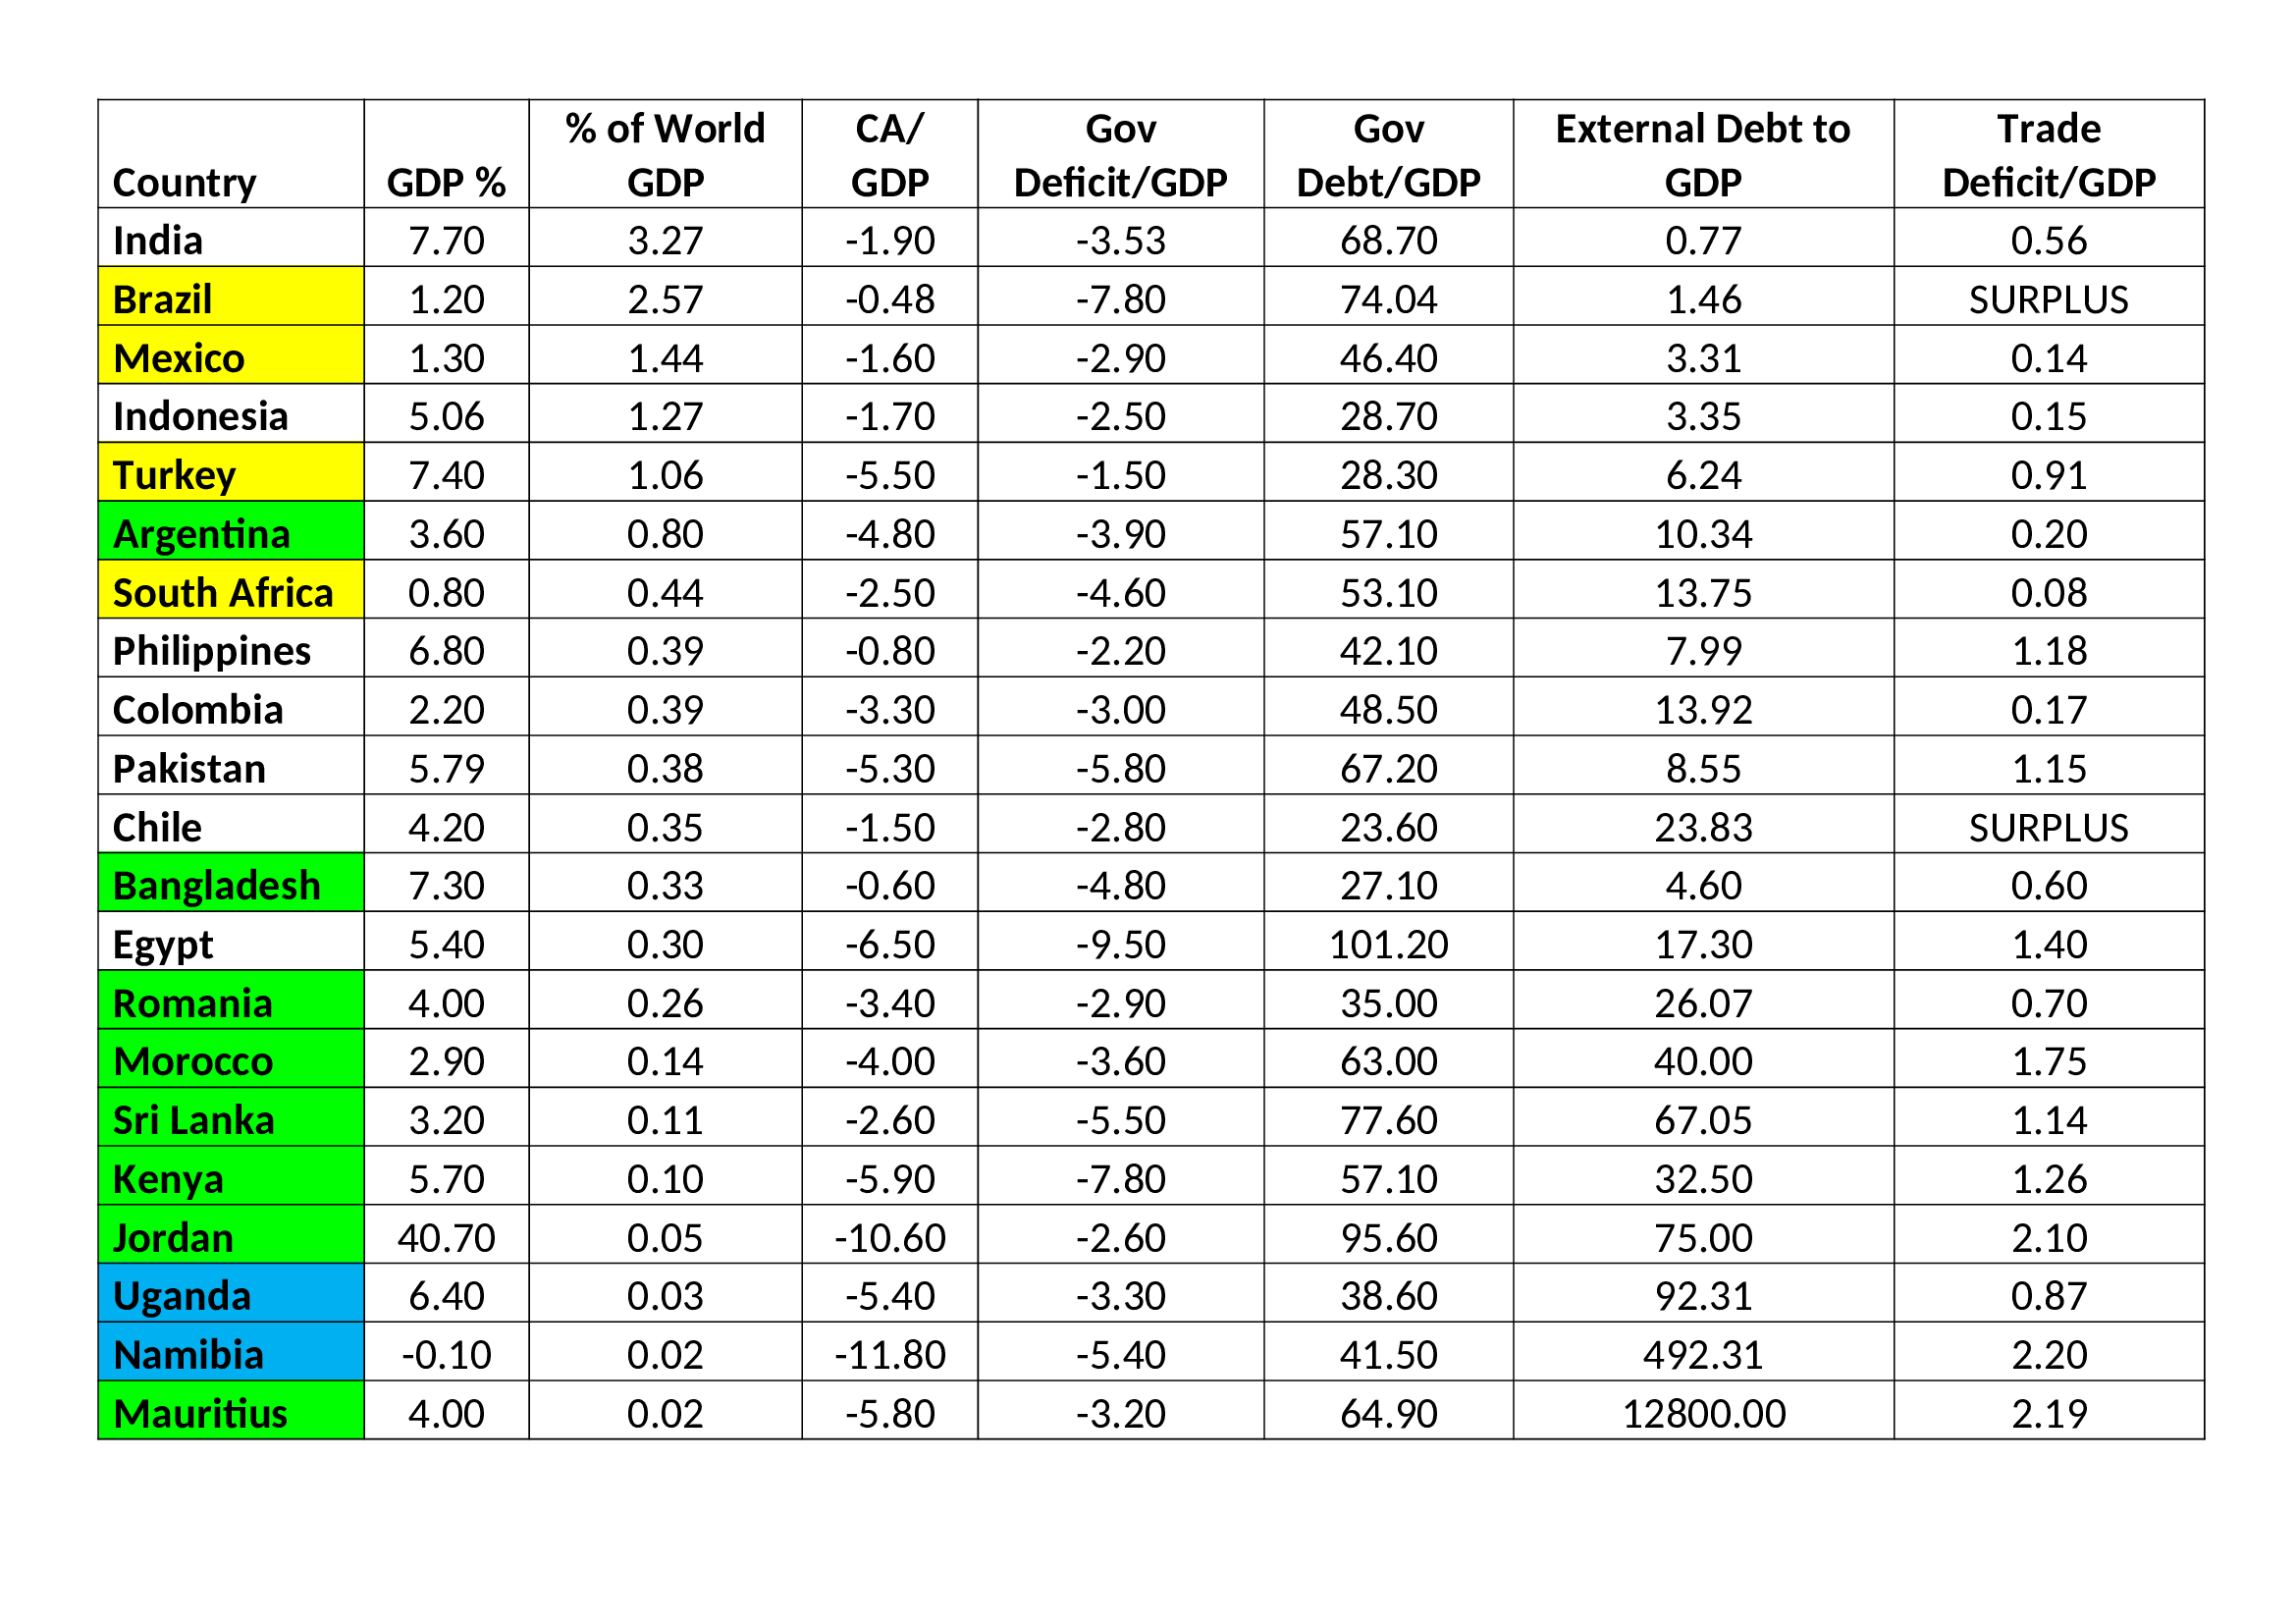
Anticipating trouble ahead they also produced this most informative table: –
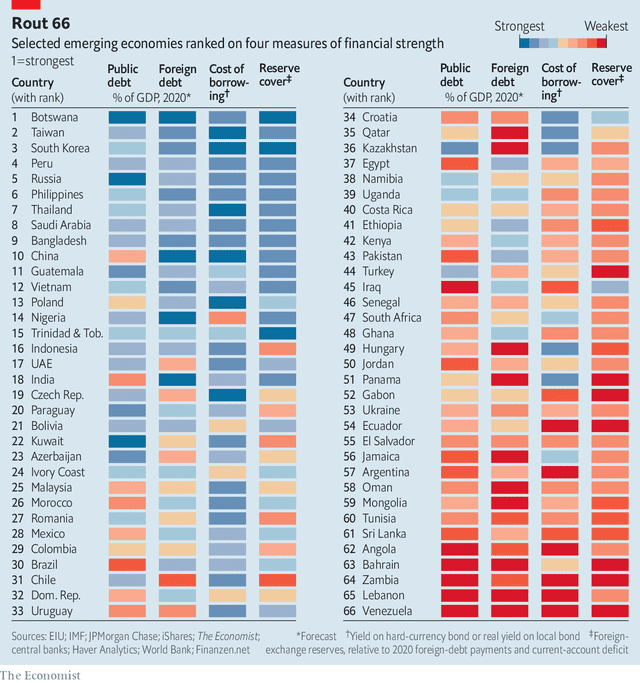
Source: The Economist
The Economist notes that the 66 countries listed need to find $4trln to service their existing debt this year – which drops to $2.9trln once China is excluded. With luck this refinancing will be manageable. Global capital markets have matured and deepened greatly since the Asian crisis of 1997. The table below shows the percentage of local currency bonds issued by various EM borrowers today: –
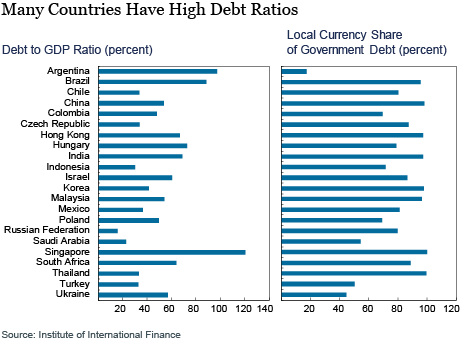
Source: Institute of International Finance
On average 79% of these issuers tapped their local currency markets, rendering them relatively immune to speculative abuse on the foreign exchanges. By contrast, those countries which were obliged to tap the international market, raising capital primarily in US$, were forced to pay a substantial credit premium for the privilege.
The IMF, concerned by the rapidity of the capital flight from EM bond markets at the start of the pandemic, focussed their research on the risks of a sudden stop in credit markets and the policy actions which should be undertaken to avert disaster. The next chart shows the initial divergence and subsequent re-convergence of global government bond markets since Q1: –
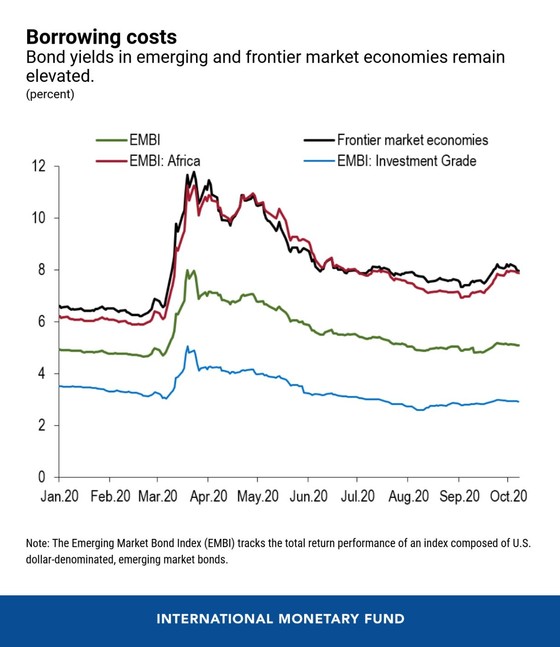
Source: IMF
Surprisingly, international investor exposure to EM bonds has remained fairly static over the last five years, as the chart below reveals: –
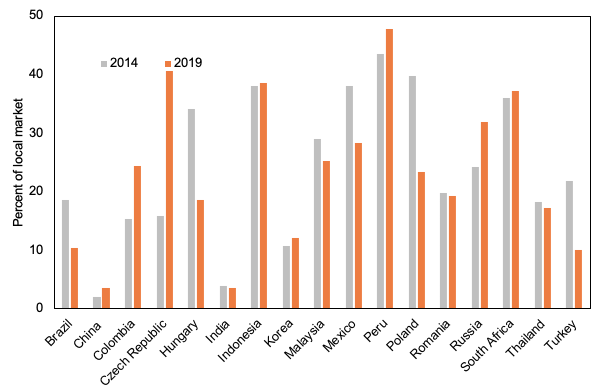
Source: Institute of International Finance
As developed nation central banks have lowered interest rates and increased QE so the quest for yield has risen. Given the attractive yields offered by EM issuers one might have expected a significant increase in international exposure. It seems the risks of EM sovereign default has leant investors some degree of sobriety.
Of course the BIS has been keen to observe the synchronicity between this years’ EM bond rebound and the advent of EM central bank QE. Perhaps this new approach will strengthen the resolve of yield hungry investors: –
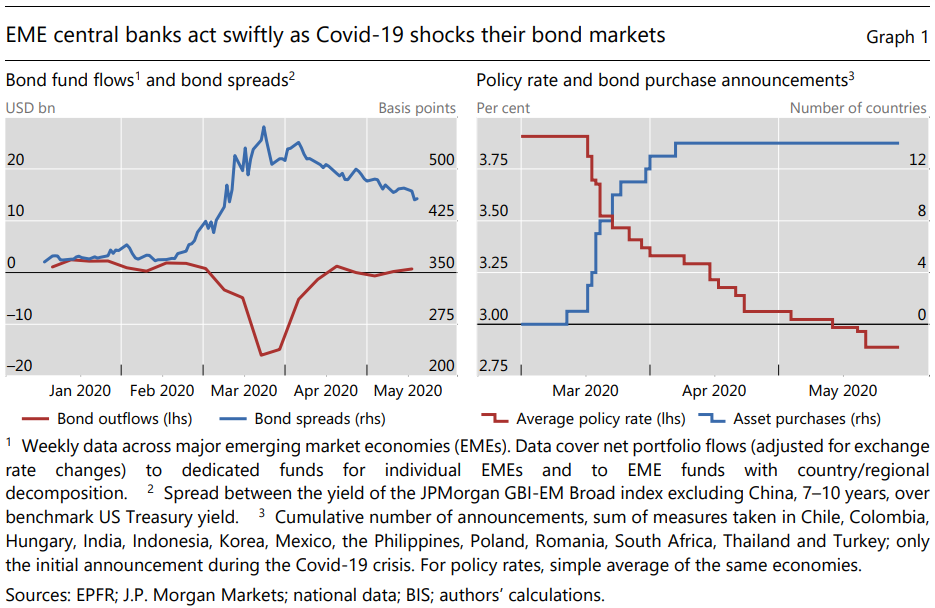
Source: EPFR, JP Morgan, BIS
Conclusions and Investment Opportunities
As a watcher (and trader) of the European government bond markets over more than three decades, I have observed the convergence and divergence of yield spreads between the periphery and the core. When looking beyond the Eurozone, one has to account for currency, as well as interest rate and duration risk. In the past EM bonds lacked of local currency liquidity which meant the credit risk could be taken through a spread between the US$ sovereign issuer and US Treasuries. Today the EM capital markets have matured, nonetheless, local currency bonds need to be hedged against adverse currency movement. Meanwhile, those issuers, forced to raise capital in the US$ markets are likely to be less liquid and, in many cases, less credit worthy.
The new paradigm for EM bond traders is the introduction of EM central bank QE. This is a ‘whatever it takes’ moment for many emerging nations. If they can successfully defend their currencies and their bond markets from speculative capital flight they will foster increased liquidity and with it increased capital raising capacity for the governments. We stand upon the threshold of a brave new world where an EM country, with a flexible exchange rate regime and well-anchored inflation expectations, can suspend disbelief and print its way out of a credit crisis. A recent BIS paper – Inflation at risk in advanced and emerging market economies– found that EM countries success in taming inflation, together with their adoption of inflation targeting frameworks, has greatly reduced upside inflation risks.
For the developed nation central banks, for whom the Bank of Japan has been the leader of innovation, for almost two decades, the efforts of EM central banks to wield QE, will be watched with bated breath. It still remains unclear how far a central bank can expand its balance sheet before the currency market calls it to task. Given that the Bank of Japan has yet to do so, it falls to an EM country will discover those limits. Until then, the widening of EM credit spreads will (selectively) provide an excellent buying opportunity.
In the longer term the demographic dividend of a young population may no longer be the panacea it once was hoped. Technology, and especially the automation of manufacturing means that countries which might have adopted a mercantilist, export driven approach to raise themselves out of poverty will find the road is longer and less rapid. Emerging economies will bifurcate into those that can afford to automate and those that need to support their unskilled youth. This will determine their economic growth trajectory, their government finances and the success of their domestic businesses. For emerging, and particularly Frontier economies, their youth, without education, is no longer unalloyed stuff of economic prosperity.