With a new administration installed in the US and a $1.9trln relief package approved, attention has now turned to how this fiscal largesse will be paid for. I thought this article from September 2020 might add to the debate.


With a new administration installed in the US and a $1.9trln relief package approved, attention has now turned to how this fiscal largesse will be paid for. I thought this article from September 2020 might add to the debate.

![]()
Macro Letter – No 128 – 17-04-2020
A Rose by Any Other Name – Corona Bonds and the Future of the Eurozone
On April 9th the Eurogroup of Finance Ministers eventually agreed upon a three-pronged package to avert some of the economic impact of the Covid-19 pandemic. For financial markets this was a relief, had the Eurogroup broken up, for the second time in a week, without a deal markets would have reacted badly. The three-pronged package included health expenditure funding from the European Stability Mechanism (ESM), loans for businesses from the European Investment Bank (EIB) and further funding from the European Commission’s unemployment fund. The total package is a modest Euro 540bln, the political ramifications are much less so.
What was not agreed, despite the unprecedented circumstances surrounding the pandemic, was a collective pooling of Eurozone (EZ) resources in the form of ‘Eurobonds,’ deftly renamed ‘Corona Bonds,’ by their advocates. For the fiscally responsible countries of Northern Europe, even the current crisis was insufficient for them to contemplate underwriting the prodigal South.
The compromise, agreed last week, included the use the ESM. The ESM itself, together with the outright monetary transactions (OMT) undertaken by the ECB, were forged in the 2010/2012 Eurozone crisis. At that time the convergence of Eurozone government bond yields, which had begun long before the advent of the Euro, was unravelling as investors realised that Europe would not collectively underwrite any individual state’s obligations. The North/South divide became a chasm, with Greek, Portuguese, Italian and Spanish bond yields rising sharply whilst German, Dutch and Finnish yields declined. The potential default of a Eurozone government was only averted by the actions of the then President of the ECB, Mario Draghi, when he stated that the central bank would do, ‘Whatever it takes.’
Once again, a motley deal has been forged, recriminations will follow. Whilst lower government financing costs remain a major attraction of EZ membership for newer members of the EU, the benefit is by no means guaranteed, as this 2017 paper – Eurozone Debt Crisis and Bond Yields Convergence: Evidence from the New EU Countries – by Minoas Koukouritakis, reveals: –
Based on the empirical results, there is some clear evidence of strong monetary policy convergence for each of the Czech Republic, Lithuania and Slovakia to Germany. Alternatively, under the UIP and ex-ante relative PPP conditions, the expected inflation rate of these three countries has converged to the expected inflation rate of Germany. This is an expected result not only because Lithuania and Slovakia are already Eurozone members, but also because Germany plays a very important role in the economies of these three countries. Furthermore, the empirical results provide evidence of weak monetary policy convergence for each of Croatia and Romania to Germany. In contrast, for the remaining seven new EU countries, namely Bulgaria, Cyprus, Hungary, Latvia, Malta, Poland and Slovenia, the empirical evidence suggests yields’ divergence for each of these countries in relation to Germany. For Cyprus, Latvia and Slovenia, which as Eurozone members they have common monetary policy with Germany, the empirical evidence could probably be attributed to the increased sovereign default risk of these countries, which in turn led to large and persistent risk premia.
In summary, the empirical evidence indicates that in the context of the Eurozone debt crisis, even though Germany has established its dominance and sets the macroeconomic policies in the Eurozone, several new EU countries are unable to follow these policies. And this conclusion addresses once more the issue of core-periphery in the Eurozone and, thus, the Eurozone’s future prospects.
The past six weeks has seen a global fiscal response to the pandemic. Stock markets have declined and credit spreads in corporate bond markets have widened. In European government bonds the pattern has been similar, the migratory flight to quality saw flocks of investors head north, especially into Switzerland and Germany. The simplified chart below shows three data points;
March 9th, when German Bund yields reached their recent nadir,
March 18th, the date investors became spooked by the sheer magnitude of the fiscal response required by EZ governments: and
April 14th, the day on which Italy and Spain announced the first relaxation their lockdown restrictions: –
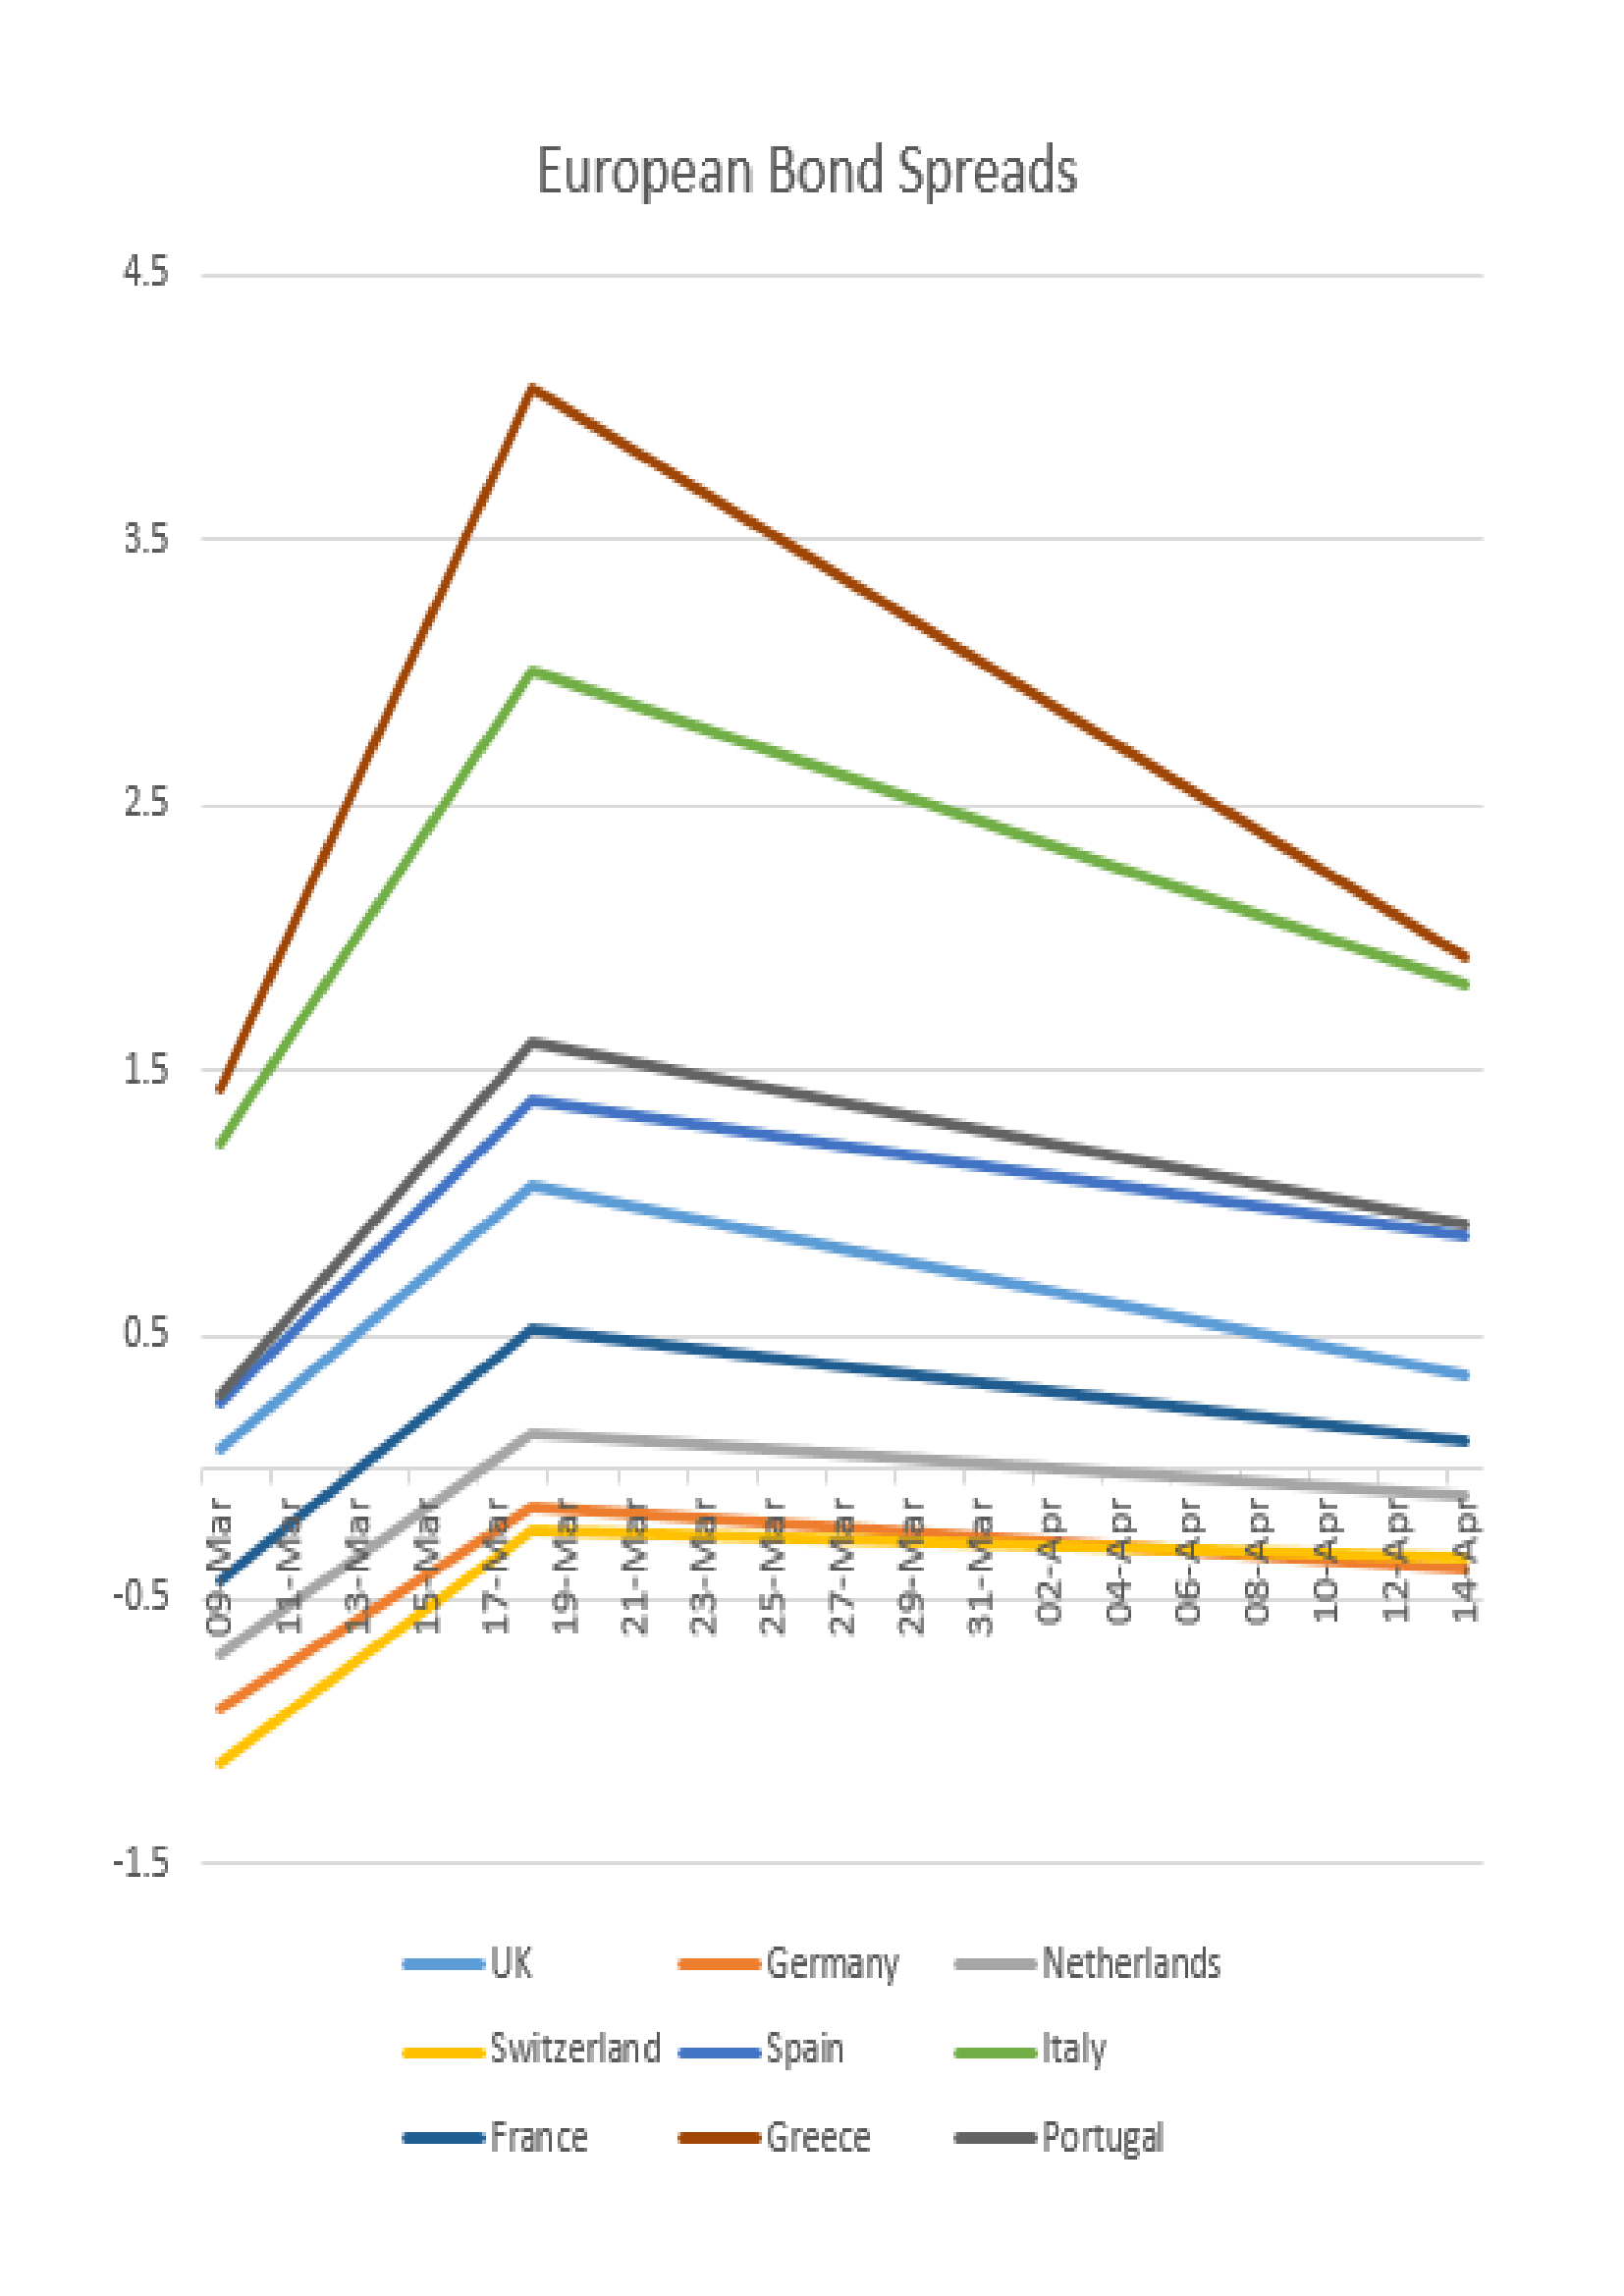
Source: Trading Economics, Investing.com
There are several observations; firstly, even as the lockdown comes towards its end, bond yields are higher, reflecting concerns about the impact of fiscal spending on government budgets as tax receipts collapse. Secondly, German Bund yields are now lower than Swiss Confederation bonds, despite expectations that Germany may end up footing the bill for the lion’s share of government borrowing across the EZ. This may be a reflection of the lower percentage fatality rate in Germany – 2.5% versus 4.4% in Switzerland – or simply a function of the greater liquidity available in the German bond market.
A third observation concerns the higher yielding countries of Greece, Italy, Portugal and Spain. Despite a larger number of Covid-19 infections, Spanish Bonos have maintained their lower yield relative to Italian BTPs, meanwhile, Greek bonds have converged towards Italy and Portuguese bonds trade within 4bp of Spain.
Convergence, divergence and political will
This is not the first macro letter on the topic of EZ bond convergence, the chart below is taken from Macro Letter – No 10 – 25-04-2014 – The Limits Of Convergence – Eurozone Bond Yield Compression Cracks the second of eight previous articles on subject: –
Source: Bloomberg
At that time I suggested three scenarios: –
The EZ crisis had finally disapated but the full impact of QE had not yet been appreciated, the table below shows the yield to maturity and spread over German Bunds of the 10 year bonds of Italy, Spain, Greece and Portugal traded on 24th April 2014 (roughly six years ago): –
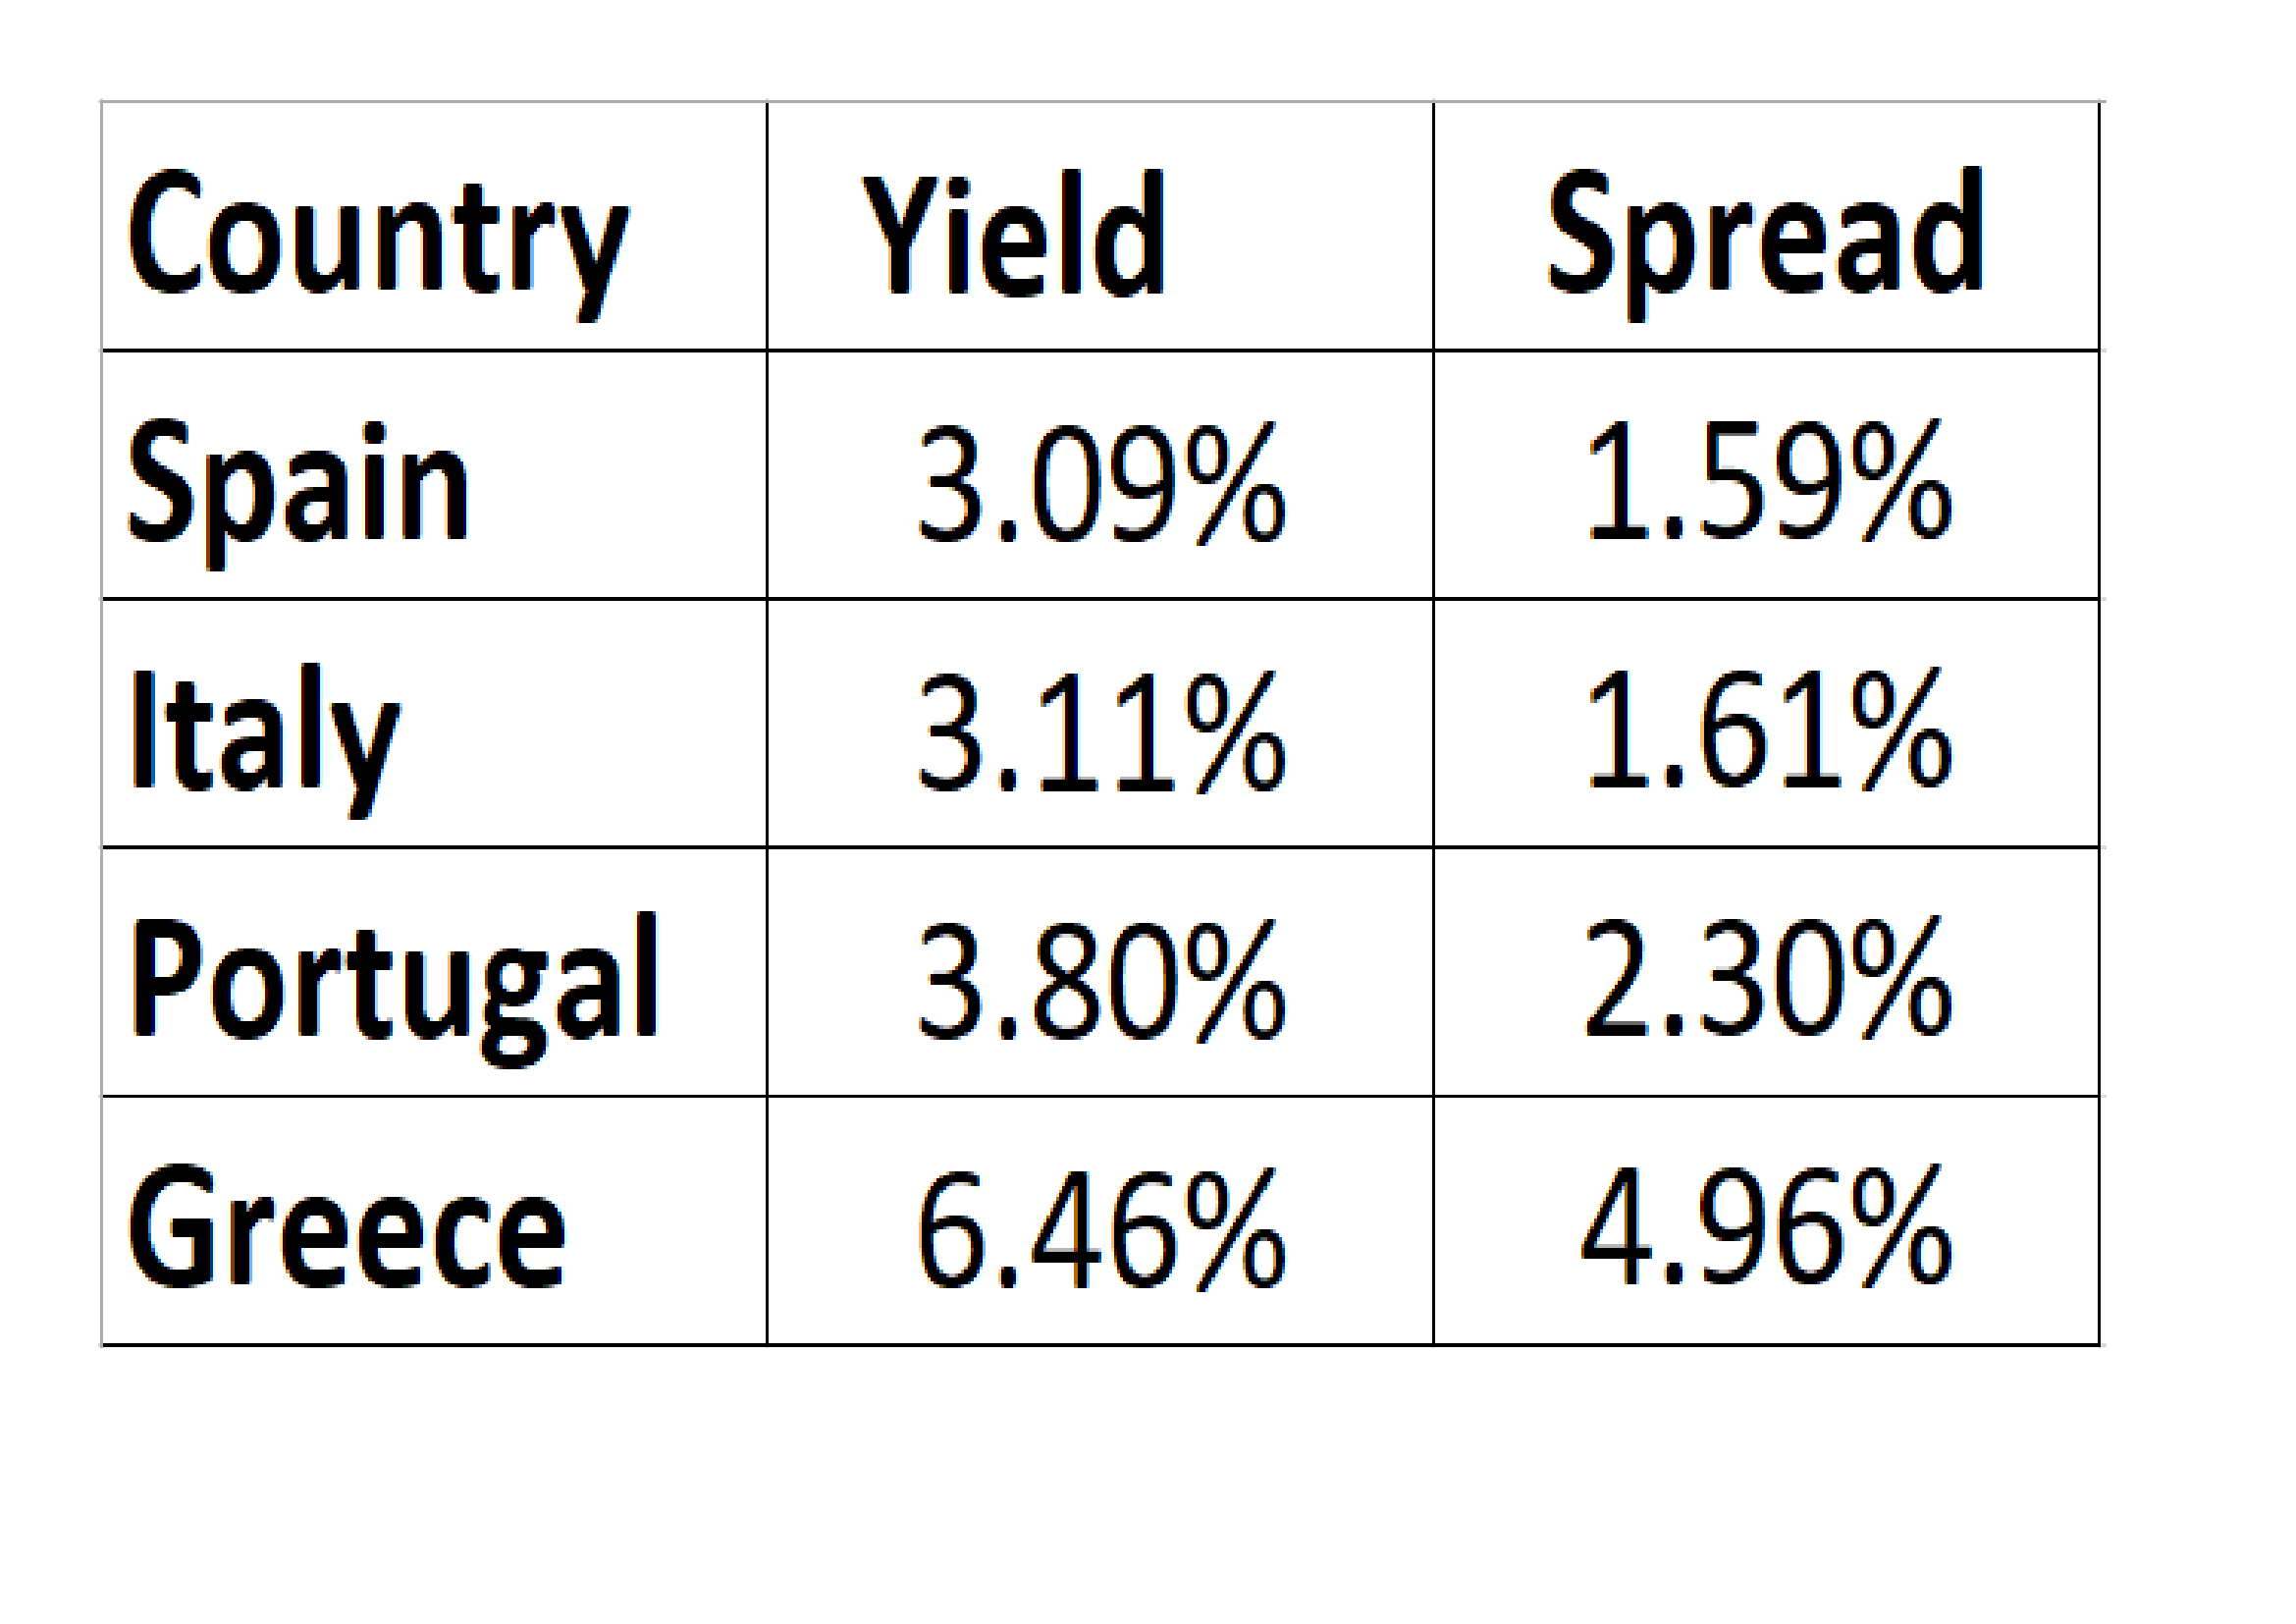
Source: Bloomberg
In April 2014 I saw the second scenario as most likely. I anticipated limited ‘Eurobond’ issuance, this has not yet come to pass, but last week’s stimulus looks like a federal bail-out by any other name. Last month, as the Covid-19 pandemic took hold, the spread between German Bunds and Spanish Bonos touched 1.54%, whilst the spread against Greek bonds reached 4.22% and Portugal, 1.75%. Only Italy fared less well, the Bund/BTP spread reached 3.15; a marked deterioration since 2014.
Conclusions and Investment Opportunities
By the time I penned Macro Letter – No 73 – 24-03-2017 – Can a multi-speed European Union evolve? it was becoming clear that Italy was the focus of concern among fixed income investors. I concluded (a little too late) that: –
Spanish 10yr Bonos represents a better prospect than Italian 10yr BTPs, but one would have to endure negative carry to set up this spread trade: look for opportunities if the spread narrows towards zero.
The spread never returned to parity.
When I last wrote about EZ bonds, I focussed once again on Italy in Macro Letter – No 98 – 08-06-2018 – Italy and the repricing of European government debt. BTP yields had risen to a spread of 1.22% over Spanish Bonos and I expected a retracement. As the chart below reveals, BTP yields rose further before than regained composure: –
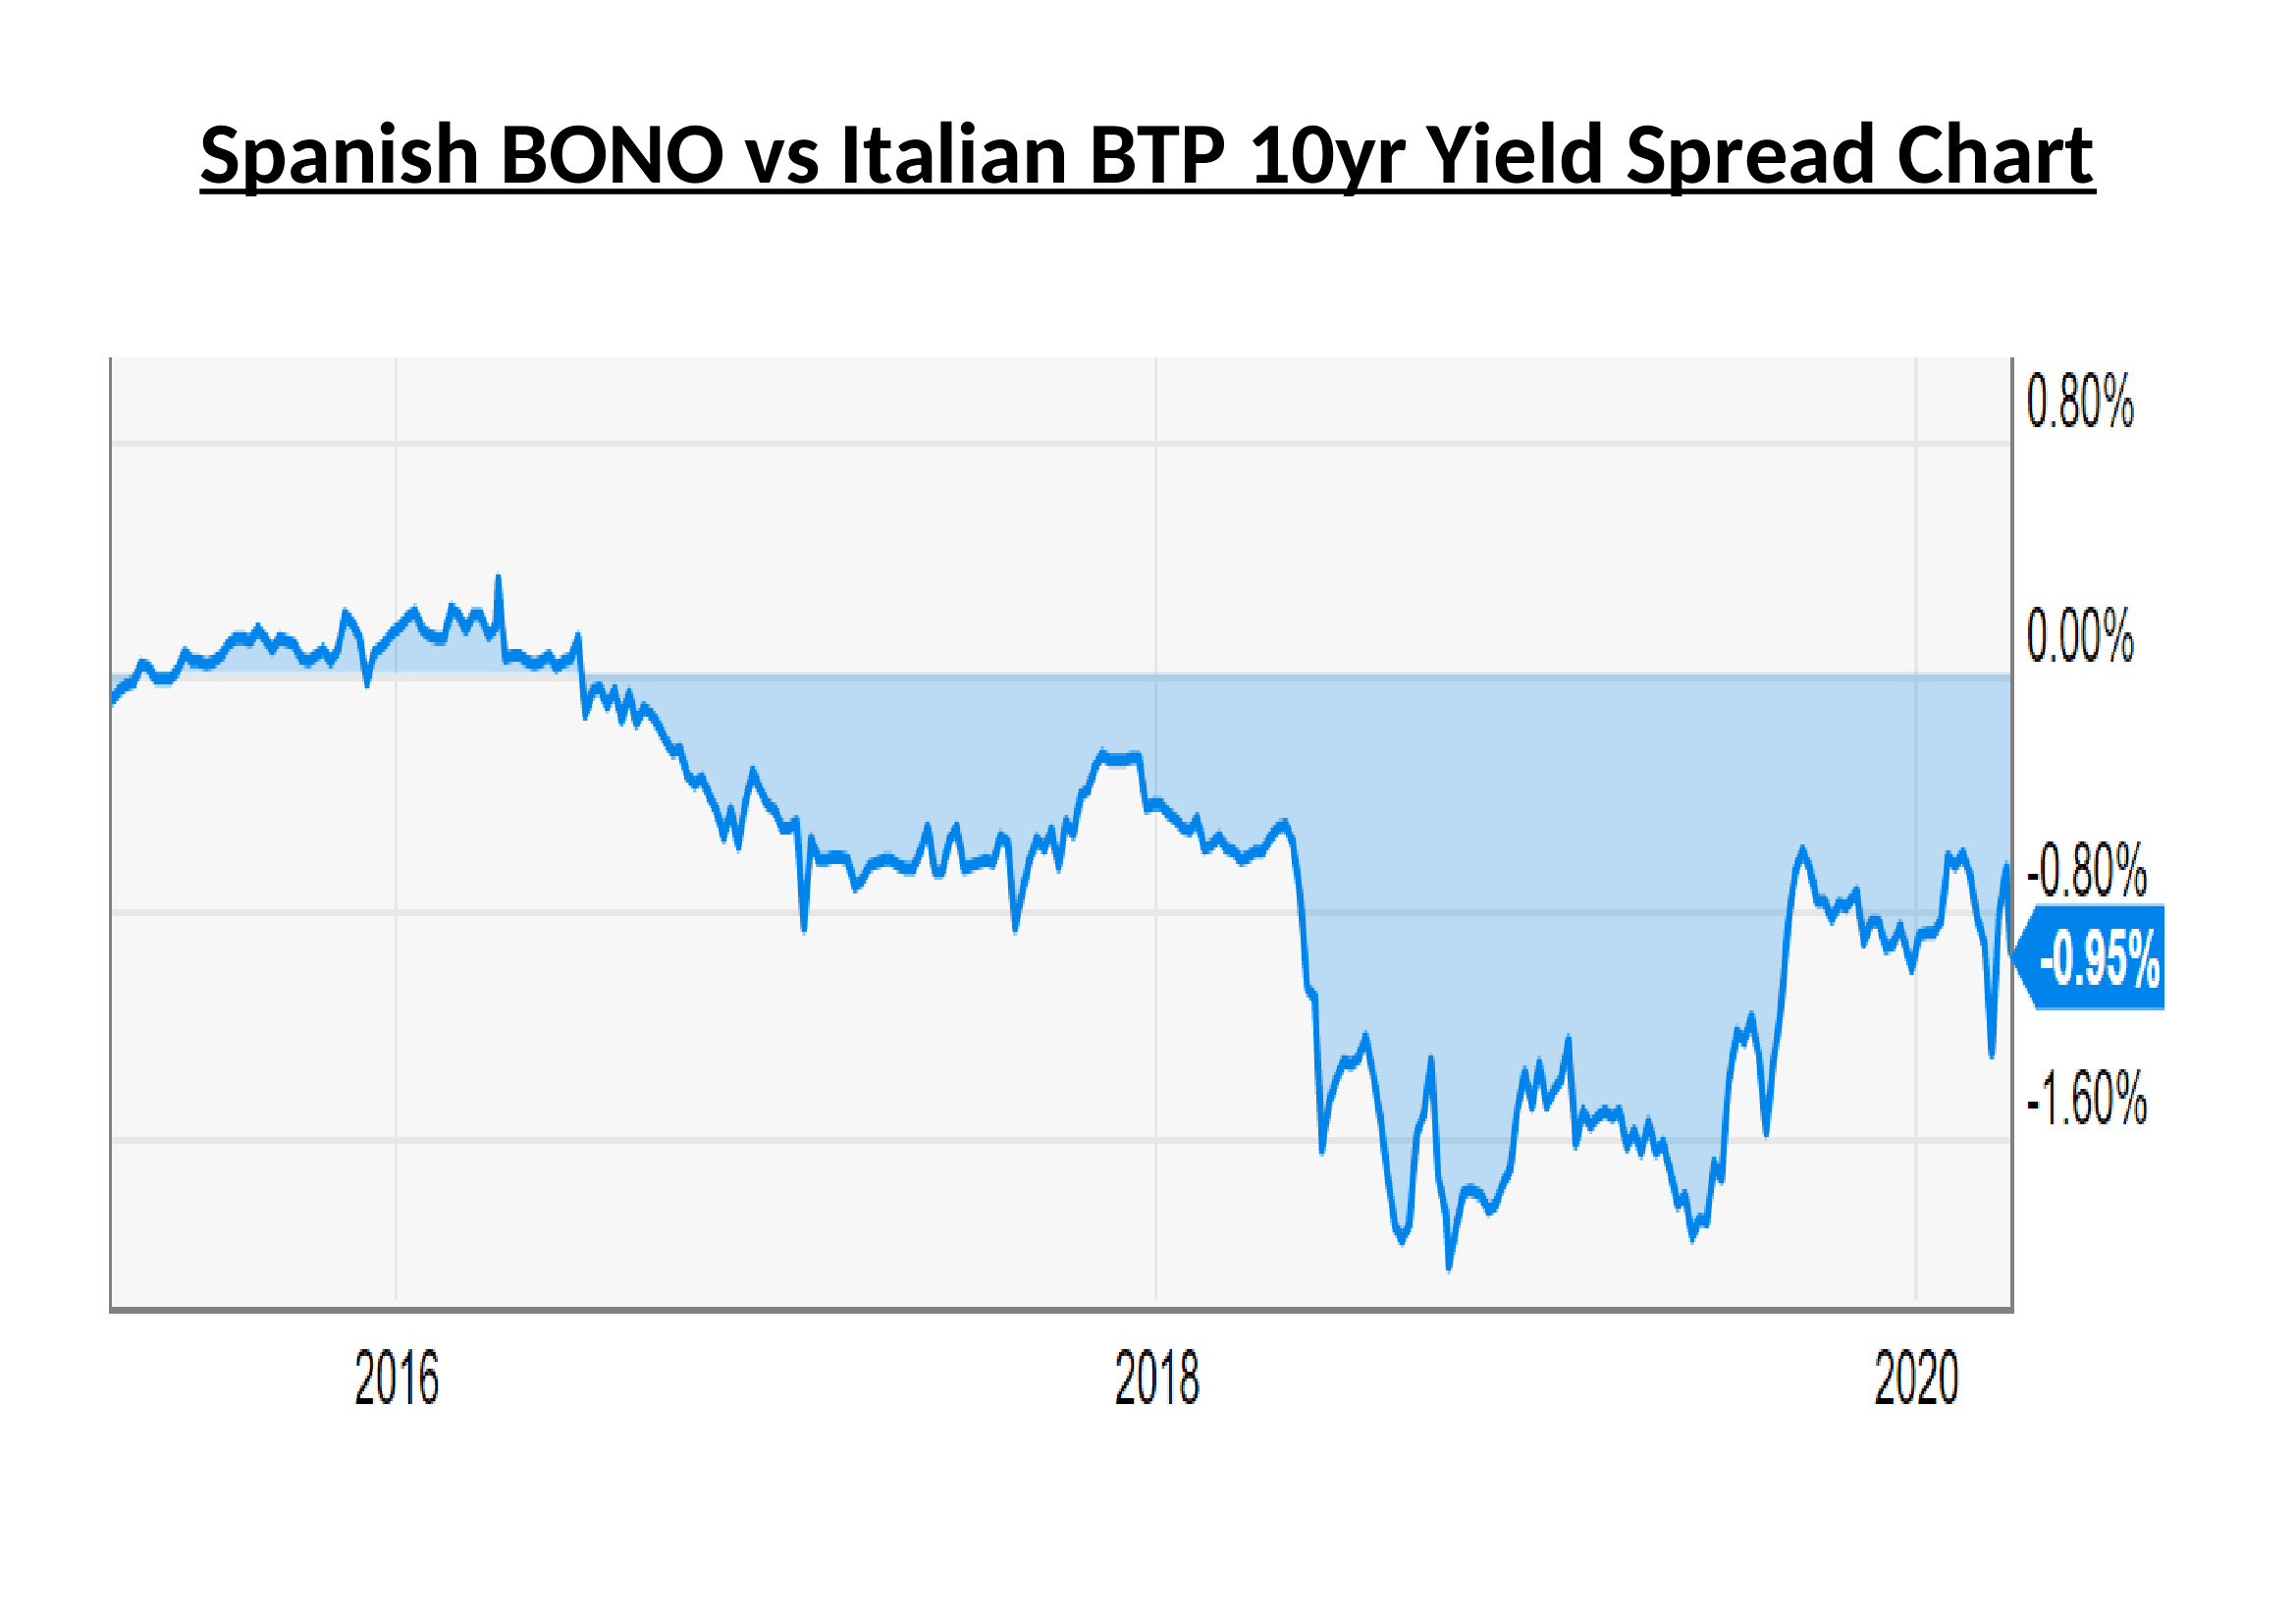
Source: Y-Charts
Eurobonds are still not on the agenda even in a time of pandemic, therefore, Italian indebtedness remains the single greatest risk to the stability of the EZ. The convergence trade is fraught with geopolitical risk as cracks in the European Project are patched and papered over. Now is not the time for revolution, but the ongoing fiscal strain of the pandemic means the policy of issuing Eurobonds backed by a European guarantor will not go away. I expect EZ government bond yield compression accompanied by occasional violent reversals to become the pattern during the next few years, together with increasing political tension between European countries north and south.

![]()
Macro Letter – No 118 – 12-06-2019
Low yield, no yield, negative yield – Buy now but don’t forget to sell
To many onlookers, since the great financial crisis, the world of fixed income securities has become an alien landscape. Yields on government bonds have fallen steadily across all developed markets. As the chart below reveals, there is now a record US$13trln+ of negative yielding fixed income paper, most of it issued by the governments’ of Switzerland, Japan and the Eurozone: –
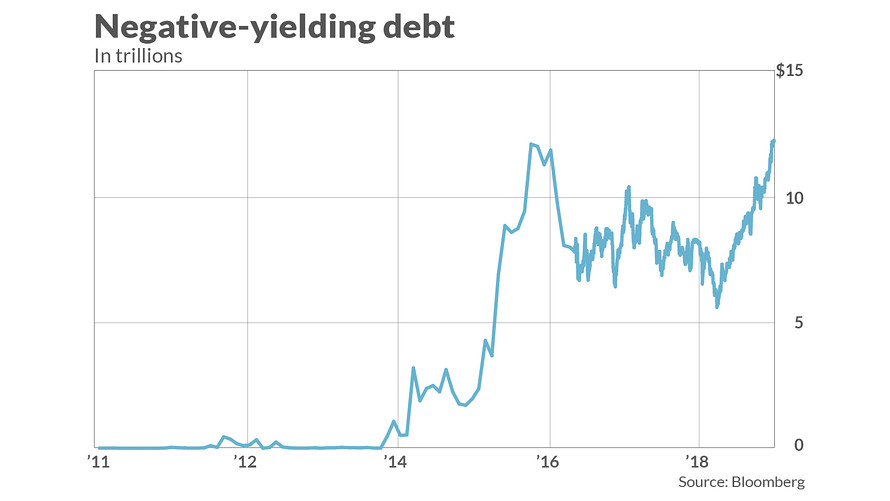
Source: Bloomberg
The percentage of Eurozone government bonds with negative yields is now well above 50% (Eur4.3trln) and more than 35% trades with yields which are more negative than the ECB deposit rate (-0,40%). If one adds in investment grade corporates the total amount of negative yielding bonds rises to Eur5.3trln. Earlier this month, German 10yr Bund yields dipped below the deposit rate for the first time, amid expectations that the ECB will cut rates by another 10 basis points, perhaps as early as September.
The idea that one should make a long-term investment in an asset which will, cumulatively, return less at the end of the investment period, seems nonsensical, except in a deflationary environment. With most central banks committed to an inflation target of around 2%, the Chinese proverb, ‘we live in interesting times,’ springs to mind, yet, negative yielding government bonds are now ‘normal times’ whilst, to the normal fixed income investor, they are anything but interesting. As Keynes famously observed, ‘Markets can remain irrational longer than I can remain solvent.’ Do not fight this trend, yields will probably turn more negative, especially if the ECB cuts rates and a global recession arrives regardless.
Today, government and investment grade corporate debt has been joined by a baker’s dozen of short-dated high yield Euro names. This article from IFR – ‘High-yield’ bonds turn negative – explains: –
About 2% of the euro high-yield universe is now negative yielding, according to Bank of America Merrill Lynch.
That percentage would rise to 10% if average yields fall by a further 35bp, said Barnaby Martin, European credit strategist at the bank.
He said the first signs of negative yielding high-yield bonds emerged about two weeks ago in the wake of Mario Draghi’s speech in Sintra where the ECB president hinted at a further dose of bond buying via the central bank’s corporate sector purchase programme. There are now more than 10 high-yield bonds in negative territory…
The move to negative yields for European high-yield credits is unprecedented; it didn’t even happen in 2016 when the ECB began its bond buying programme.
During Q4, 2018, credit spreads widened (and stock markets declined) amid expectations of further Federal Reserve tightening and an end to ECB QE. Now, stoked by fears of a global recession, rate expectation have reversed. The Fed are likely to ease, perhaps as early as this month. The ECB, under their new broom, Christine Lagarde, is expected to embrace further QE. The corporate sector purchase program (CSPP) which commenced in June 2016, already holds Eur177.8bln of corporate bonds, but increased corporate purchases seem likely; it is estimated that the ECB holds between 25% and 30% of the outstanding Eurozone government bond in issue, near to its self-imposed ceiling of 33%. Whilst the amount in issues is less, the central bank has more flexibility with Supranational and Euro denominated non-EZ Sovereigns (50%) and greater still with corporates (70%). In this benign interest rate environment, a continued compression of credit spreads is to be expected.
Yield compression has been evident in Eurozone government bonds for decades, but now a change in relationship is starting become evident. Even if the ECB does not increase the range of corporate bonds it purchases, its influence, like the rising tide, will float all ships. Bund yields are likely to remain most negative and the government obligations of Greece, the least, but, somewhere between these two poles, corporate bonds will begin to assume the mantle of the ‘nearly risk-free.’ With many Euro denominated high-yield issues trading below the yield offered for comparable maturity Italian BTPs, certain high-yield corporate credit is a de facto alternative to poorer quality government paper.
The chart below is a snap-shot of the 3m to 3yr Eurozone yield curve. The solid blue line shows the yield of AAA rated bonds, the dotted line, an average of all bonds: –
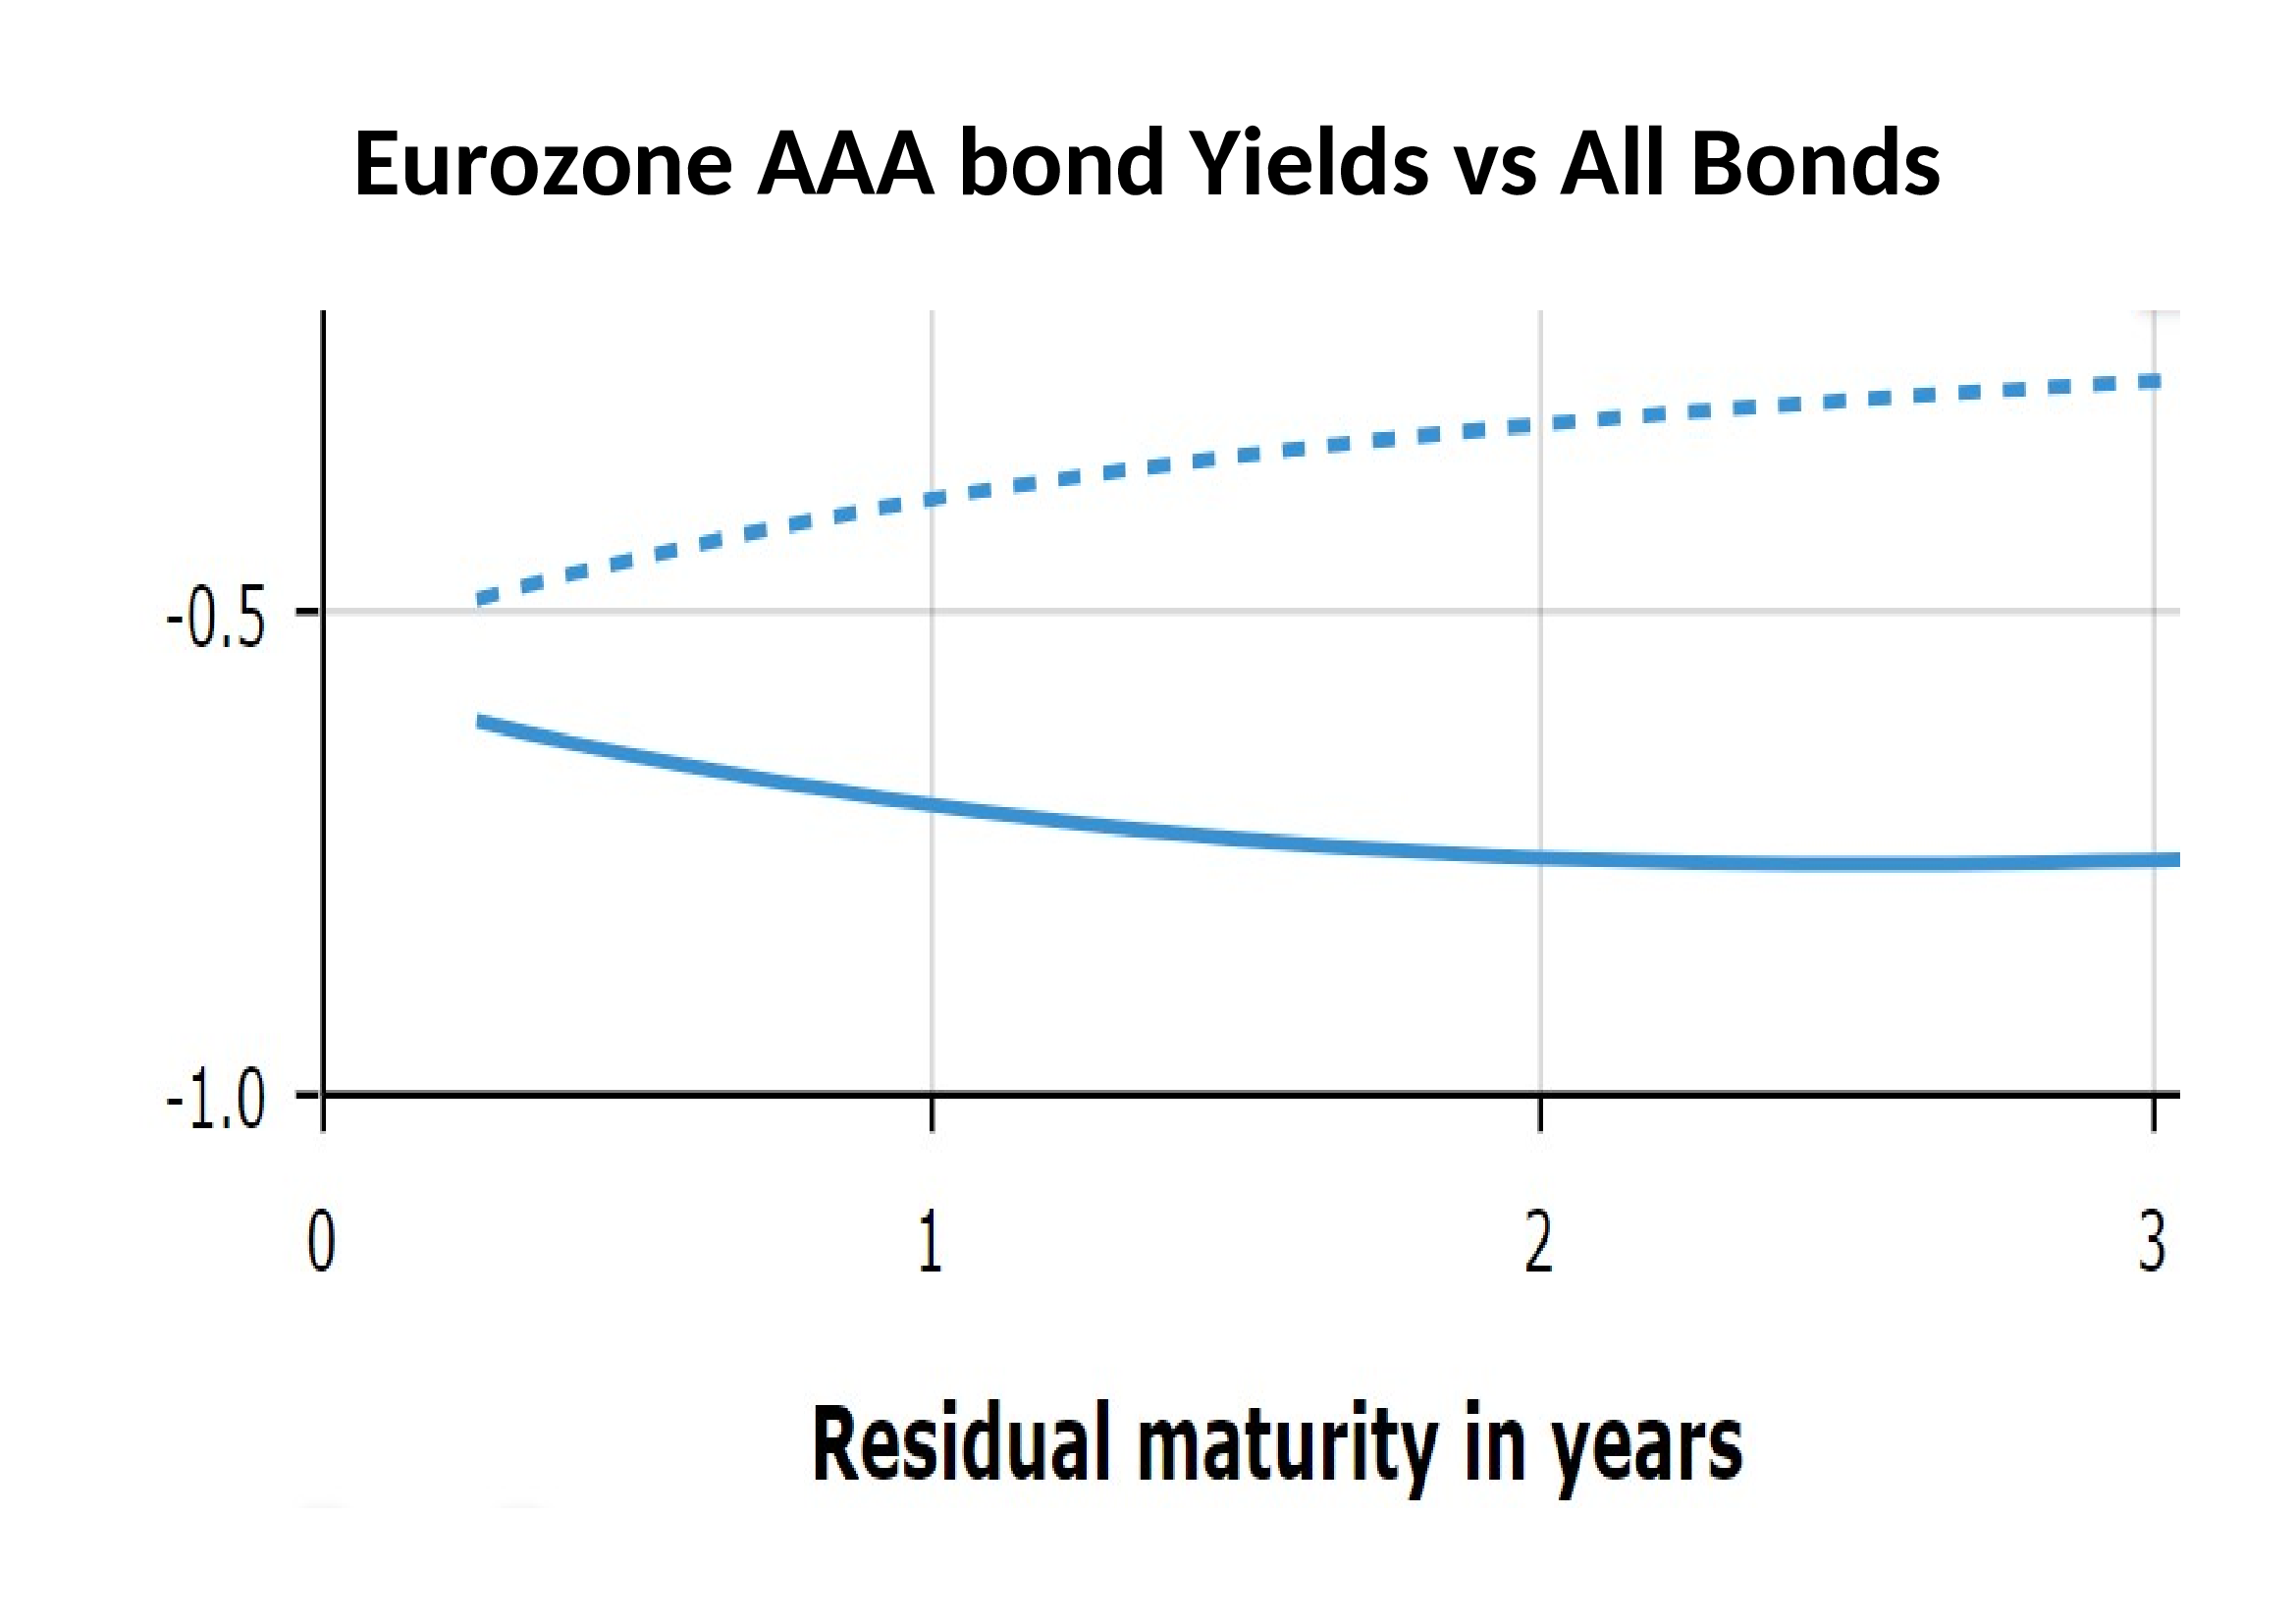
Source: ECB
It is interesting to note that the yield on AAA bonds, with a maturity of less than two years, steadily becomes less negative, whilst the aggregated yield of all bonds continues to decline.
The broader high-yield market still offers positive yield but the Eurozone is likely to be the domicile of choice for new issuers, since Euro high-yield now trades at increasingly lower yields than the more liquid US market, the liquidity tail is wagging the dog: –
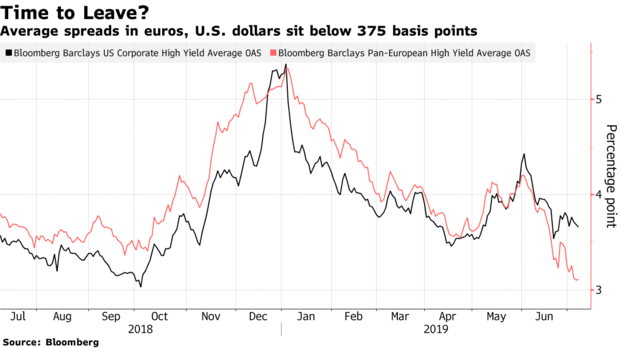
Source: Bloomberg, Barclays
The yield compression within the Eurozone has been more dramatic but it has been mirrored by the US where the spread between BBB and BB narrowed to a 12 year low of 60 basis points this month.
Wither away the dealers?
Forgotten, amid the inexorable bond rally, is dealer liquidity, yet it is essential, especially when investors rush for the exit simultaneously. For corporate bond market-makers and brokers the impact of QE has been painful. If the ECB is a buyer of a bond (and they pre-announce their intentions) then the market is guaranteed to rise. Liquidity is stifled in a game of devil take the hindmost. Alas, non-eligible issues, which the ECB does not deign to buy, find few natural buyers, so few institutions can justify purchases when credit default risk remains under-priced and in many cases the yield to maturity is negative.
An additional deterrent is the cost of holding an inventory of fixed income securities. Capital requirements for other than AAA government paper have increased since 2009. More damaging still is the negative carry across a wide range of instruments. In this environment, liquidity is bound to be impaired. The danger is that the underlying integrity of fixed income markets has been permanently impaired, without effective price intermediation there is limited price discovery: and without price discovery there is a real danger that there will be no firm, ‘dealable’ prices when they are needed most.
In this article from Bloomberg – A Lehman Survivor Is Prepping for the Next Credit Downturn – the interviewee, Pilar Gomez-Bravo of MFS Investment Management, discusses the problem of default risk in terms of terms of opacity (the emphasis is mine): –
Over a third of private high-yield companies in Europe, for example, restrict access to financial data in some way, according to Bloomberg analysis earlier this year. Buyers should receive extra compensation for firms that curb access to earnings with password-protected sites, according to Gomez-Bravo.
Borrowers still have the upper hand in the U.S. and Europe. Thank cheap-money policies and low defaults. Speculation the European Central Bank is preparing for another round of quantitative easing is spurring the rally — and masking fragile balance sheets.
Borrowers still have the upper hand indeed, earlier this month Italy issued a Eur3bln tranche of its 2.8% coupon 50yr BTP; there were Eur17bln of bids from around 200 institutions (bid/cover 5.66, yield 2.877%). German institutions bought 35% of the issue, UK investors 22%. The high bid/cover ratio is not that surprising, only 1% of Euro denominated investment grade paper yields more than 2%.
I am not alone in worrying about the integrity of the bond markets in the event of another crisis, last September ESMA – Liquidity in EU fixed income markets – Risk indicators and EU evidence concluded: –
Episodes of short-term volatility and liquidity stress across several markets over the past few years have increased concerns about the worsening of secondary market liquidity, in particular in the fixed income segment…
…our findings show that market liquidity has been relatively ample in the sovereign segment, potentially also due to the effects of supportive economic policies over more recent years. This is different from our findings in the corporate bond market, where in recent years we did not find systematic and significant drop in market liquidity but we observed episodes of decreasing market liquidity when market conditions deteriorated…
We find that in the sovereign bond segment, bonds that have a benchmark status and are characterised by larger outstanding amounts tend to be more liquid while market volatility is negatively related to market liquidity. Outstanding amounts are the main bond-level drivers in the corporate bond segment…
With reference to corporate bond markets, the sensitivity of bond liquidity to bond-specific and market factors is larger when financial markets are under stress. In particular, bonds characterised by more volatile market liquidity are found to be more vulnerable in periods of market stress. This empirical result is consistent with the market liquidity indicators developed for corporate bonds pointing at episodes of decreasing market liquidity when wider market conditions deteriorate.
ESMA steer clear of discussing negative yields and their impact on the profitability of market-making, but the BIS annual economic report, published last month, has no such qualms (the emphasis is mine): –
Household debt has reached new historical peaks in a number of economies that were not at the heart of the GFC, and house price growth has in many cases stalled. For a group of advanced small open economies, average household debt amounted to 101% of GDP in late 2018, over 20 percentage points above the pre-crisis level… Moreover, household debt service ratios, capturing households’ principal and interest payments in relation to income, remained above historical averages despite very low interest rates…
…corporate leverage remained close to historical highs in many regions. In the United States in particular, the ratio of debt to earnings in listed firms was above the previous peak in the early 2000s. Leverage in emerging Asia was still higher, albeit below the level immediately preceding the 1990s crisis. Lending to leveraged firms – i.e. those borrowing in either high-yield bond or leveraged loan markets – has become sizeable. In 2018, leveraged loan issuance amounted to more than half of global publicly disclosed loan issuance loans excluding credit lines.
… following a long-term decline in credit quality since 2000, the share of issuers with the lowest investment grade rating (including financial firms) has risen from around 14% to 45% in Europe and from 29% to 36% in the United States. Given widespread investment grade mandates, a further drop in ratings during an economic slowdown could lead investors to shed large amounts of bonds quickly. As mutual funds and other institutional investors have increased their holdings of lower-rated debt, mark-to-market losses could result in fire sales and reduce credit availability. The share of bonds with the lowest investment grade rating in investment grade corporate bond mutual fund portfolios has risen, from 22% in Europe and 25% in the United States in 2010 to around 45% in each region.
How financial conditions might respond depends also on how exposed banks are to collateralised loan obligations (CLOs). Banks originate more than half of leveraged loans and hold a significant share of the least risky tranches of CLOs. Of these holdings, US, Japanese and European banks account for around 60%, 30% and 10%, respectively…
…the concentration of exposures in a small number of banks may result in pockets of vulnerability. CLO-related losses could reveal that the search-for-yield environment has led to an underpricing and mismanagement of risks…
In the euro area, the deterioration of the growth outlook was more evident, and so was its adverse impact on an already fragile banking sector. Price-to-book ratios fell further from already depressed levels, reflecting increasing concerns about banks’ health…
Unfortunately, bank profitability has been lacklustre. In fact, as measured, for instance, by return-on-assets, average profitability across banks in a number of advanced economies is substantially lower than in the early 2000s. Within this group, US banks have performed considerably better than those in the euro area, the United Kingdom and Japan…
…persistently low interest rates and low growth reduce profits. Compressed term premia depress banks’ interest rate margins from maturity transformation. Low growth curtails new loans and increases the share of non-performing ones. Therefore, should growth decline and interest rates continue to remain low following the pause in monetary policy normalisation, banks’ profitability could come under further pressure.
Conclusion and investment opportunities
Back in 2006, when commodity investing, as part of a diversified portfolio, was taking the pension fund market by storm, I gave a series of speeches in which I beseeched fund managers to consider carefully before investing in commodities, an asset class which had for more than 150 years exhibited a negative expected real return.
An astonishingly large percentage of fixed income securities are exhibiting similar properties today. My advice, then for commodities and today, for fixed income securities, is this, ‘By all means buy, but remember, this is a trading asset, its long-term expected return is negative; in other words, please, don’t forget to sell.’
Given what has happened this month, this video might seem out of date but this was my roundup from 6th February.

![]()
Macro Letter – No 87 – 24-11-2017
Bull market breather or beginning of the end?
Stock markets have finally taken a breather over the last fortnight, although the S&P 500 has made a new, marginal, high this week. Cause for concern has been growing, however, in the bond markets where 2yr US bonds have seen a stately rise in yields. The chart below shows the constant maturity 2yr (blue) and 10yr (red) Treasury Note since January 2016:-
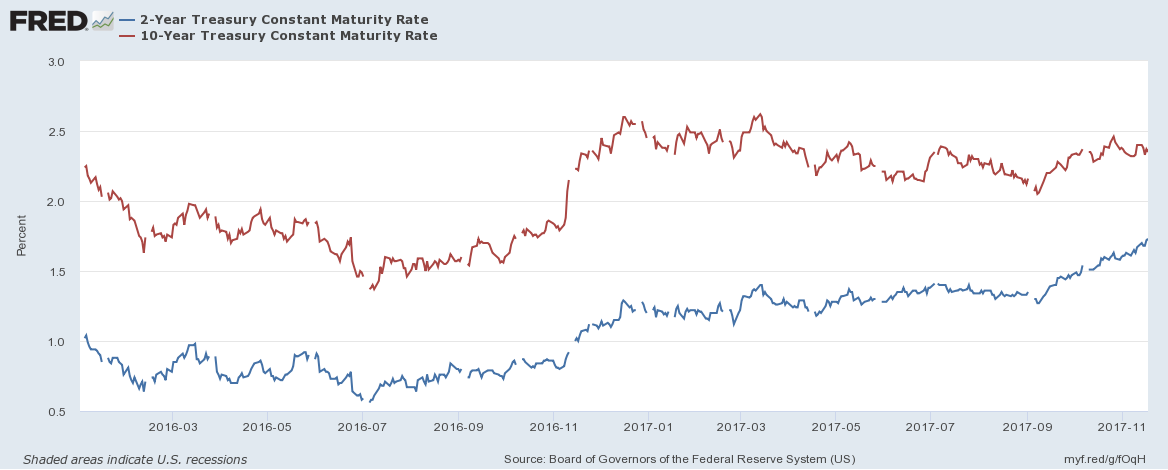
Source: Federal Reserve Bank of St Louis
The flattening of the yield curve has led many commentators to predict an imminent recession. Looking beyond the Treasury market, however, the picture looks rather different. The next chart shows the spread of Moody’s Aaa and Baa corporate bond yields over 10yr Treasuries:-
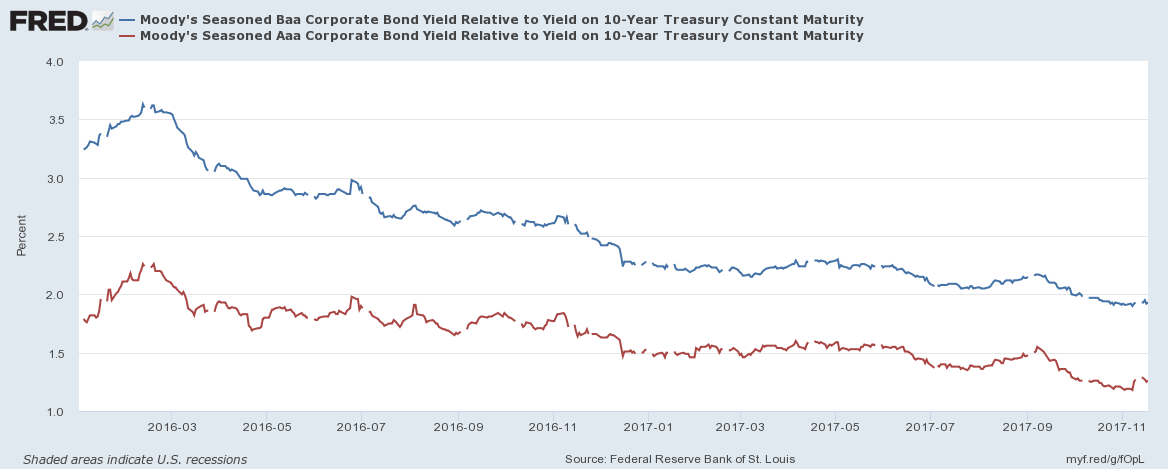
Source: Federal Reserve Bank of St Louis, Moody’s
Spreads have continued to tighten despite the rise in short-term rates. In absolute terms their yields have risen since the beginning of November but this is from record lows. The High Yield Index (purple) shows this more clearly in the chart below:-
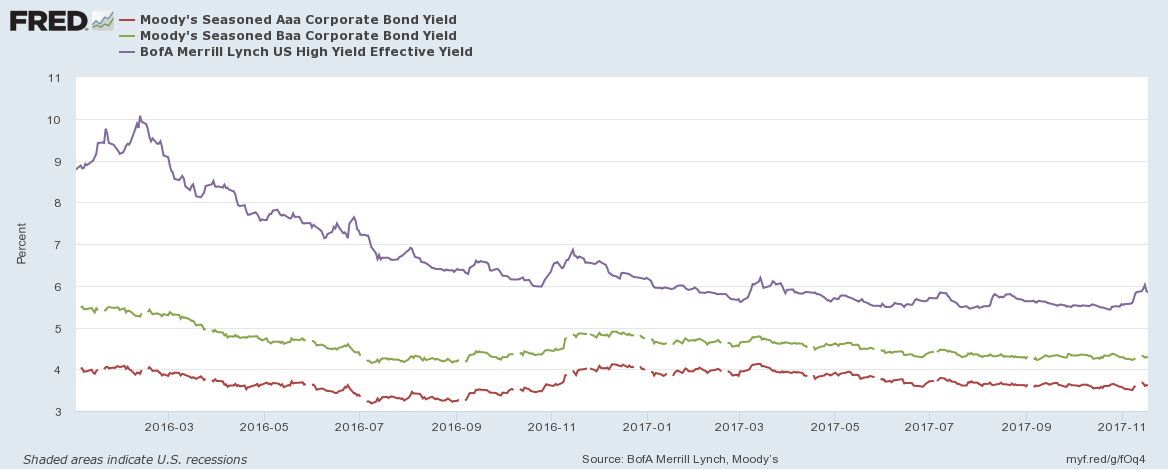
Source: Federal Reserve Bank of St Louis, Moody’s, Merrill Lynch
A similar spike in yields was evident in November 2016. I believe, in both cases, this may be due to position squaring ahead of the Thanksgiving holidays and the inevitable decline in liquidity typical of December trading. There are differences between 2016 and this year, however, the strength of the high-yield bond bull market was even more pronounced last year but Treasury 2yr Note yields had only bottomed in July, it was too soon to predict a bear market and the Federal Reserve were assuming a less hawkish stance. This year the rising yield of 2yr Notes has been more clear-cut, which may encourage further liquidation over the next few weeks, however, with economic growth forecasts being revised higher, rating agencies have upgraded many corporate issuers. Credit quality appears to be improving even as official interest rates rise and the US Treasury yield curve flattens.
In Macro Letter – No 74 – 07-04-2017 – US 30yr Swaps have yielded less than Treasuries since 2008 – does it matter? I examined the evolution of the interest rate swap (IRS) market over the last few years. I’ve updated the table showing the spread between T-Bonds and IRS across maturities:-
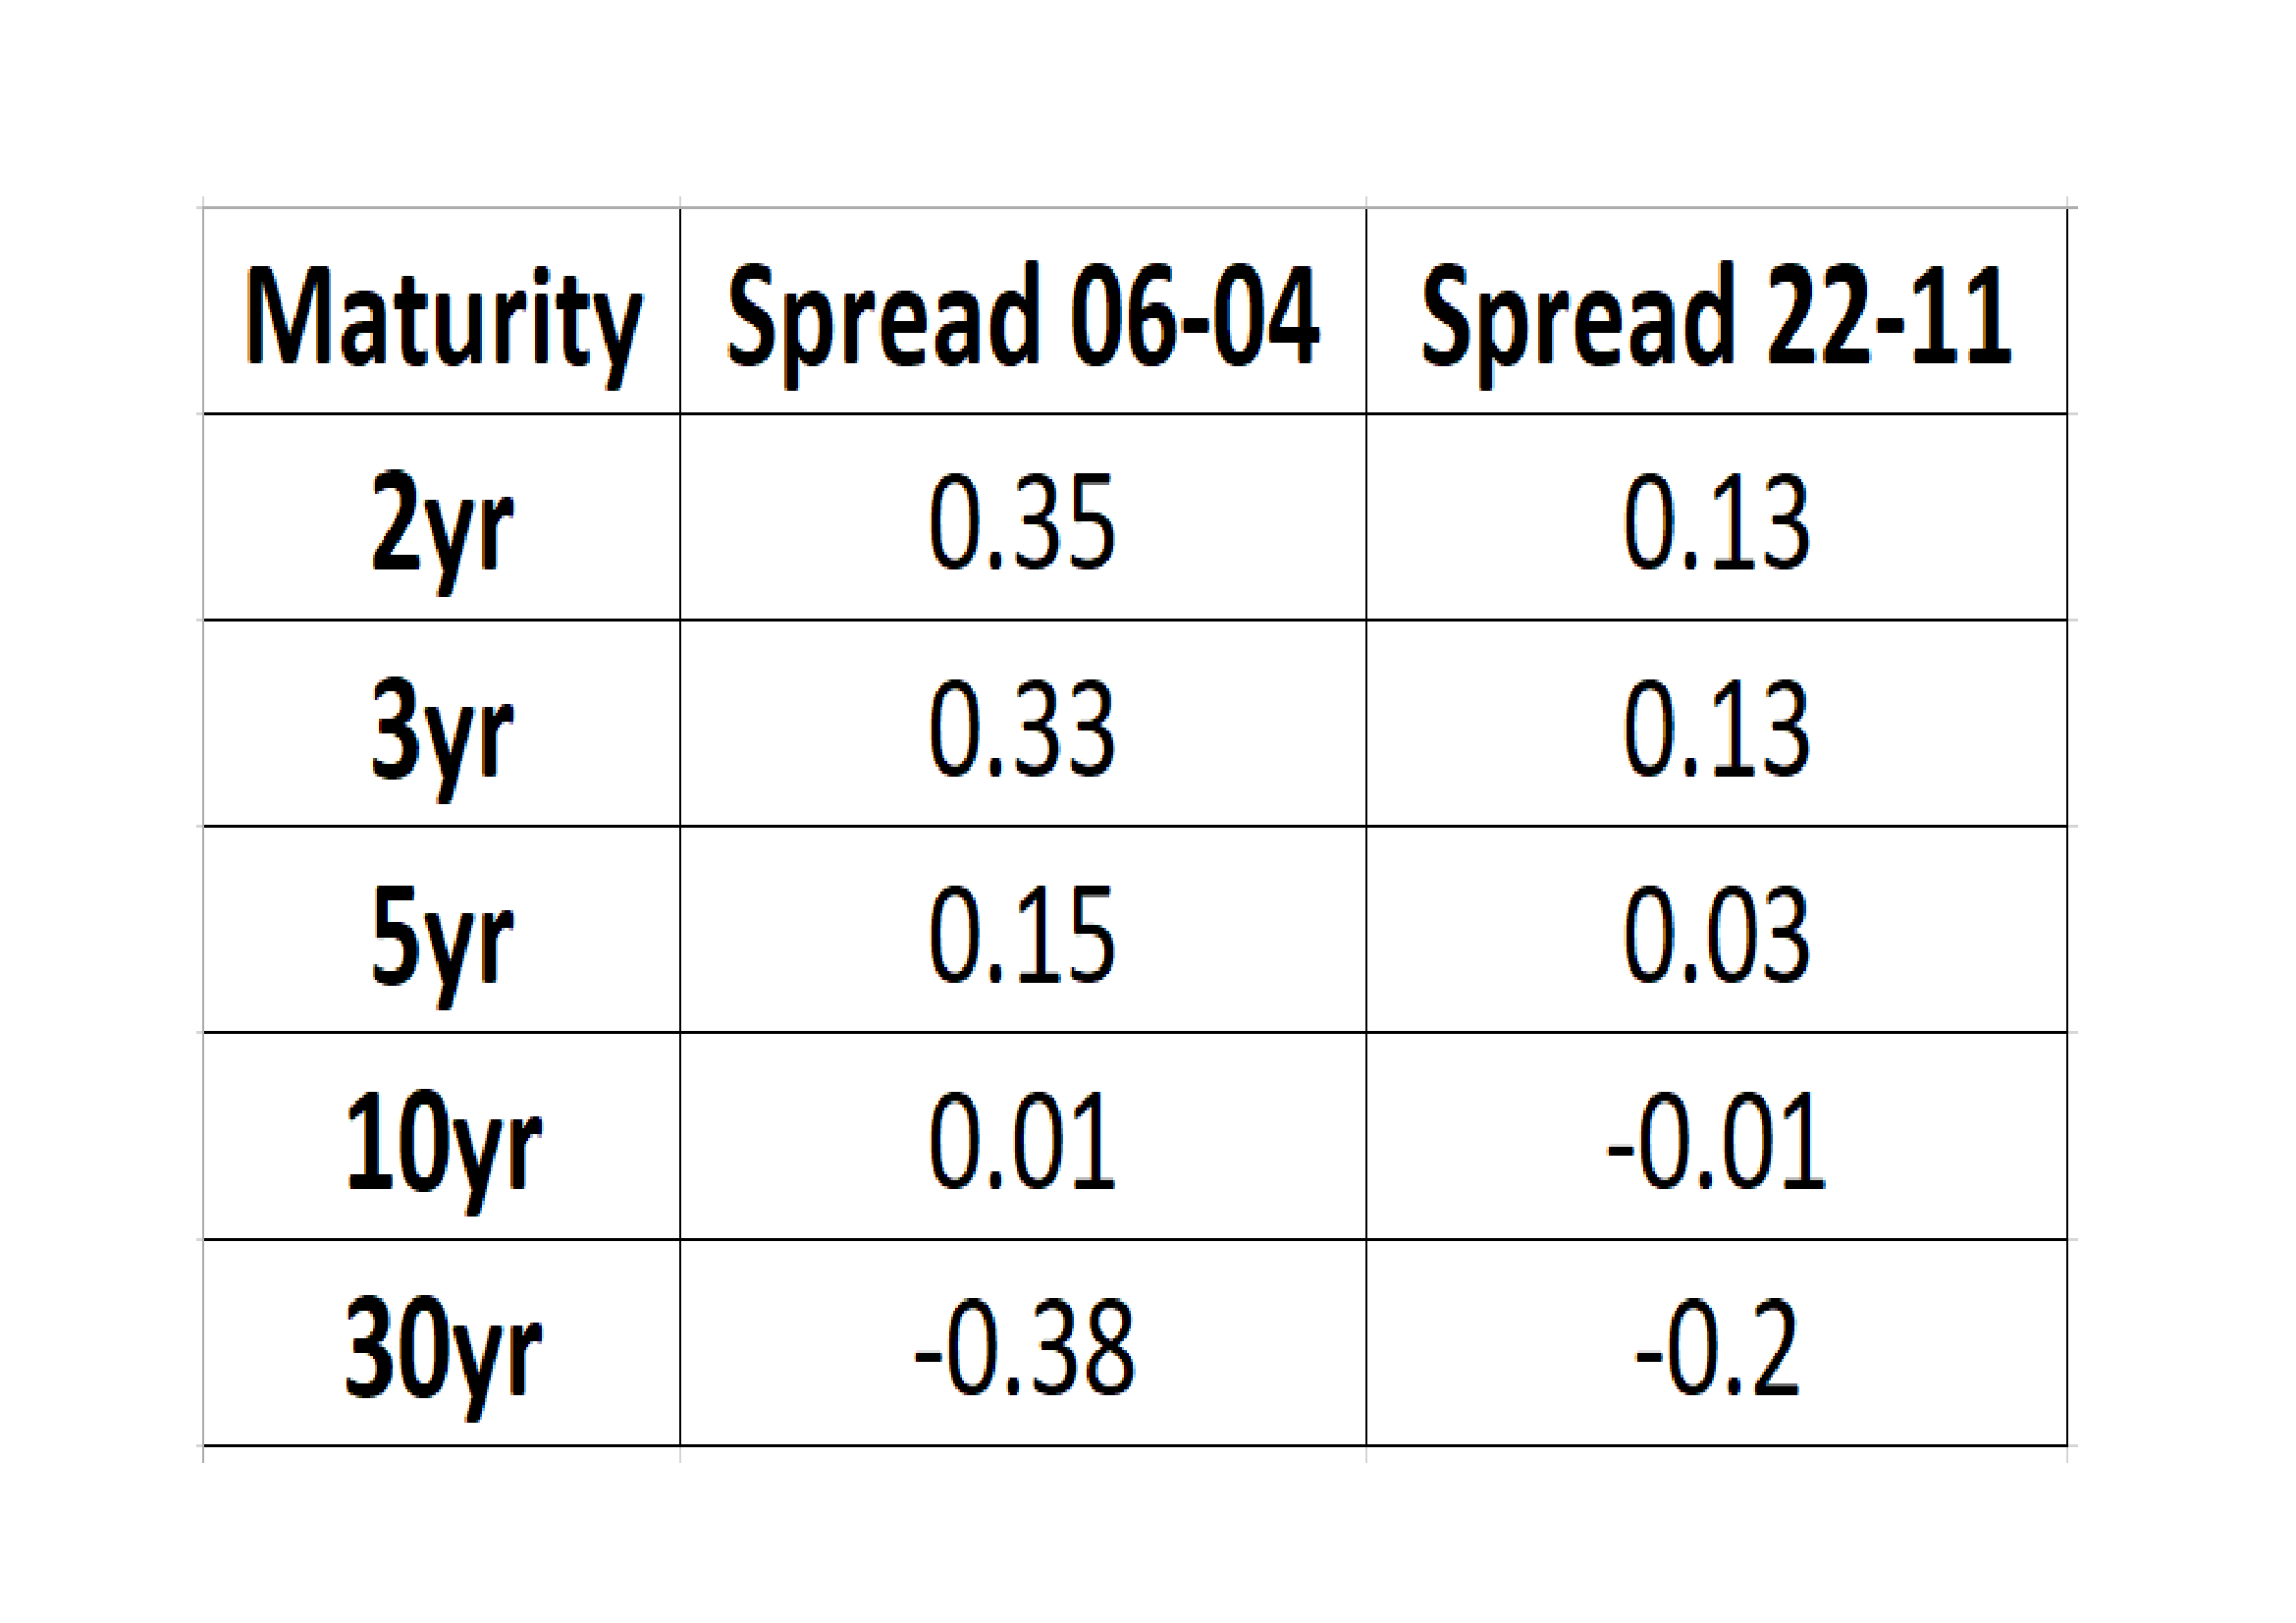
Source: Investing.com, The Financials.com
At the 10yr maturity the differential between IRS and Treasuries has barely changed, but elsewhere along the yield curve, compression has occurred, with maturities of less than 10 years narrowing whilst the 30yr IRS negative spread has also compressed, from nearly 40 basis points below Treasuries to just 20 basis points today. In other words, the flattening of the IRS yield curve has been much less dramatic than that of the Treasury yield curve – 2yr/30yr IRS has flattening by 36 basis points since early April, whilst 2yr/30yr Treasuries has flattened by 76 basis points over the same period.
It is important to note that while the IRS curve has been flattening less rapidly it still remains flatter than the Treasury curve (IRS 2’s/30’s = 0.67% Treasury 2’s/30’s = 1.00%). One interpretation is that the IRS curve has been reflecting the weakness of economic growth for a protracted period while the Treasury curve has been artificially steepened by the zero interest rate policy of the Federal Reserve.
Conclusions and Investment Opportunities
Many commentators have pointed to the flattening of the Treasury yield curve as evidence of an imminent recession, the IRS curve, however, has flattened by far less, partly because it was flatter to begin with. Perhaps the IRS curve reflects the lower trend growth of the US economy since the great recession. An alternative explanation is that it is a response to investment flows and changes in the regulatory regime (as discussed in Macro letter – No74). One thing appears clear, the combination of unconventional central bank policies, such as quantitative easing (QE) and the relentless, investor ‘quest for yield’ over the last decade has distorted the normal signalling power of the bond market.
Economic growth forecasts continue to be revised upwards, prompting central banks to begin reducing the quantum of QE in aggregate. Corporate earnings have generally been rising, credit quality improving. We are nearer the end of the bull market than the beginning, but it is much too soon to predict the end, on the basis of the recent rise in corporate bond yields.


Macro Letter – Supplemental – No 4 – 12-5-2017
Is there any value in the government bond markets?
Since the end of the great financial recession, bond yields in developed countries have fallen to historic lows. The bull market in stocks which began in March 2009, has been driven, more than any other factor, by the fall in the yield of government bonds.
With the Federal Reserve now increasing interest rates, investors are faced with a dilemma. If they own bonds already, should they continue to remain invested? Inflation is reasonable subdued and commodity prices have weakened recently as economic growth expectations have moderated once more. If investors own stocks they need to be watching the progress of the bond market: bonds drove stocks up, it is likely they will drive them back down as well.
The table below looks at the relative valuation between stocks and bonds in the major equity markets. The table (second item below) is ranked by the final column, DY-BY – Dividend Yield – Bond Yield, sometimes referred to as the yield gap. During most of the last fifty years the yield gap has been inverse, in other words dividend yields have been lower than bond yields, the chart directly below shows the pattern for the S&P500 and US 10yr government bonds going back to 1900:-
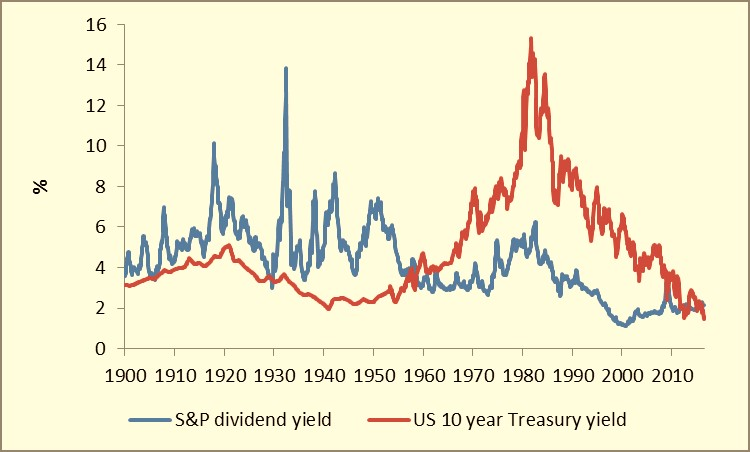
Source: Newton Investment Management
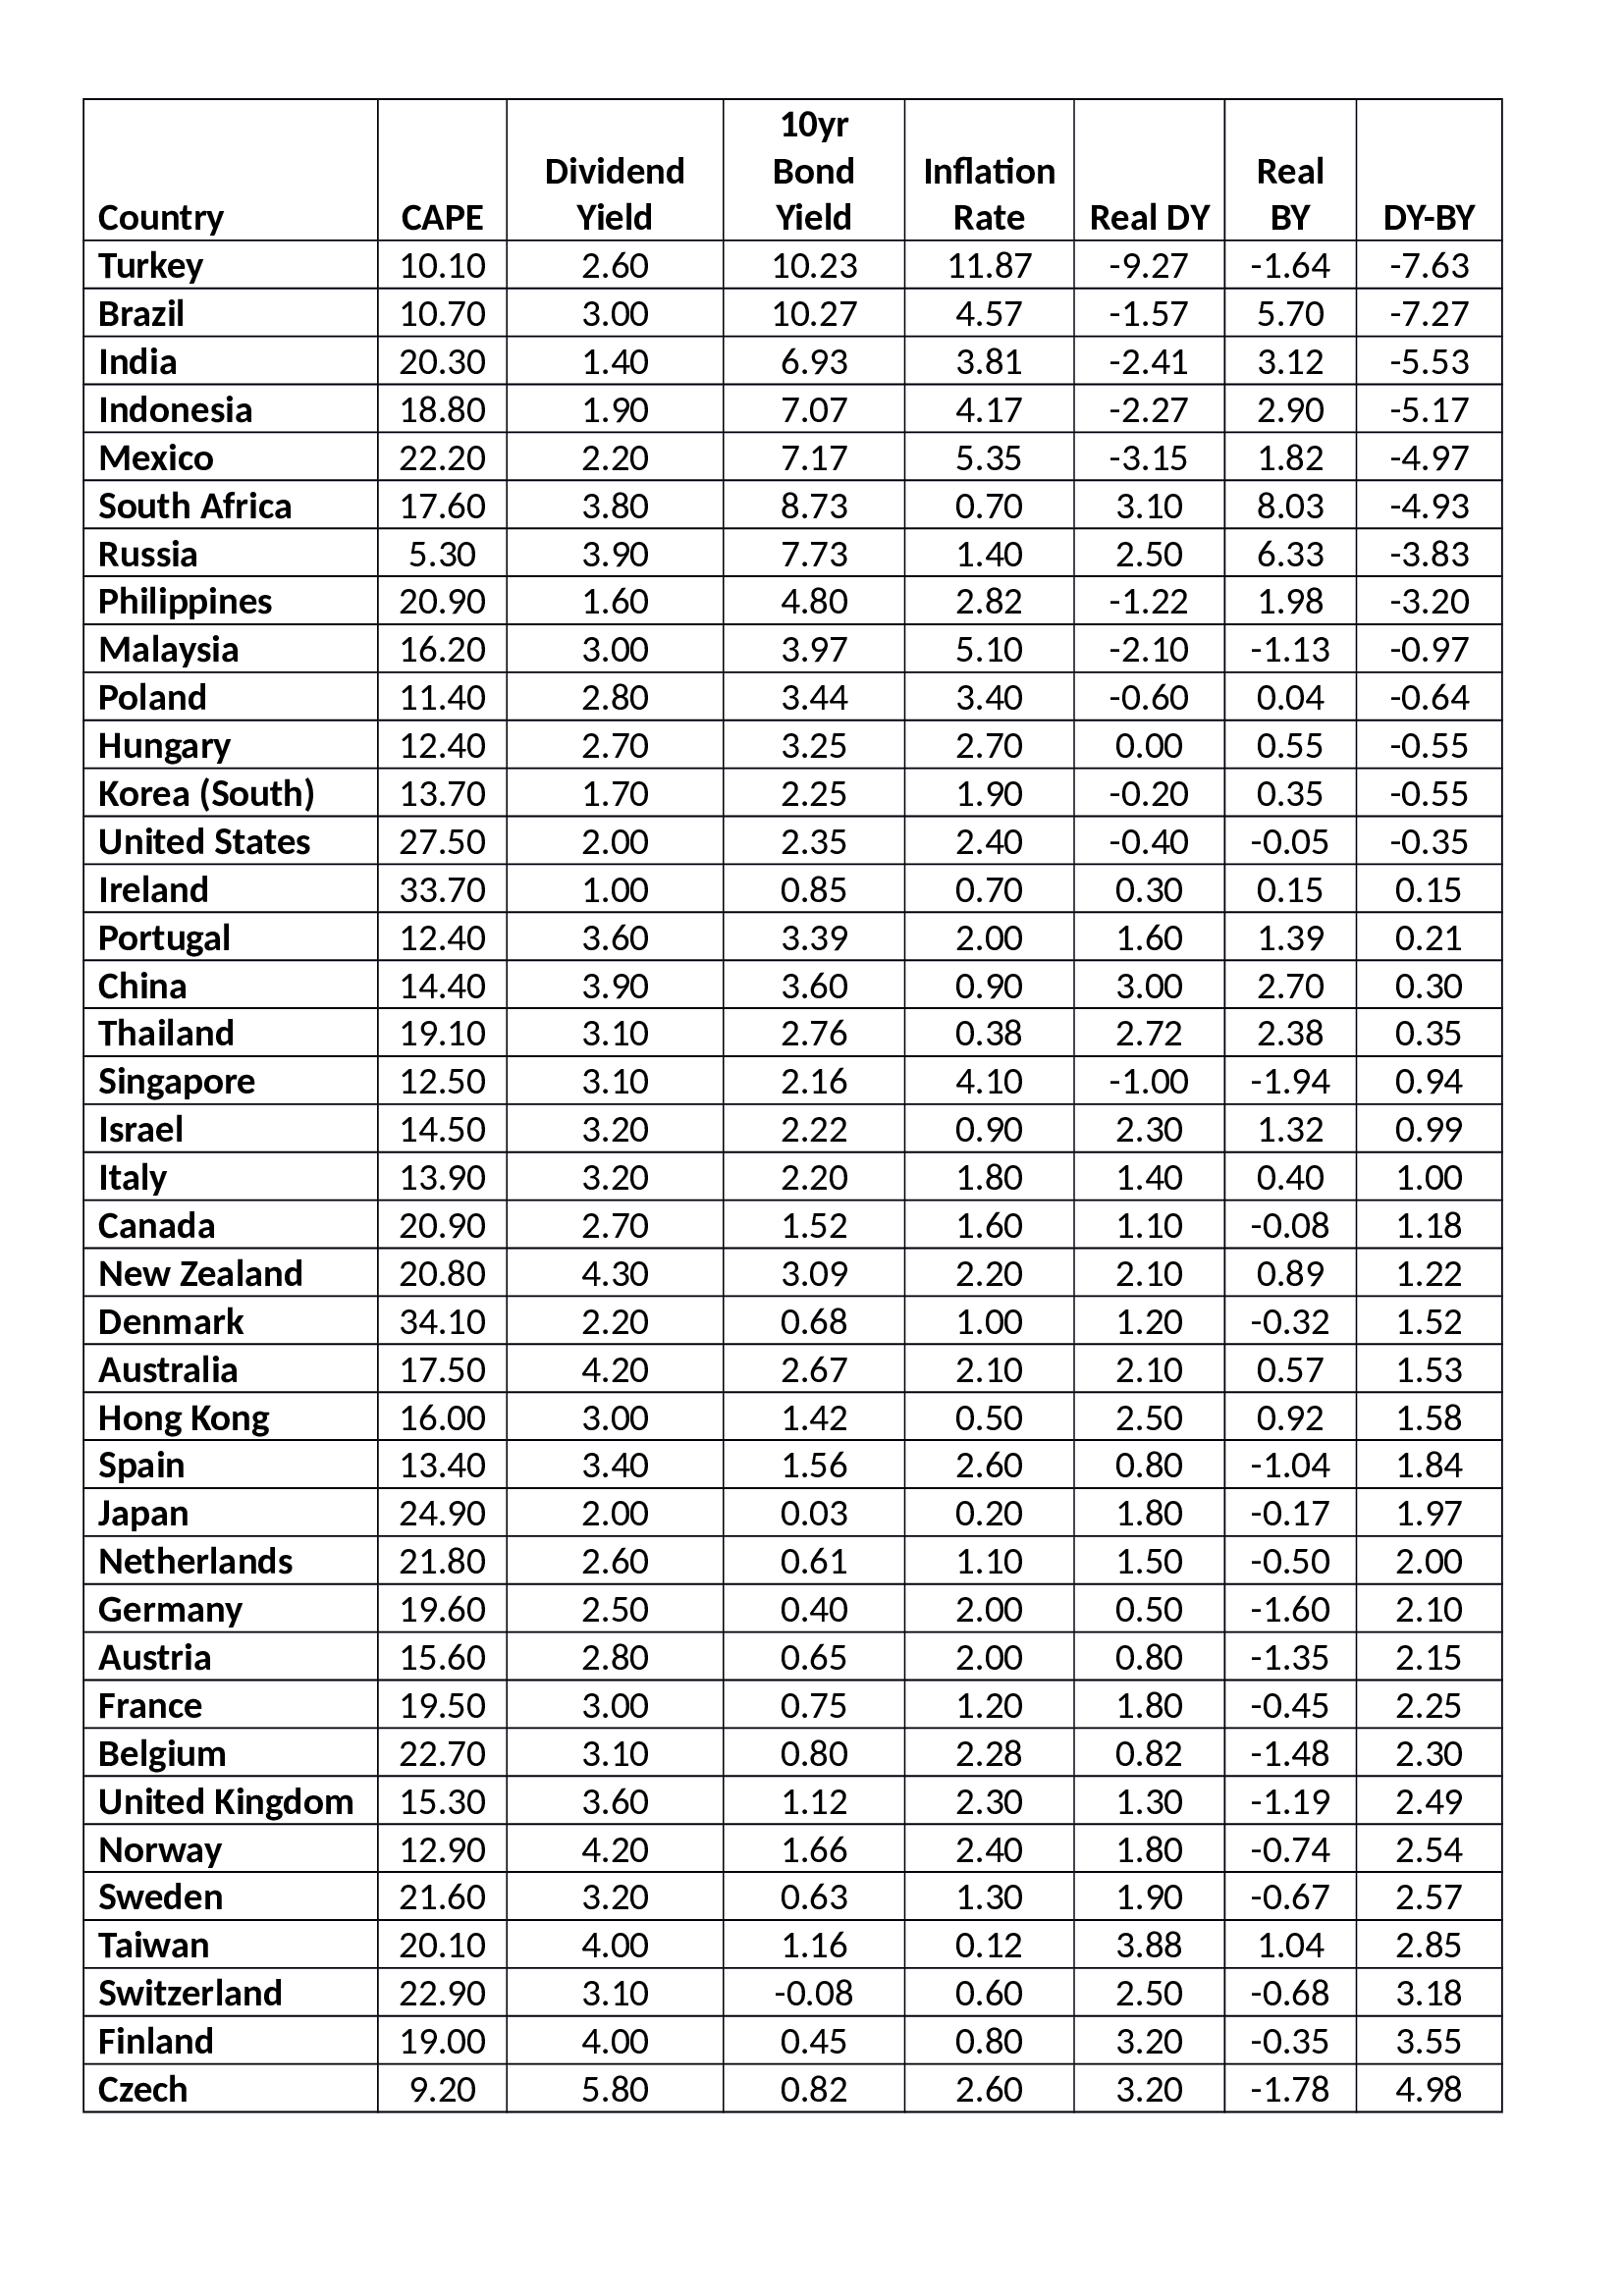
Source: StarCapital, Investing.com, Trading Economics
The CAPE – Cyclically Adjusted Price Earnings Ratio and Dividend Yield Data is from the end of March, bond yields were taken on Monday morning 8th May, so these are not direct comparisons. The first thing to notice is that an inverse yield gap tends to be associated with countries which have higher inflation. This is logical, an equity investment ought to offer the investor an inflation hedge, a fixed income investor, by contrast, is naturally hedged against deflation.
Looking at the table in more detail, Turkey tops the list, with an excess return, for owning bonds rather than stocks, of more than 7%, yet with inflation running at a higher rate than the bond yield, the case for investment (based simple on this data) is not compelling – Turkish bonds offer a negative real yield. Brazil offers a more interesting prospect. The real bond yield is close to 6% whilst the Bovespa real dividend yield is negative.
Some weeks ago in Low cost manufacturing in Asia – The Mighty Five – MITI V – I looked more closely at India and Indonesia. For the international bond investor it is important to remember currency risk:-
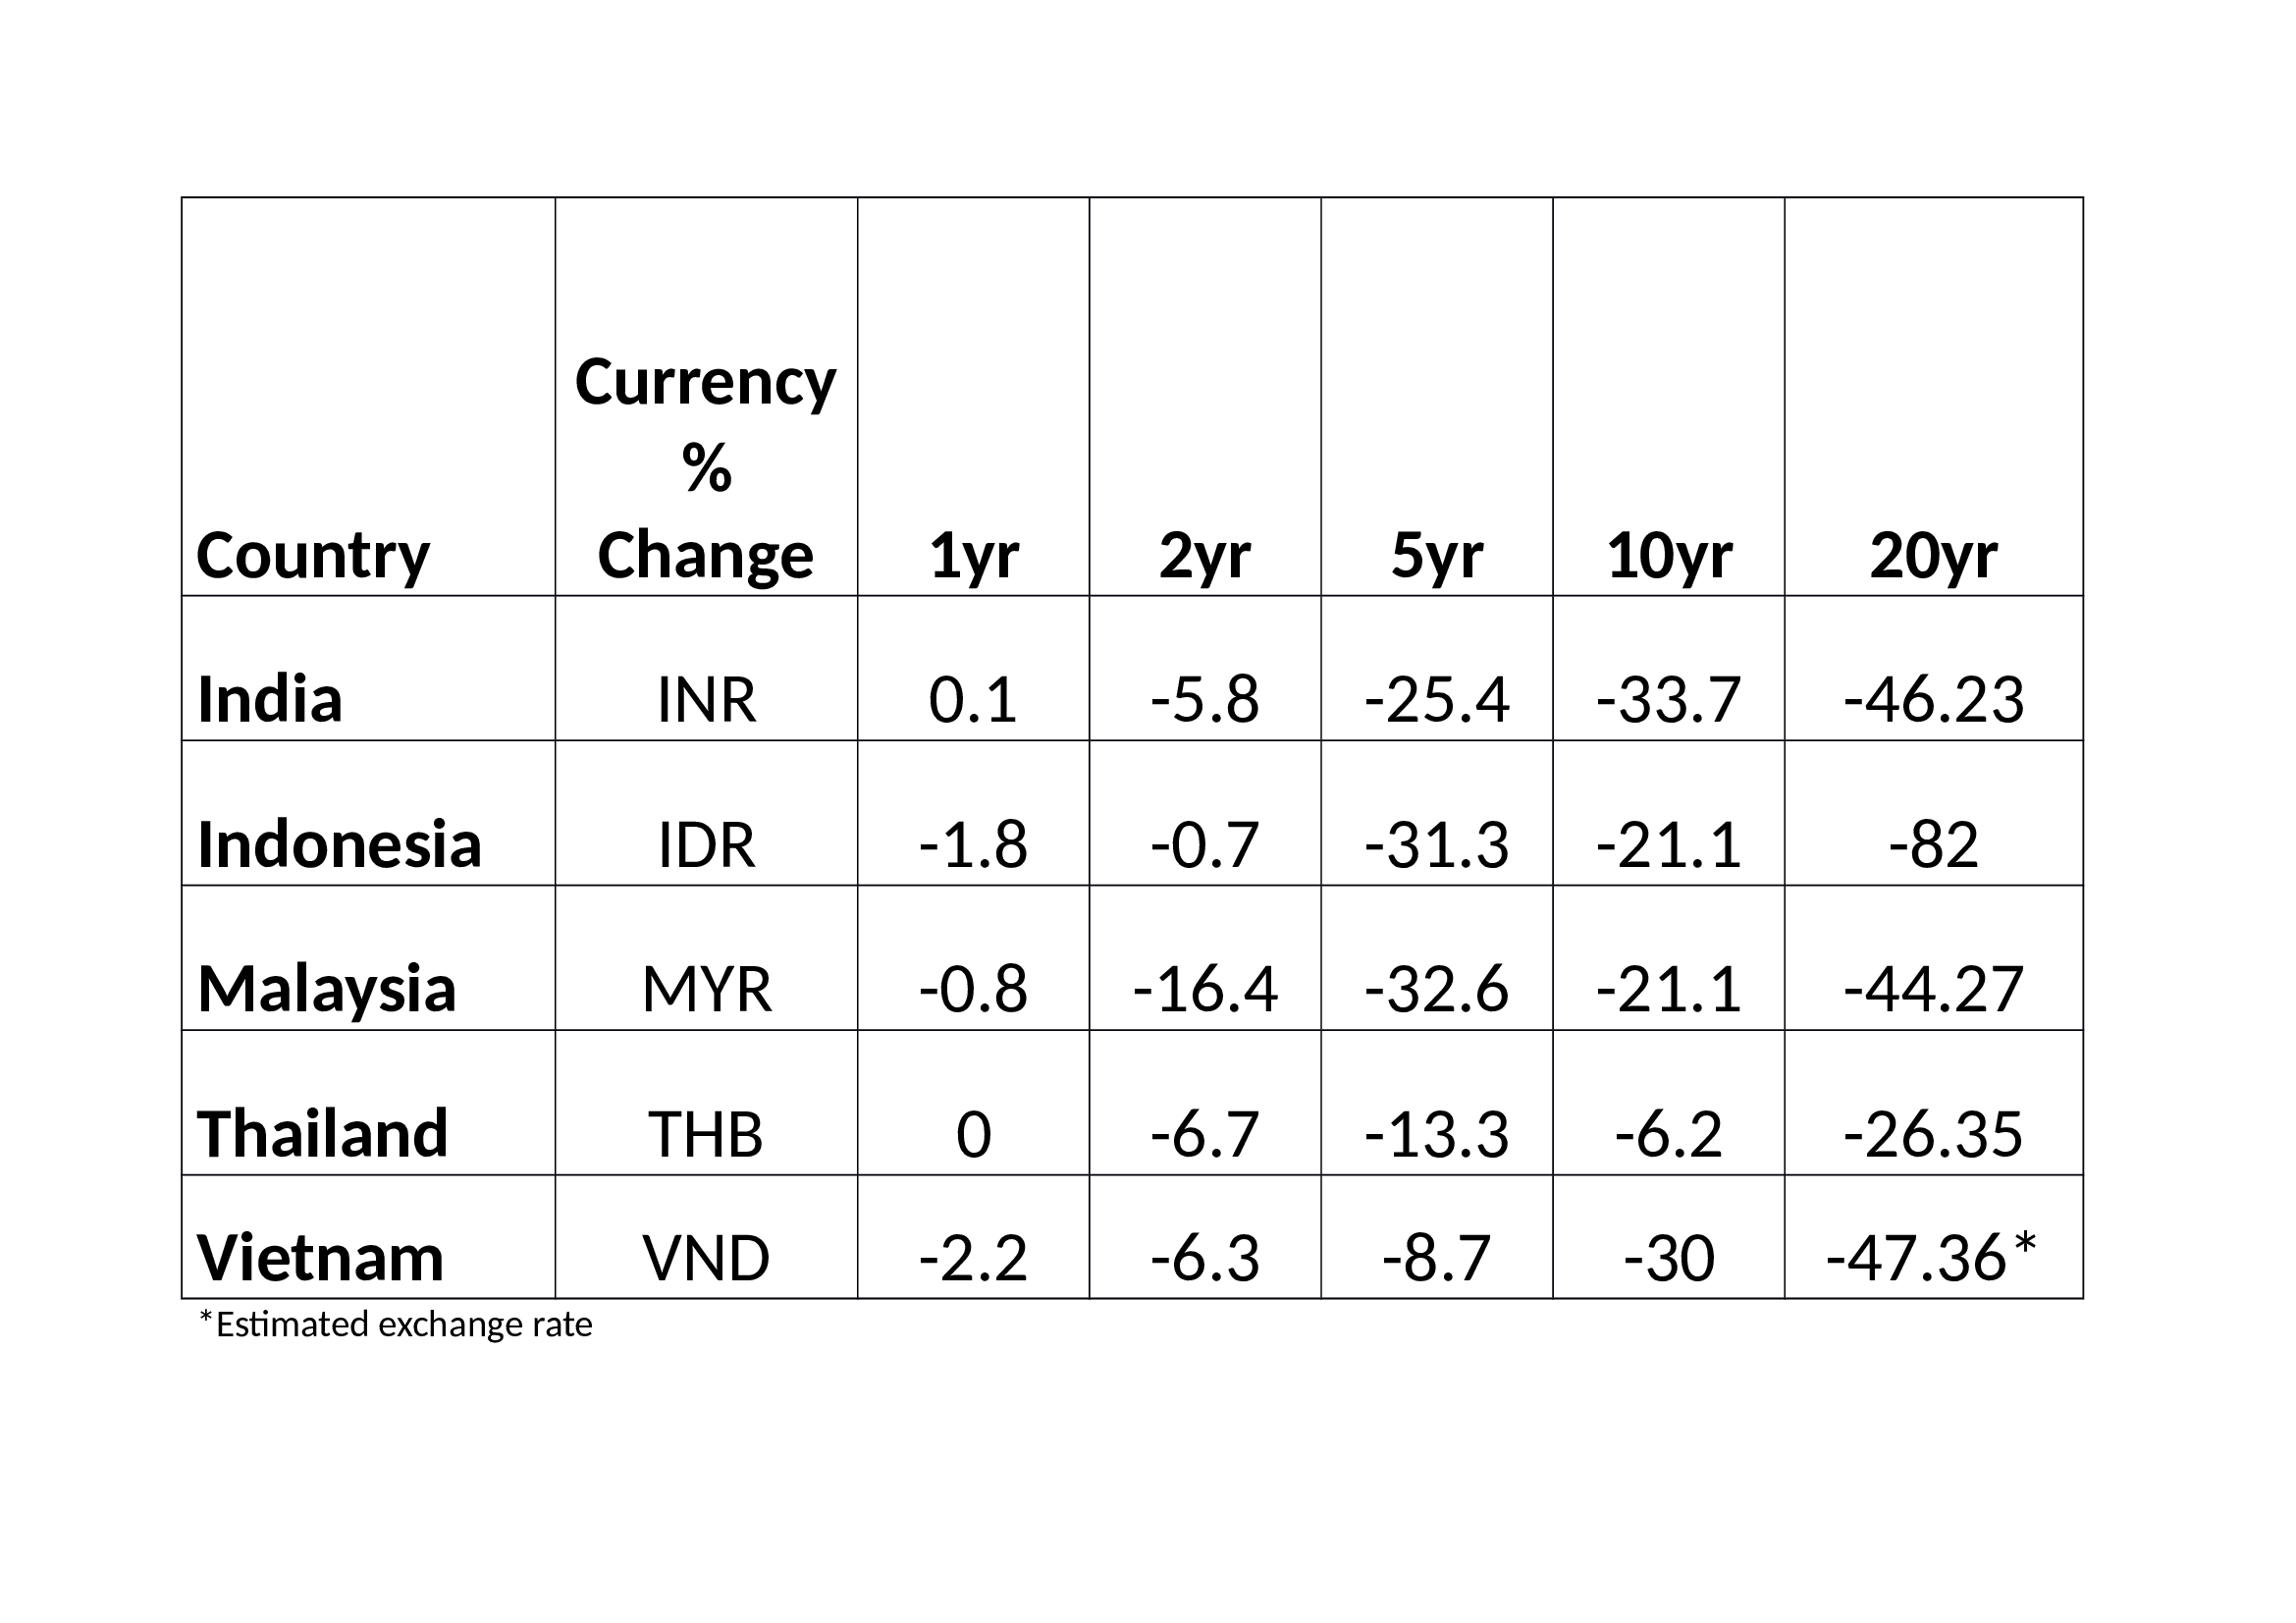
Source: Trading Economics, World Bank
If past performance is any guide to future returns, and all investment advisors disclaim this, then you should factor in between 2% and 4% per annum for a decline in the value of the capital invested in Indian and Indonesian bonds over the long run. This is not to suggest that there is no value in Indian or Indonesian bonds, merely that an investor must first decide about the currency risk. A 7% yield over ten years may appear attractive but if the value of the asset falls by a third, as has been the case in India during the past decade, this may not necessarily suffice.
Looking at the first table again, the relationship between bond yields in the Eurozone has been distorted by the actions of the ECB, nonetheless the real dividend yield for Finnish stocks at 3.2% is noteworthy, whilst Finnish bonds are not. Greek 10yr bonds are testing their lowest levels since August 2014 this week (5.61%) which is a long way from their highs of 2012 when yields briefly breached 40% during the Eurozone crisis. Emmanuel Macron’s election as France’s new President certainly helped but the German’s continue to baulk at issuing Eurobonds to bail out their profligate neighbours.
Conclusion and Investment Opportunity
Returning to the investor’s dilemma. Stocks and bonds are both historically expensive. They have been driven higher by a combination of monetary and quantitative easing by Central Banks and subdued inflation. For long-term investors such as pension funds, which need to invest in fixed income securities to match liabilities, the task is Herculean, precious few developed markets offer a real yield at all and none offer sufficient yield to match those pension liabilities.
During the bull-market these long-term investors actively increased the duration of their portfolios whilst at the same time the coupons on new issues fell steadily: new issues have a longer duration as well. It would seem sensible to shorten portfolio duration until one remembers that the Federal Reserve are scheduled to increase short term interest rates again in June. Short rates, in this scenario will rise faster than long-term rates. Where can the fixed income portfolio manager seek shelter?
Emerging market bonds offer limited liquidity since their markets are much smaller than those of the US and Europe. They offer the investor higher returns, but expose them to heady cocktail of currency risk, credit risk and the kind of geopolitical risk that ultra-long dated developed country bonds do not.
A workable solution is to consider credit and geopolitical risk at the outset and then actively manage the currency risk, or sub-contract this to an overlay manager. Sell long duration, low yielding developed country bonds and buy a diversified basket of emerging market bonds offering acceptable real return and, given that in many emerging markets corporate bonds offer lower credit risk than their respective government bond market, buy a carefully considered selection of liquid corporate names too. Sadly, many pension fund managers will not be permitted to make this type of investment for fiduciary reasons.
In answer to the original question in my title? Yes, I do believe there is still value in the government bond markets, but, given the absence of liquidity in many of the less developed markets – which are the ones offering identifiable value – the portfolio manager must be prepared to actively hedge using liquid markets to avoid a forced liquidation – currency hedging is one aspect of the strategy but the judicious use of interest rate swaps and options is a further refinement managers should consider.
This strategy shortens the duration of the bond portfolio because, not only purchase bonds with a shorter maturity, but also ones with a higher coupon. Actively managing currency risk (or delegating this role to a specialist currency overlay operator) whilst not entirely mitigating foreign exchange exposures, substantially reduces them.
Emerging market equities may well offer the best long run return, but a portfolio of emerging market bonds, with positive rather than negative real-yields, is far more compelling than continuously extending duration among the obligations of the governments of the developed world.
