Italy and the repricing of European government debt

In the Long Run - small colour logo

Macro Letter – No 98 – 08-06-2018

Italy and the repricing of European government debt

  • The yield spread between 10yr BTPs and Bunds widened 114bp in May
  • Populist and anti-EU politics were the catalyst for this repricing of risk
  • Spain, Portugal and Greece all saw yields increase as Bund yields declined
  • The ECB policy of OMT should help to avoid a repeat of 2011/2012

I have never been a great advocate of long-term investment in fixed income securities, not in a world of artificially low official inflation indices and fiat currencies. Given the de minimis real rate of return I regard them as trading assets. I will freely admit that this has led me to make a number of investment mistakes, although these have generally been sins of omission rather than actual investment losses. The Italian political situation and the sharp rise in Italian bond yields it precipitated, last week, is, therefore, some justification for an investor like myself, one who has not held any fixed income securities since 2010.

An excellent overview of the Italian political situation is contained in the latest essay from John Mauldin of  Mauldin Economics – From the Front Line – The Italian Trigger:-

Italy had been without a government since its March 4 election, which yielded a hung parliament with no party or coalition holding a majority. The Five Star Movement and Lega Nord finally reached a deal, to most everyone’s surprise since those two parties, while both broadly populist, have some big differences. Nonetheless, they found enough common ground to propose a cabinet to President Sergio Mattarella.

Italian presidents are generally seen as rubberstamp figureheads. They really aren’t supposed to insert themselves into the process. Yet Mattarella unexpectedly rejected the coalition’s proposed finance minister, 81-year-old economist Paolo Savona, on the grounds Savona had previously opposed Italy’s eurozone membership. This enraged Five Star and Lega Nord, who then ended their plans to form a government and threatened to impeach Mattarella.

The whole article is well worth reading and goes on to look at debt from a global perspective. John anticipates what he calls, ‘The Great Reset,’ when the reckoning for the excessive levels of debt arrives.

Returning to the repricing of Eurozone (EZ) debt last month, those readers who have followed my market commentaries since the 1990’s, might recall an article I penned about the convergence of European government bond yields in the period preceding the introduction of the Euro. At that juncture (1998) excepting Greece, every bond market, whose government was about to adopt the Euro, was trading at a narrower credit spread to 10yr German bunds than the yield differential between the highest and lowest credit in the US municipal bond market. The widest differential in the muni-market at that time was 110bp. It was between Alabama and California – remember this was prior to the bursting of the Tech bubble.

In my article I warned about the risk of a significant repricing of European credit spreads once the honeymoon period of the single currency had ended. I had to wait more than a decade, but in 2010/2011 it looked as if I might be vindicated – this column is not entitled In the Long Run without just cause – then what one might dub the Madness of Crowds of Central Bankers intervened, saved the EZ and consigned my cautionary oracles, on the perils of the quest for yield, to the dustbin of history.

In the intervening period, since 2011, I have watched European yields inexorably converge and absolute yields turn negative, in several EZ countries, with a temerity which smacks of permanence. I have also arrived at a new conclusion about the limits of credit risk within a currency union: that they are governed by fiat in much the same manner as currencies. As long as the market believes that Mr Draghi will do, ‘…whatever it takes,’ investors will be enticed by relatively small yield enhancements.

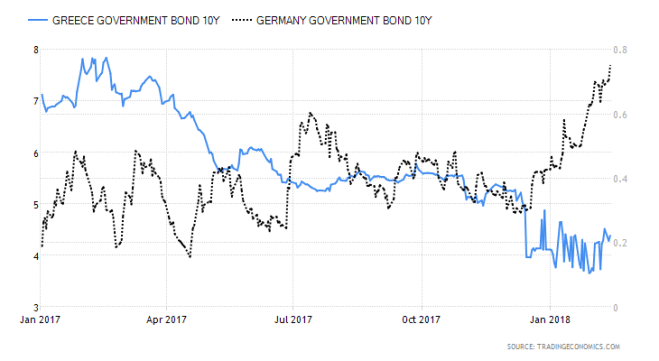
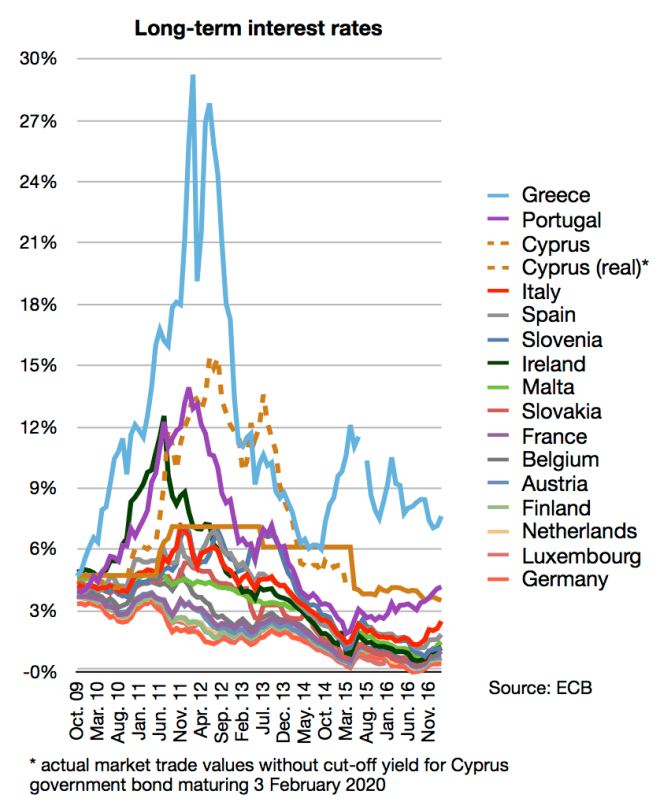
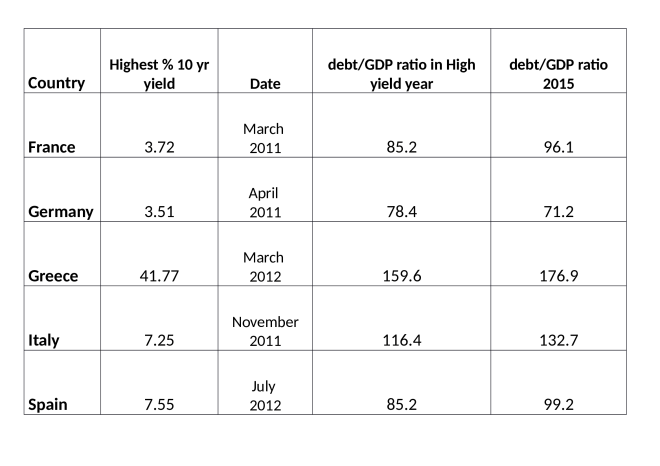
Let me elaborate on this newly-minted theory by way of an example. Back in March 2012, Greek 10yr yields reached 41.77% at that moment German 10yr yields were a mere 2.08%. The risk of contagion was steadily growing, as other peripheral EZ bond markets declined. Greece, in and of itself, was and remains, a small percentage of EZ GDP, but, as Portuguese and Spanish bonds began to follow the lead of Greece, the fear at the ECB – and even at the Bundesbank – was that Italy might succumb to contagion. Due to its size, the Italian bond market, was then, and remains today, the elephant in the room.

During the course of last month, European bond markets diverged. The table below shows the change in 10yr yields between 1st and 31st May:-

EZ 10yr yield change May 2018

Source: Investing.com

A certain degree of contagion is evident, although the PIGS have lost an ‘I’ as Irish Gilts have escaped the pejorative acronym.

At the peaks of the previous crisis, Irish 10yr Gilts made a yield high of 14.61% in July 2011, at which point their spread versus 10yr Bunds was 11.34%. When Italy entered her own period of distress, in November of that year, the highest 10yr BTP yield recorded was 7.51% and the spread over Germany reached 5.13%. By the time Greek 10yr yields reached their zenith, in March 2012, German yields were already lower and Irish and Italian spreads had begun to narrow.

During the course of last month the interest rate differential between 10yr Bunds and their Irish, Greek and Italian counterparts widened by 41, 100 and 114bp respectively. Italian 10yr yields closed at 4.25% over Bunds, less than 100bp from their 2011 crisis highs. With absolute yields significantly lower today (German 10yr yields were 2.38% in November 2011 they ended May 2018 at 36bp) the absolute percentage return differential is even higher than during the 2011 period. At 2.72% BTPs offer a return which is 7.5 times greater than 10yr Bunds. Back in 2011 the 7.51% yield was a little over three times the return available from 10yr Bunds.

I am forced to believe the reaction of the BTP market has been excessive and that spreads will narrow during the next few months. If I am incorrect in my expectation, it will fall to Mr Draghi to intervene. The Outright Monetary Transactions – OMT – policy of the ECB allows it to purchase a basket of European government bonds on a GDP weighted basis. If another crisis appears immanent they could adjust this policy to duration weight their purchases. It would then permit them to buy a larger proportion of the higher yielding, higher coupon bonds of the southern periphery. There would, no doubt, be complaints from those countries that practice greater fiscal rectitude, but the policy shift could be justified on investment grounds. If the default risk of all members of the EZ is equal due to the political will of the European Commission, then it makes sense from an investment perspective for the ECB to purchase higher yielding bonds if they have the same credit risk. A new incarnation of the Draghi Put could be implemented without too many objections from Frankfurt.

Conclusions and investment opportunities

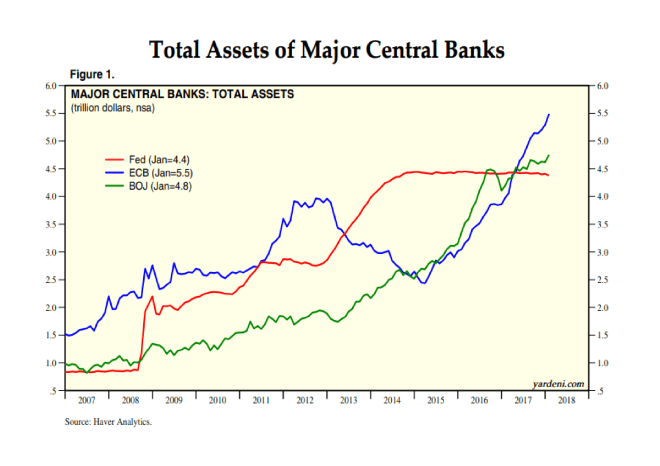
I doubt we will see a repeat of the 2011/2012 period. Lightening seldom strikes twice in the same way. The ECB will continue with its QE programme and this will ensure that EZ government bond yields remain at artificially low levels for the foreseeable future.

Unusually, I have an actionable trade idea: caveat emptor! I believe the recent widening of the 10yr Italian BTP/Spanish Bonos spread has been excessive. If there is bond market contagion, as a result of the political situation in Italy, Bonos yields may have difficulty defying gravity. If the Italian political environment should improve, the over-sold BTP market should rebound. If the ECB are forced to act to avert a new EZ crisis by increasing OMT or implementing a duration weighted approach to QE, Italy should benefit more than Spain until the yield differential narrows.

A safe place to hide – inflation and the bond markets

In the Long Run - small colour logo

Macro Letter – No 91 – 16-02-2018

A safe place to hide – inflation and the bond markets

  • US bond yields have risen from historic lows, they should rise further, they may not
  • The Federal Reserve is beginning to reduce its balance sheet other CBs continue QE
  • US bonds may still be a safe haven but a hawkish Fed makes short duration vulnerable
  • Short dated UK Gilts make be a safe place to hide, come the correction in stocks

US Bonds

I used to think if there was reincarnation, I wanted to come back as the president or the pope or a .400 baseball hitter. But now I want to come back as the bond market. You can intimidate everybody – James Carville 1993

Back in the May 1981 US official interest rates hit 20% for the third time in 14 months, the yield on US 10yr Treasury Bond yields lagged somewhat and only reached their zenith in September of that year, at 15.82%. In those days the 30yr Bond was the global bellwether for fixed income securities; its yield high was only 15.20%, the US yield curve was inverted and America languished in the depths of a deep recession.

More than a decade later in 1993 James Carville, then advisor to President Bill Clinton, was still in awe of the power of the bond market. But is that still the case today? Back then, inflation was the genie which had escaped from the bottle with the demise of the Bretton Woods agreement. Meanwhile, Paul Volker, then Chairman of the Federal Reserve was putting into practice what William McChesney Martin, one of his predecessors, had only talked about, namely taking away the punch bowl. Here, for those who are unfamiliar with the speech, is an extract; it was delivered, by Martin, to the New York Bankers Association on 19th October 1955:-

If we fail to apply the brakes sufficiently and in time, of course, we shall go over the cliff. If businessmen, bankers, your contemporaries in the business and financial world, stay on the sidelines, concerned only with making profits, letting the Government bear all of the responsibility and the burden of guidance of the economy, we shall surely fail. … In the field of monetary and credit policy, precautionary action to prevent inflationary excesses is bound to have some onerous effects–if it did not it would be ineffective and futile. Those who have the task of making such policy don’t expect you to applaud. The Federal Reserve, as one writer put it, after the recent increase in the discount rate, is in the position of the chaperone who has ordered the punch bowl removed just when the party was really warming up.

Back in the October 1955 the Discount rate was 2.30% and the 10yr yield was 2.88%. The economy had just emerged from a recession and would not embark on its next downturn until mid-1957.

Today the US yield curve is also unusually flat, especially by comparison with the inflationary era of the 1970’s, 1980’s and 1990’s. In some ways, however, (barring the inflationary blip in 1951-52) it looks similar to the 1950’s. Here is a chart showing the 10yr yield (blue – LHS) and US inflation (dotted – RHS):-

US Inflation and 10yr bond yield 1950 to 1973

Source: Trading Economics

I believe that in order to protect the asset markets (by which I mean, principally, stocks and real estate) the Federal Reserve (charged as it is with the twin, but not mutually exclusive, objectives of full-employment and stable prices) may decide to focus on economic growth and domestic harmony at the expense of a modicum of, above target, inflation. When Fed Chairman, Martin, talked of removing the punch bowl back in 1955, inflation had already subsided from nearly 10% – mild deflation was actually working its way through the US economy.

Central Bank balance sheets

Today there are several profound differences with the 1950’s, not least, the percentage of the US bond market which is held by Central Banks. As the chart below shows, Central Banks balance sheet expansion continues, at least, at the global level: it now stands at $14.6trn:-

CB_Balance_Sheets_-_Yardeni

Source: Haver Analytics, Yardeni Research

Like the Fed, the BoJ and ECB have been purchasing their own obligations, by contrast the PBoC’s modus operandi is rather different. The largest holders of US public debt (principally T-Bonds and T-Bills) are foreign institutions. Here is the breakdown as at the end of 2016:-

US_debt_ownership_Dec_2016

Source: US Treasury

As of November 2017 China has the largest holding of US debt – US$1.2trn (a combination of the PBoC and state owned enterprises), followed by Japan -US$1.1trn, made up of both private and public pension fund investments. It is not in the interests of China or Japan to allow a collapse in the US bond market, nor is it in the interests of the US government; their ability borrow at historically low yields during the last few years has not encouraged the national debt to decline, nor the budget to balance.

Bond Markets in Europe and Japan

The BoJ continues its policy of yield curve control – targeting a 10bp yield on 10yr JGBs. Its balance sheet now stands at US$4.8trn, slightly behind the ECB and PBoC which are vying for supremacy mustering US$5.5trn apiece. Thanks to the persistence of the BoJ, JGB yields have remained between zero and 10bp since November 2016. As of December 2017 the BoJ owned 46.2% of the total issuance. The ECB, by contrast, holds a mere 19.2% of Eurozone debt.

Another feature of the Eurozone bond market, during the last couple of years, has been the continued convergence in yields between the core and periphery. The chart below shows the evolution of the yield of 10yr Greek Government Bonds (LHS) and German Bunds (RHS). The spread is now at almost its lowest level ever. This may be a reflection of the improved performance of the Greek economy but it is more likely to be driven by fixed income investors continued quest for yield:-

Germany vs Greece 10yr yields

Source: Trading Economics

By contrast with Greece (where yields have fallen) and Germany (where they are on the rise) 10yr Italian BTPs and Spanish Bonos have remained broadly unchanged, whilst French OATs have seen yields rise in sympathy with Germany. Hopes of a Eurobond backed by the EU, to replace the obligations of peripheral nation states, whilst vehemently denied in official circles, appears to remain high.

Japanese and European economic growth, which has surprised on the upside over the past year, needs to prove itself more than purely cyclical. Both regions are reliant on the relative strength of US the economic recovery, together with the continued structural expansion of China and India. The jury is out on whether either Japan or the EU can achieve economic terminal velocity without strong export markets for their goods and services.

The one country in the European area which is behaving differently is the UK; yields have risen but, it stands apart from the rest of the Eurozone; UK Gilts dance to a different tune. Uncertainty about Brexit caused Sterling to decline, especially against the Euro, import prices rose in response, pushing inflation higher. 10yr Gilt yields bottomed in August 2016 at 50bp. Since then they have risen to 1.64% – this is still some distance from the highs of January 2014 when they tested 3.09%. 2yr Gilts are different matter, with a current yield of 71bp they are 63bp from their lows but just 22bp away from the 2014 high of 93bp.

Conclusions and Investment Opportunities

From a personal investment perspective, I have been out of the bond markets since 2013. My reasoning (which proved expensive) was that the real-yields on the majority of markets was already extremely negative and the notional yields were uncomfortably close to zero. Of course these markets went much, much further than I had anticipated. Now I am tempted by the idea of reallocating, despite yields being lower than they were when I exited previously. Inflation in the US is 2.1%, in the Euro Area it is 1.3% whilst in Japan it is still just 1%.

As a defensive investment one should look for short duration bonds, but in the US this brings the investor into conflict with the hawkish policy stance of the Fed; that is, what my friend Ben Hunt of Epsilon Theory dubs, the Inflation Narrative. For a contrary view this Kansas City Fed paper may be of interest – Has the Anchoring of Inflation Expectations Changed in the United States during the Past Decade?

In Japan yields are still too near the zero bound to be enticing. In Germany you need to need to go all the way out to 6yr maturity Bunds before you receive a positive yield. There is an alternative to consider – 2yr Gilts:-

united-kingdom-2-year-note-yield - 5yr

Source: Trading Economics

UK inflation is running at 3% – that puts it well above the BoE target of 2%. Rate increases are anticipated. 2yr Gilt yields have recently followed the course steered by the US and Germany, taking out the highs last seen in December 2015, however, if (although I really mean when) a substantial stock market correction occurs, 2yr Gilt yields have the attraction of being near the top of their five year range – unlike 2yr Schatz which are nearer the bottom of theirs. 2yr Gilts will benefit from a slowdown in Europe and any uncertainty surrounding Brexit. The BoE will be caught between the need to quell inflation and the needs of the economy as a whole. 2yr Gilts also offer the best roll-down on the UK yield curve. The 1yr maturity yields 49bp, whilst the 3yr yields 83bp.

With inflation fears are on the rise, especially in the US and UK, 2yr Gilts make for an uncomfortable investment today, however, they are a serious contender as a safe place to hide, come the real stock market correction.

Can a multi-speed European Union evolve?

Can a multi-speed European Union evolve?

400dpiLogo

Macro Letter – No 73 – 24-03-2017

Can a multi-speed European Union evolve?

  • An EC white paper on the future of Europe was released at the beginning of the month
  • A multi-speed approach to EU integration is now considered realistic
  • Will a “leaders and laggards” approach to further integration work?
  • Will progress on integration enable the ECB to finally taper its QE?

At the Malta Summit last month German Chancellor Angela Merkel told reporters:-

We certainly learned from the history of the last years, that there will be as well a European Union with different speeds that not all will participate every time in all steps of integration.

On March 1st the European Commission released a white paper entitled the Future of Europe. This is a discussion document for debate next week, when members of the EU gather in Rome to celebrate the 60th anniversary of the signing of the Treaty of Rome.

The White Paper sets out five scenarios for the potential state of the Union by 2025:-

Scenario 1: Carrying On – The EU27 focuses on delivering its positive reform agenda in the spirit of the Commission’s New Start for Europe from 2014 and of the Bratislava Declaration agreed by all 27 Member States in 2016. By 2025 this could mean: Europeans can drive automated and connected cars but can encounter problems when crossing borders as some legal and technical obstacles persist. Europeans mostly travel across borders without having to stop for checks. Reinforced security controls mean having to arrive at airports and train stations well in advance of departure.

Scenario 2: Nothing but the Single Market – The EU27 is gradually re-centred on the single market as the 27 Member States are not able to find common ground on an increasing number of policy areas. By 2025 this could mean: Crossing borders for business or tourism becomes difficult due to regular checks. Finding a job abroad is harder and the transfer of pension rights to another country not guaranteed. Those falling ill abroad face expensive medical bills. Europeans are reluctant to use connected cars due to the absence of EU-wide rules and technical standards.

Scenario 3: Those Who Want More Do More – The EU27 proceeds as today but allows willing Member States to do more together in specific areas such as defence, internal security or social matters. One or several “coalitions of the willing” emerge. By 2025 this could mean that: 15 Member States set up a police and magistrates corps to tackle cross-border criminal activities. Security information is immediately exchanged as national databases are fully interconnected. Connected cars are used widely in 12 Member States which have agreed to harmonise their liability rules and technical standards.

Scenario 4: Doing Less More Efficiently – The EU27 focuses on delivering more and faster in selected policy areas, while doing less where it is perceived not to have an added value. Attention and limited resources are focused on selected policy areas. By 2025 this could mean A European Telecoms Authority will have the power to free up frequencies for cross-border communication services, such as the ones used by connected cars. It will also protect the rights of mobile and Internet users wherever they are in the EU.A new European Counter-terrorism Agency helps to deter and prevent serious attacks through a systematic tracking and flagging of suspects.

Scenario 5: Doing Much More Together – Member States decide to share more power, resources and decision-making across the board. Decisions are agreed faster at European level and rapidly enforced. By 2025 this could mean: Europeans who want to complain about a proposed EU funded wind turbine project in their local area cannot reach the responsible authority as they are told to contact the competent European authorities. Connected cars drive seamlessly across Europe as clear EU-wide rules exist. Drivers can rely on an EU agency to enforce the rules.

There is not much sign of a multi-speed approach in the above and yet, on 6th March the leaders of Germany, France, Italy and Spain convened in Versailles where they jointly expressed the opinion that allowing the EU to integrate at different speeds would re-establish confidence among citizens in the value of collective European action.

There are a couple of “general instruments”, contained in existing treaties, which give states some flexibility; ECFR – How The EU Can Bend Without Breaking suggests “Enhanced Cooperation” and “Permanent Structured Cooperation”(PESCO) as examples, emphasis mine:-

Enhanced cooperation was devised with the Amsterdam Treaty…in 1997, and revised in successive treaty reforms in Nice and Lisbon. Enhanced cooperation is stipulated as a procedure whereby a minimum of nine EU countries are allowed to establish advanced cooperation within the EU structures. The framework for the application of enhanced cooperation is rigid: It is only allowed as a means of last resort, not to be applied within exclusive competencies of the union. It needs to: respect the institutional framework of the EU (with a strong role for the European Commission in particular); support the aim of an ever-closer union; be open to all EU countries in principle; and not harm the single market. In this straitjacket, enhanced cooperation has so far been used in the fairly technical areas of divorce law and patents, and property regimes for international couples. Enhanced cooperation on a financial transaction tax has been in development since 2011, but the ten countries cooperating on this have struggled to come to a final agreement.

PESCO allows a core group of member states to make binding commitments to each other on security and defence, with a more resilient military and security architecture as its aim. It was originally initiated at the European Convention in 2003 to be part of the envisaged European Defence Union. At the time, this group would have consisted of France, Germany, and the United Kingdom. After disagreements on defence spending in this group and the referendum defeat for the European Constitution which meant the end of the Defence Union, a revised version of PESCO was added into the Lisbon treaty. This revised version allows for more space for the member states to decide on the binding commitments, which of them form the group, and the level of investment. However, because of its history, some member states still regard it as a top-down process which lacks clarity about how the groups and criteria are established. So far, PESCO has not been used, but it has recently been put back on the agenda by a group of EU member states.

These do not get the EU very far, but the ECFR go on to mention an additional Schengen-style approach, where international treaties of EU members can be concluded outside of the EU framework. These treaties can later be adopted by other EU members.

As part of their research the ECFR carried out more than 100 interviews with government officials and experts at universities and think-tanks across the 28 member states to discover their motivation for adopting a more flexible approach. The chart below shows the outcomes:-

ECFR FutureEU_MotiviationFlexibility

Source: ECFR

Interestingly, in two countries, Denmark and Greece, officials and experts believe that more flexibility will result in greater fragmentation. Nonetheless, officials and experts in Croatia, Finland, Germany, Italy, Latvia, and Spain are in favour of embracing a more flexible approach. Benelux and France remain sceptical. Here is how the map of Europe looks to the ECFR:-

ECFR206_THE_FUTURE_SHAPE_OF_EUROPE_-_CountryMap

Source: ECFR

The timeline for action is likely to be gradual. President Juncker’s plans to develop the ideas contained in the white paper in his State of the Union speech in September. The first policy proposals may be drafted in time for the European Council meeting in December. It is envisaged that an agreed course of action will be rolled out in time for the European Parliament elections in June 2019.

Can Europe wait?

Two years is not that long a time in European politics but financial markets may lack such patience. Here is the Greek government debt repayment schedule prior to the European Parliament Elections:-

Greece_-_Repayment_Schedule_-_WSJ

Source: Wall Street Journal

This five year chart shows the steady rise in total Greek government debt:-

greece-government-debt

Source: Tradingeconomics, Bank of Greece

Greek debt totalled Eur 326bln in Q4 2016, the debt to GDP ratio for 2015 was 177%. Italy’s debt to GDP was a mere 133% over the same period.

ECB dilemma

The ECB would almost certainly like to taper its quantitative easing, especially in light of the current tightening by the US. It reduced its monthly purchases from Eur 80bln per month to Eur 60bln in December but financial markets only permitted Mr Draghi to escape unscathed because he extended the duration of the programme from March to December 2017. Further reductions in purchases may cause European government bond spreads to diverge dramatically. Since the beginning of the year 10yr BTPs have moved from 166bp over 10yr German Bunds to 2.11% – this spread has more than doubled since January 2016. The chart below shows the evolution of Eurozone long-term interest rates between October 2009 and November 2016:-

Long-term_interest_rates_(eurozone) Oct 09 to Nov 16 - ECB

Source: ECB

In 2011 the Euro Area debt to GDP ratio was 86%, by 2015 it had reached 91%. The table below shows the highest 10yr yield since the great financial crisis for a selection of Eurozone government bonds together with their ratios of debt to GDP. It goes on to show the same ratio at the end of 2015. Only Germany is in a stronger position today than it was during the Eurozone crisis in terms of its debt as a percentage of its GDP:-

Bond_yields_and_debt_to_GDP (1)

Source: Trading Economics

Since these countries bond markets hit their yield highs during the Eurozone Crisis, Greece, Italy and Spain have seen an improvement in GDP growth, but only Spain is likely to achieve sufficient growth to reduce its debt burden. If the ECB is to cease killing the proverbial fatted calf, a less profligate fiscal approach is required.

Euro Area GDP averaged slightly less than 1.8% per annum over the last two years, yet the debt to GDP ratio only declined a little over 1% from its all-time high. Further European integration sounds excellent in theory but in practice any positive impact on economic growth is unlikely to be evident for several years.

EU integration has been moving at different speeds for years, if anything, the process has been held back by attempts to move in unison. There are risks of causing fragmentation with both approaches, either within countries or between them.

Conclusions and Investment Opportunities

Another Eurozone financial crisis cannot be ruled out this year. The political uncertainty of the Netherlands is past, but France may yet surprise. Once Germany has voted in September, it will be time to focus on the endeavours of the ECB. Their asset purchase programme is scheduled to end in December.

I would expect this programme to be extended once more, if not, the stresses which nearly tore the Eurozone asunder in 2011/2012 are likely to return. The fiscal position of the Euro Area is only slightly worse than it was five years ago, but, having flirted with the lowest yields ever recorded, bond markets have considerably further to fall in percentage terms than in during the previous crisis.

Spanish 10yr Bonos represents a better prospect than Italian 10yr BTPs, but one would have to endure negative carry to set up this spread trade: look for opportunities if the spread narrows towards zero. German Bunds are always likely to act as the safe haven in a crisis and their yields have risen substantially in the past year, yet at less than ½% they are 300bp below their “safe-haven” level of April 2011.

The Euro is unlikely to rally in this environment. The chart below shows the Euro Effective Exchange Rate since 2005:-

Euro_Effective_Exchange_Rate_-_ECB (1)

Source: ECB

The all-time low for the Euro is 82.34 which was the level is plumbed back in October 2000. This does sound an outlandish target during the next debacle.

Euro weakness would, however, be supportive for export oriented European stocks. The weakness that stocks would initially suffer, as a result of the return of the Euro crisis, would quickly be reversed, in much the same manner that UK stocks were pummelled on the initial Brexit result only to rebound.