During the last three months inflation has become a much debated topic. This article, which was published in March, may still add something to the increasingly heated debate: –
Inflationary Inflection Point or Temporary Blip?


During the last three months inflation has become a much debated topic. This article, which was published in March, may still add something to the increasingly heated debate: –
Inflationary Inflection Point or Temporary Blip?

Macro Letter – No 139 – 18-06-2021
Commodities, Supply-chains and Structural Changes in Demand
As the spectre of inflation begins to haunt economists, many market commentators have started to focus on commodity prices in an attempt to predict the likely direction of the general price level for goods and services. This indexing of the most heterogeneous asset class has always struck me as destined to disappoint. Commodity prices change in response to, often, small variation in supply or demand and the price of some commodities varies enormously from one geographic location to another. Occasionally the majority of commodities rise in tandem but more frequently they dance to their own peculiar tunes.
Commodity analysts tend to focus on Energy and Industrial Metals foremost; Agricultural Commodities, which are more diverse by nature are often left as a footnote. Occasionally, however, a demand-side event occurs which causes nearly all sectors to rise. The Covid-19 event was just such a shock, disrupting global supply-chains and consumer demand patterns simultaneously.
The chart below shows the CRB Index since 1995: –
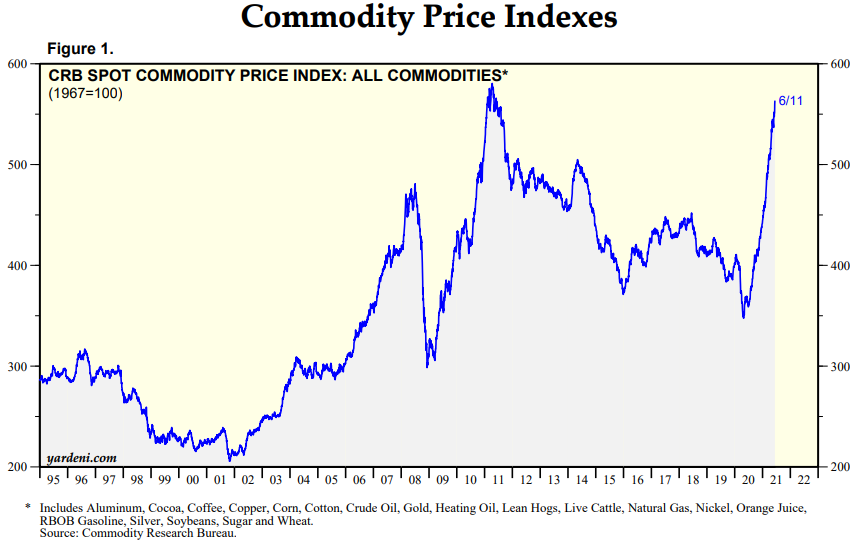
Source: CRB, Yardeni
This chart looks very different to the energy heavy GSCI Index, which is weighted on the basis of liquidity and by the respective world production quantities of its underlying components: –

Source: S&P GSCI, Trading Economics
The small rebound on the chart above is not that insignificant, however, it equates to a 55% rise since the lows on 2020. The fact that prices collapsed, as the pandemic broke, and subsequently soared, as vaccines allowed economies to reopen, is hardly surprising. Economic cycles wield a powerful influence over commodity prices; short-term, inelastic, supply, confronted by an unexpected jump in demand, invariably precipitates sharp price increases.
The lockdown which followed the initial outbreak of the virus, led to an abrupt change in consumer demand; hotels and travel were out, remote working was in. Whilst house prices were already supported by a sharp lowering of interest rates and debt forbearance measures, the price of lumber, for home improvements and property extensions, exploded: –
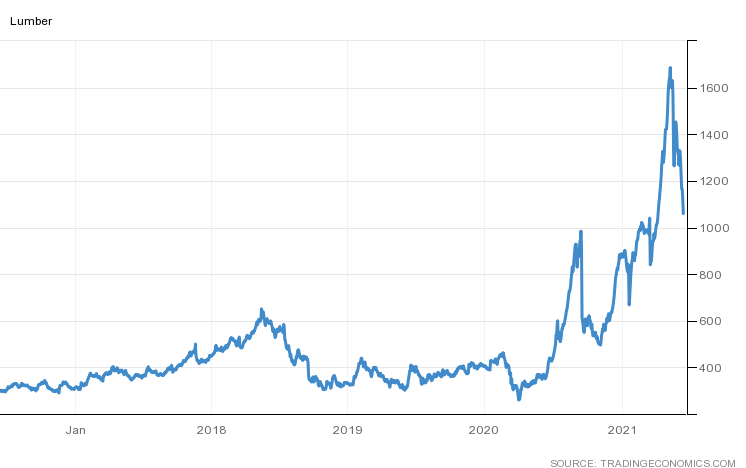
Source: Trading Economics
Similar patterns were evident in Steel and Copper, but also due to shortages and bottlenecks in the semiconductor supply-chain, which led a slowing of automobile production, in turn prompting a rise in the price of both for new and used cars.
The recent resurgence in commodity prices has encouraged suggestions that a new commodity super-cycle is underway, however, these are relatively rare events. The most recent cycle is generally thought to have begun with the rise of Chinese demand in the late 1990’s and ended abruptly with the financial crisis in 2008/2009. Since the crisis Chinese growth has moderated, although the rise of India may see another wave of rapid industrialisation at some point. The chart below, however, portrays a different narrative, suggesting that the 2008 peak was merely a corrective wave from the 1980 peak. The new super-cycle has just begun, it will peak some-time around 2045: –
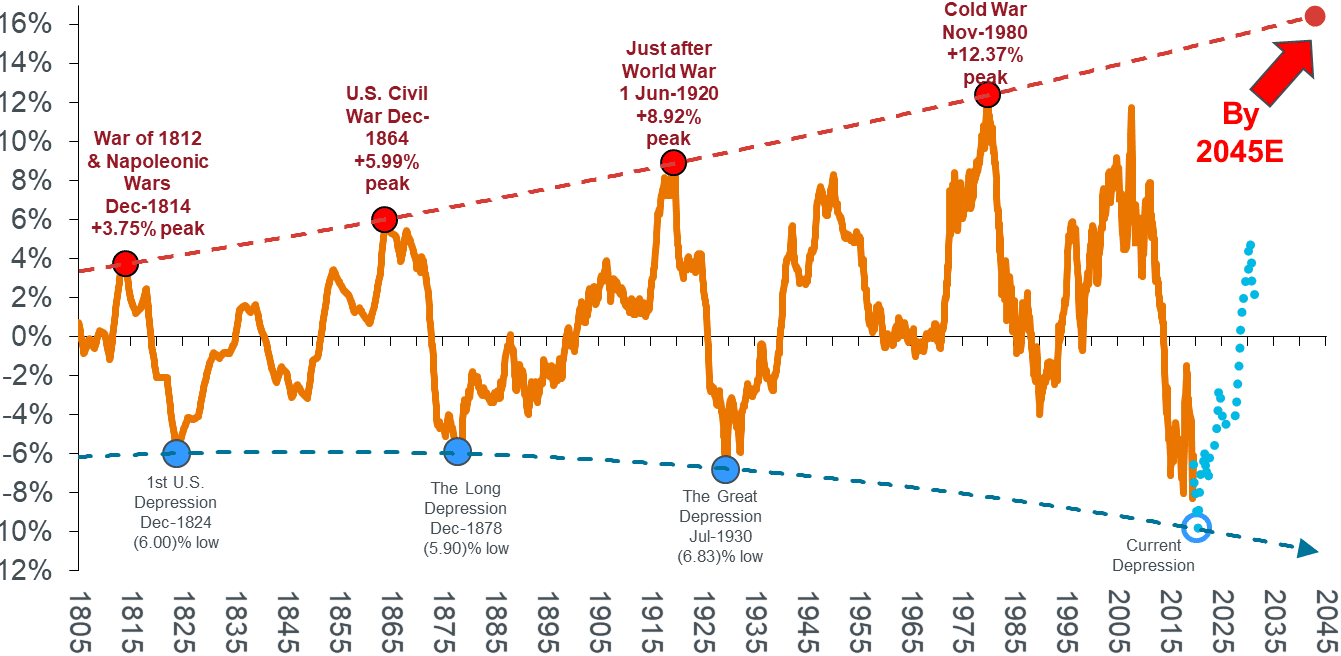
Source: Janus Henderson, Stifel Report June 2020. Note: Shown as 10yr rolling compound growth rate with polynomial trend at tops and bottoms. Blue dotted line illustrates a forecast estimation. Warren & Pearson Commodity Index (1795-1912), WPI Commodities (1913-1925), equal-weighted (1/3rd ea.) PPI Energy, PPI Farm Products and PPI Metals (Ferrous and Non-Ferrous) ex-precious metals (1926-1956), Refinitiv Equal Weight (CCI) Index (1956-1994), and Refinitiv Core Commodity CRB Index (1994 to present).
Another short-term factor, which has exacerbated the rise in the price of key commodities over the past year, is the ongoing trade tensions between the US and China. Tariff increases have increased costs for importers and wholesalers, meanwhile the effect of the Great Financial Crisis has been evident for the past decade in the shortening of global supply-chains. Covid accelerated this de-globalisation, forcing many firms to seek out new sources of supply. The long-run effect of these adjustments will be stronger, deeper supply-chains, but the short-run cost must be paid for by the importer, the producer or the consumer.
A part of the new commodity super-cycle argument is based on more structural factors. The reduction of carbon emissions will entail the use of vast amounts of metals. Electrification calls for copper; silver will be needed for photovoltaic panels; electric vehicles require aluminium, nickel, graphite, cobalt and lithium, together with numerous rare-earth metals – of which China is fast becoming the monopoly supplier.
The last great structural shift in energy was from coal to oil. Colonel Drake’s discovery in Pennsylvania in 1859 and the Spindletop find in Texas in 1901 set the stage for the new oil economy, yet it took until 1919 for gasoline sales to exceed those of kerosene.
Although coal-gas was used for most of the 19th century and the first US natural gas pipeline was built in 1891, prior to the 1920s, the vast majority of natural gas produced as a by-product of oil extraction was simply flared away. Superior welding techniques during the interwar years marked a boom in natural gas adoption, but major pipelines were still under construction as late as the 1960’s.
The time-line from Colonel Drake striking pay-dirt in 1859 to mass natural gas adoption took more than a century. Technology and innovation move at a much faster pace today, yet the infrastructural investment needed to transform from carbon to renewable energy will take decades rather than years.
Meanwhile, there remain shorter-term reasons to doubt the arrival of a new commodity super-cycle so precipitously upon the last. Chinese GDP growth has fallen sharply from the double-digit rates of the last decade. Its working age population is shrinking, added to which the People’s Bank of China seem reluctant to allow credit expansion on the scale of previous cycles. Rebalancing towards domestic consumption continues to be official policy.
There is near-term evidence of energy supply constraints but over the longer-run oil and gas production, especially from the likes of the US frackers, can raise output rapidly in response to increases in the price of Crude. The chart below shows the fluctuations in the Baker Hughes US Oil Rig count over the past decade, no shortage of capacity is apparent here: –

Source: Baker Hughes, Trading Economics
Agricultural commodities tend to operate on even shorter supply cycles. If supply constraints send Wheat prices higher, farmers respond by switching away from Corn. Seasonal adjustments can be rapid.
The GSCI may have hit its lowest since the 1980’s last April and prices may have doubled since then, but it is still more than 75% below its June 2008 peak. Further upside may be seen as the global economy makes up for a year of lost economic growth, but as economic growth returns to normality demand for energy is likely to moderate just as fresh supply comes on stream.
The spending plans of the US administration may maintain demand in the US but China seems determined to nip its domestic credit bubble in the bud. In broad terms these factors counter-balance one another. According to the Federal Reserve, US GDP is forecast to range between 5% and 7.3% in 2021, falling to 2.5% to 4.4% in 2022 and 1.7% to 2.6% in 2023, meanwhile, according to the OECD, Chinese growth will moderate from 8.5% in 2021 to 5.8% in 2022.
Conclusion and Investment Opportunities
Back in January Goldman Sachs predicted a new commodity super-cycle. They see rising wages leading to faster, commodity price positive, home formation and more synchronised social policies, akin to those of 1960s ‘War on Poverty’ campaign. In other respects they believe this cycle has stronger parallels to the 1970s than the 2000s. Goldman expect industrial capex to run at 2000 levels whilst social rebuilding generates a 1970s style consumer boom.
S&P present some of these arguments in a useful infographic: –
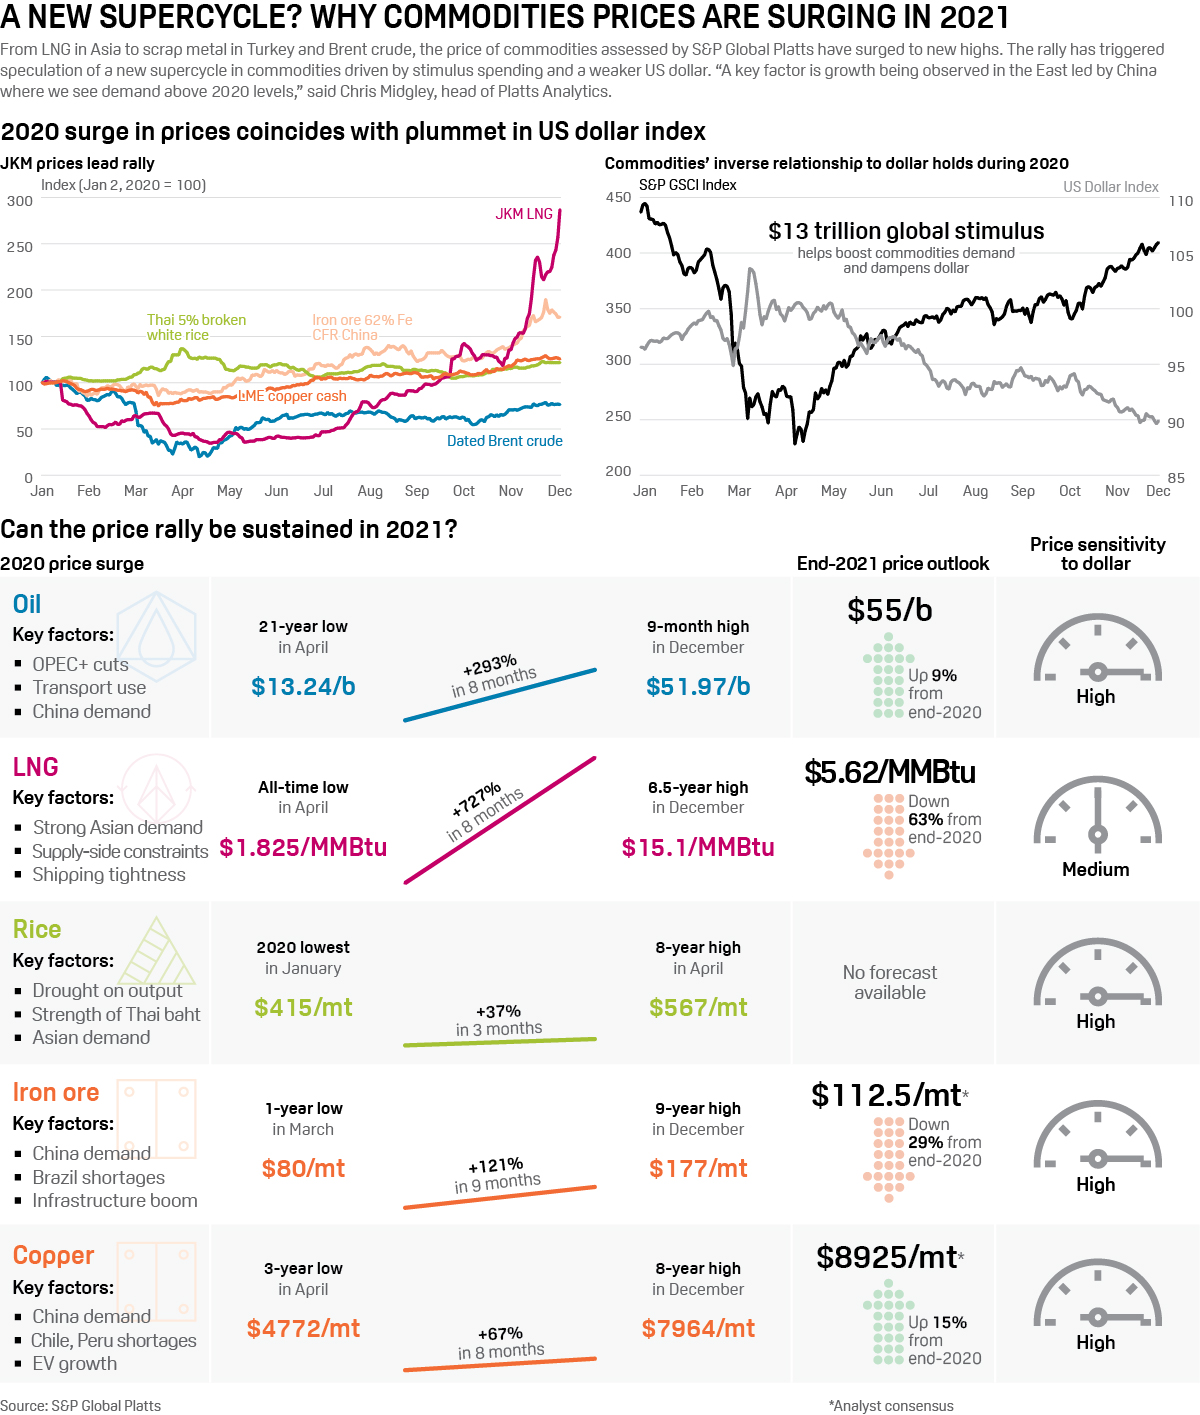
Source: S&P Global
US unemployment has fallen from 11.1% to 5.8% during the last 12 months, even in the harder hit Euro Area it has declined from 8.7% to 8%, whilst Chinese data has followed a similar trajectory, falling from 6.1% to 5% since February 2020. Nonetheless, much of the global economy remains in some form of lockdown, with economic activity fuelled by fiscal spending. It remains difficult to envisage the conditions for a near-term sustainable economic boom. Remove global monetary and fiscal relief and commodity demand will evaporate.
As a general rule, in commodity and financial markets, what goes up price must eventually come back down. The price of US Stud Lumber (chart above) is well off its highs. Governments and their central bankers can attempt to remove the punch-bowl, but the markets are unlikely to take it well.


I published this essay at the end of last year but as Cryptocurrencies and Digital Asset gain further prominence, I take the liberty of sharing once more. Central Bank Digital Currencies will be the next ‘innovation’ but we may see money, traditionally a store of value and a means of exchange, become either one or the other.
Digital Currencies and US Dollar Dominance


Back in June I wrote about the prospects for inflation in the wake of global money supply growth. The deflationary forces of the pandemic and demographic aging still maintain the upper hand for now, but there’s a tug of war which governments need to win if debt is to be inflated away.

Macro Letter No 132 – 04-09-2020
Step-change at the Fed – Reaching for the stars
In a speech entitled – New Economic Challenges and the Fed’s Monetary Policy Review – given on August 27th, at the Jackson Hole, Kansas City Federal Reserve Economic Policy Symposium, Federal Reserve Chairman, Jerome Powell, announced a change in the emphasis of the dual mandate. The new focus is on promoting full-employment even at the expense of price stability.
The policy review was, of course, more nuanced. Past policy decisions were analysed and found wanting – especially the rate increases witnessed between 2015 and 2018. The extraordinary flatness of the Phillips Curve was noted; the lower trend rate of economic growth, contemplated; the stickiness of inflation expectations, contextualised: and the ever rising, pre-pandemic participation rate, considered. What the speech omitted was any discussion of forward guidance or expectations of the change in size, composition or direction of the Fed’s, already historically large, balance sheet.
For financial markets the key change is contained in this paragraph: –
Our statement emphasizes that our actions to achieve both sides of our dual mandate will be most effective if longer-term inflation expectations remain well anchored at 2 percent. However, if inflation runs below 2 percent following economic downturns but never moves above 2 percent even when the economy is strong, then, over time, inflation will average less than 2 percent. Households and businesses will come to expect this result, meaning that inflation expectations would tend to move below our inflation goal and pull realized inflation down. To prevent this outcome and the adverse dynamics that could ensue, our new statement indicates that we will seek to achieve inflation that averages 2 percent over time. Therefore, following periods when inflation has been running below 2 percent, appropriate monetary policy will likely aim to achieve inflation moderately above 2 percent for some time.
The initial market response saw stocks rally whilst 10yr T-bond yields rose – testing 0.79%. During the week which followed, 10yr yields slipped back to 0.62%. Equity markets subsequently switched focus and moved on, returning to their obsession with the ever rising tide of technology stock earnings expectations. Even the Dow Jones Industrials Average Index has been effected by the tech boom, as reported by S&P – Dow Jones Industrial Average: 124 Years and It Keeps Changing – the index changes, announced on August 31st included, Salesforce.com (CRM) replacing Exxon Mobil (XOM), Amgen (AMGN) replacing Pfizer (PFE), and a tech switch with Honeywell International (HON) replacing Raytheon Technologies (RTX).
Returning to monetary policy, the Fed announcement was hardly a surprise, the August 10th, FRBSF Economic Letter – Average-Inflation Targeting and the Effective Lower Bound had already set the tone. The chart below reveals the Fed’s inflation targeting dilemma: –
Source: FRBSF
If the average for Total PCE over the last decade has been less than 1.5%, allowing it to rise above 3% for a few years is just what is needed for the Fed to get back on track.
Setting aside the vexed questions of whether an Inflation Target is appropriate or, deflation, a good or bad phenomenon, we need to investigate the structural cause of the decline in inflation. Here I will resort to the monetary equation of exchange: –
MV = PQ
Where: –
M is the total nominal amount of money supply in circulation on average in an economy.
V is the velocity of money, or the average frequency with which a unit of money is spent.
P is the price level.
Q is an index of real expenditures for newly produced goods and services.
The basic problem for the Fed is that, despite their success in expanding money supply (see below): –
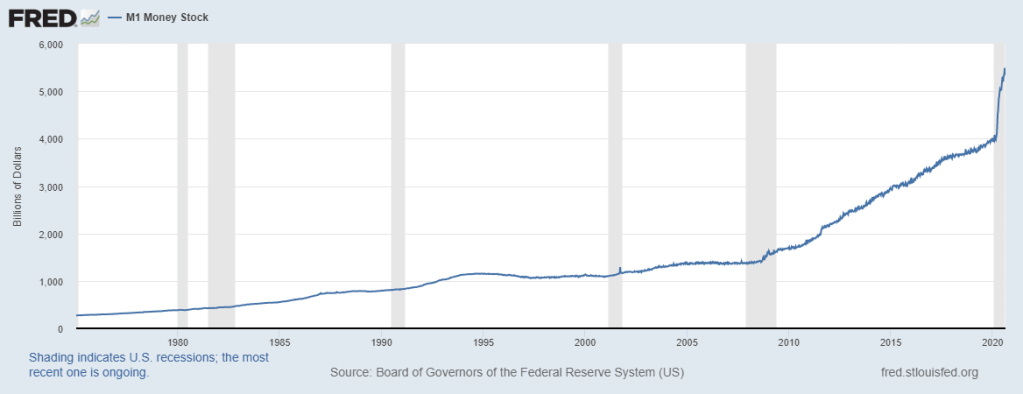
Source: Federal Reserve Bank of St Louis
The velocity of circulation has continued to plummet: –
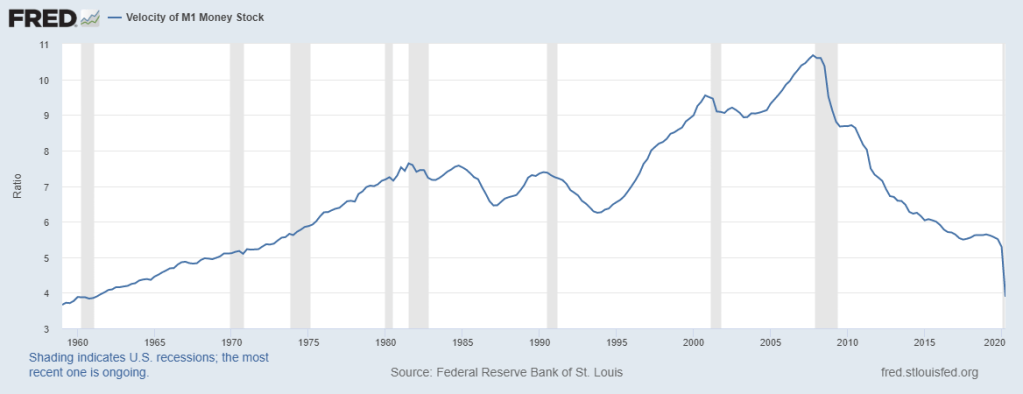
Source: Federal Reserve Bank of St Louis
I discussed the rapid expansion of money supply in more detail in a June article for AIER – Global Money Supply Growth and the Great Inflation Getaway: –
I suspect, fearful of repeating the mistakes made by the Bank of Japan, that once the inflation genie is finally out of the bottle, central bankers will forsake the hard-learned lessons of the 1970’s and 1980’s and allow inflation to conjure away the fiscal deficits of their governments at the expense of pensioners and other long-term investors.
Of course, consumer price inflation may not return, even with such egregious debasement as we have seen thus far, as Michel Santi suggests in Japan: a sleeping beauty: –
A global battle has thus been raging on pretty much since the deflationary episodes of the 2010s in an attempt to relaunch economies by dint of inflation. In this respect, the Japanese experiment, or rather multiple experiments, remains a case study to show that inflation is still proving a difficult spectre to revive.
Santi, points to demographic decline, a trend in which Japan is a world leader, together with, what he considers to be, an irrational fear of debt and deficits, which renders people unwilling to spend. In this scenario, government, corporate and consumer debt cannot be inflated away and sits like a giant toad atop all the animal spirits that might reignite economic growth. He also alludes to the profound changes in the nature of work – from permanent to temporary, from employed to self-employed, from office based to remote. These changes have rendered the Phillips Curve redundant.
The dual mandate of full employment and price stability has never been so easy for the Federal Reserve to achieve. That, at least, was the case until the global pandemic unknit the fabric of the global market economy. Now, the Federal Reserve – and central bankers in general – are faced with the prospect that printed money, whether it be sterilised or not, will either be invested or hoarded. In this scenario, the greater the debt the less likely prices are to rise as a result of demand-pull inflation. On the opposite side of the inflation equation, the shortening of global supply chains and the need for dual-redundancy, agin another unwelcome and unexpected lockdown, has created the classic bottlenecks which lead to product scarcity, personified in cost-push inflation.
Interest Rates, Global Value Chains and Bank Reserve Requirements– published in June of last year, notes that Global Value Chains have suffered and shortened since 2009; that, despite low interest rates, financing costs remain too high and yet, at the same time, bank profitability has not recovered from the damage caused by the great financial recession. Nonetheless, those same banks, which were supposed to have been broken up or dramatically deleveraged, remain still too big to fail. My conclusion looks dismally prescient: –
The logical solution to the problem of the collapse of global value chains is to create an environment in which the credit cycle fluctuates less violently. A gradual normalisation of interest rates is the first step towards redemption. This could be accompanied by the removal of the moral hazard of central bank and government intervention. The reality? The societal pain of such a gargantuan adjustment would be protracted. It would be political suicide for any democratically elected government to commit to such a meaningful rebalancing. The alternative? More of the same. Come the next crisis central banks will intervene, if they fail to avert disaster, governments’ will resort to the fiscal spigot.
US interest rates will converge towards those of Europe and Japan. Higher stock/earnings multiples will be sustainable, leverage will increase, share buy-backs will continue: and the trend rate of economic growth will decline. Economics maybe the dismal science, but this gloomy economic prognosis will be quite marvellous for assets.
Conclusion and Investment Opportunities
According to data from S&P, US share buybacks were lower for the second quarter in a row in Q2, 2020. They amounted to $166bln, versus $205bln in Q1 and $190bln in Q2, 2019 – this is still the seventh highest quarterly amount ever recorded. The chart below shows the evolution of buybacks over the last two decades: –
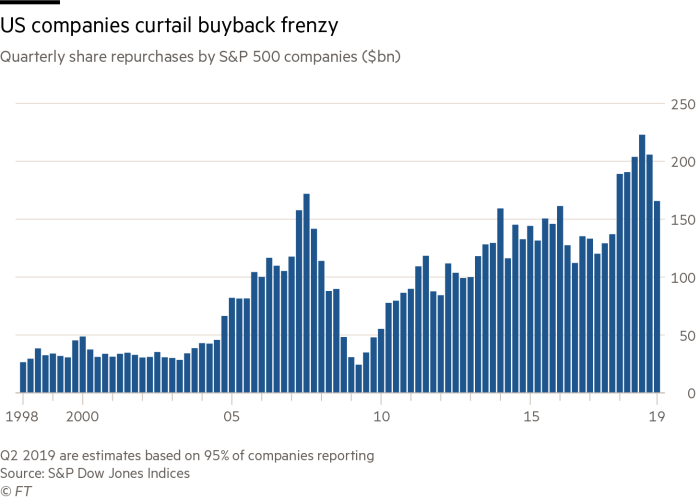
Source: S&P, FT
The consolidation of the US equity market continues – from a high of 7,562 on July 31, 1998, the Wilshire 5000 Index list of constituents has shrunk to just 3,473 names. This is a side effect of the fact that debt finance remains cheaper than equity finance. According to a recent article published by the Financial Times – US corporate bond issuance hits $1.919tn in 2020, beating full-year record corporate issuers have raised more capital in the first eight months of 2020 than in any previous full year. Low rates going to no rates, thanks to the actions of the Fed, is said to have driven this step-change in activity. The reticence of commercial banks to extend finance, despite the favourable interest rate and liquidity environment, is a contributing factor: –
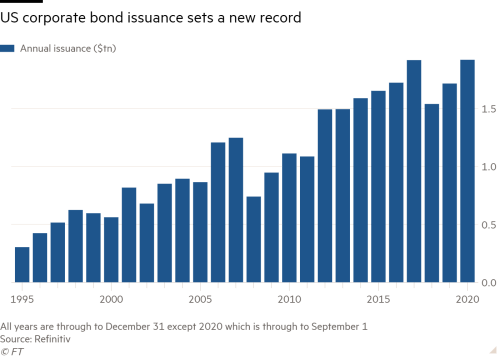
Source: Refinitiv, FT
The Covid pandemic has accelerated many of the economic and financial market trends which have been in train since the end of the 2008/2009 financial crisis. Lower interest rates, more quantitative easing, further share buy-backs and greater debt issuance – by borrowers’ individual, corporate and national – look set to continue.
A global economic depression is looming, yet the price of many assets continues to rise. In a similar manner to the Tech bubble of the late 1990’s, today’s valuations rely more on the willing suspension of disbelief than on any sober assessment of earnings potential. The US stock market has outperformed partly due to the high proportion of technology stocks, as the chart below (from May) shows: –
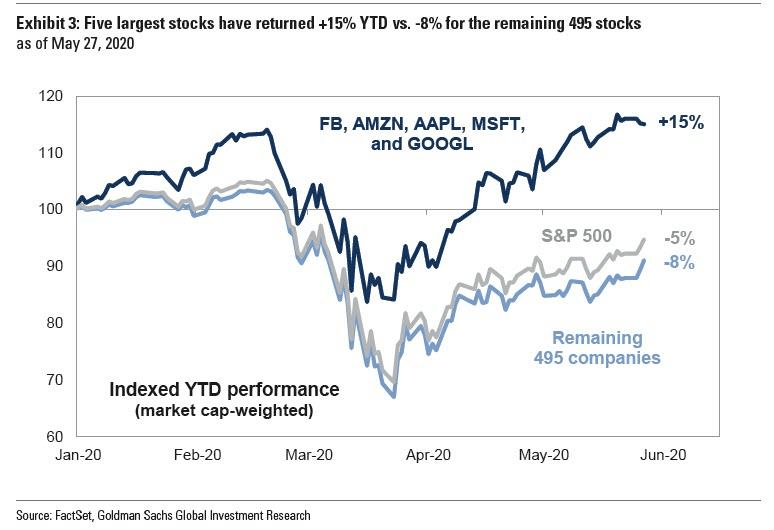
Source: FactSet, Goldman Sachs
The magnitude of this fiscal and monetary response has already reached far beyond the United States. The table below shows those national stock markets with a positive year to date performance exceeding 5%: –
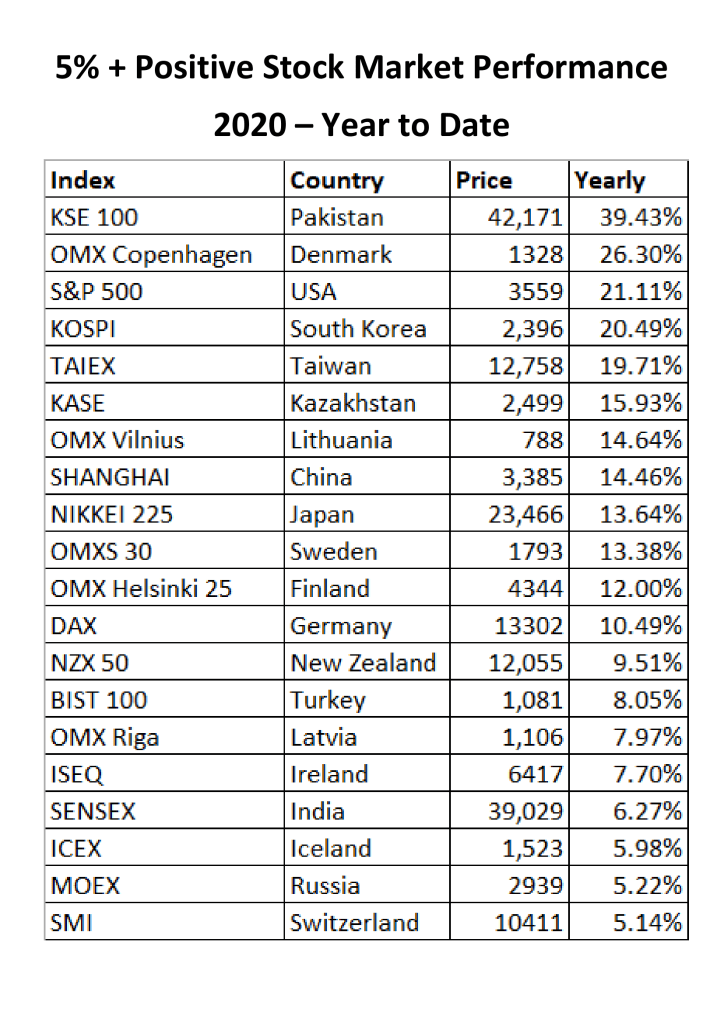
Source: Trading Economics, Local Stock Exchanges
I have deliberately excluded the Nasdaq 100 which is currently up more than 57%. Other countries will catch up. The US$ has weakened, since February, on a trade weighted basis: –
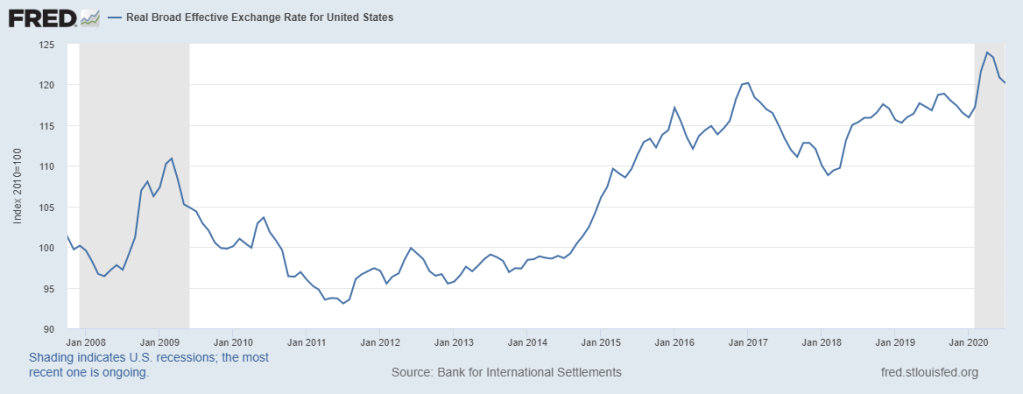
Source: BIS, Federal Reserve Bank of St Louis
In a competitive race to the bottom, other central banks (and their governments) will expand monetary (and fiscal) policy to stop their currencies appreciating too fast.
Global bond yield convergence will continue, stock market strength will endure. Inflation will creep into consumer prices gradually and the central banks will turn a blind eye until it is too late. The world economy may be on its knees but, in general, asset prices will continue to reach for the stars.

![]()
Macro Letter – No 124 – 20-12-2019
The Beginning of the End of Uncertainty for the UK
For traders and investors in financial markets, risk and reward are two sides of a single coin. There are, of course, exceptions and geopolitical risk is one of them. The difficulty with geopolitical risk is that it is really geopolitical uncertainty. As Frank Knight observed back in 1921 in Risk, Uncertainty and Profit – risk is can be measured and forecast, uncertainty, cannot: –
Uncertainty must be taken in a sense radically distinct from the familiar notion of Risk, from which it has never been properly separated…. The essential fact is that ‘risk’ means in some cases a quantity susceptible of measurement, while at other times it is something distinctly not of this character; and there are far-reaching and crucial differences in the bearings of the phenomena depending on which of the two is really present and operating…. It will appear that a measurable uncertainty, or ‘risk’ proper, as we shall use the term, is so far different from an unmeasurable one that it is not in effect an uncertainty at all.
I have kept this in mind throughout my investing career and it is for this reason that I have avoided investing in the UK stock market since the Brexit referendum. The uncertainty surrounding Brexit has not disappeared, but I now have sufficient confidence in the decisiveness of the incumbent administration to believe that progress can at last be made. To judge by the immediate reaction of financial markets in the wake of the UK election result, I am not alone in my optimism.
To begin, here is a chart of G7 GDP since Q2 2016: –
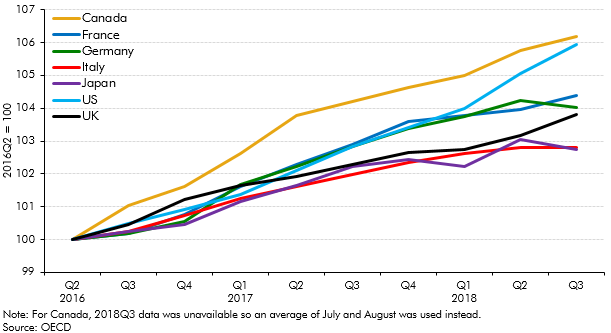
Source: OECD
The UK has fared better than Japan and Italy but its momentum has diminished relative to the remainder of G7.
A more nuanced view of the relative underperformance of the UK is revealed by comparison with Eurozone growth. The chart below, which starts in 2014, shows the switch from UK outperformance to underperformance which began even before the Brexit referendum in mid-2016: –

Source: Eurostat, Full Fact
Whilst there are many factors which have contributed to this change in the UK growth rate, the principal factor has been uncertainty relating to Brexit.
Of course, the direct impact of the Brexit referendum was felt by Sterling. The chart below shows the (Trade-weighted) Sterling Effective Exchange Rate since 2016: –
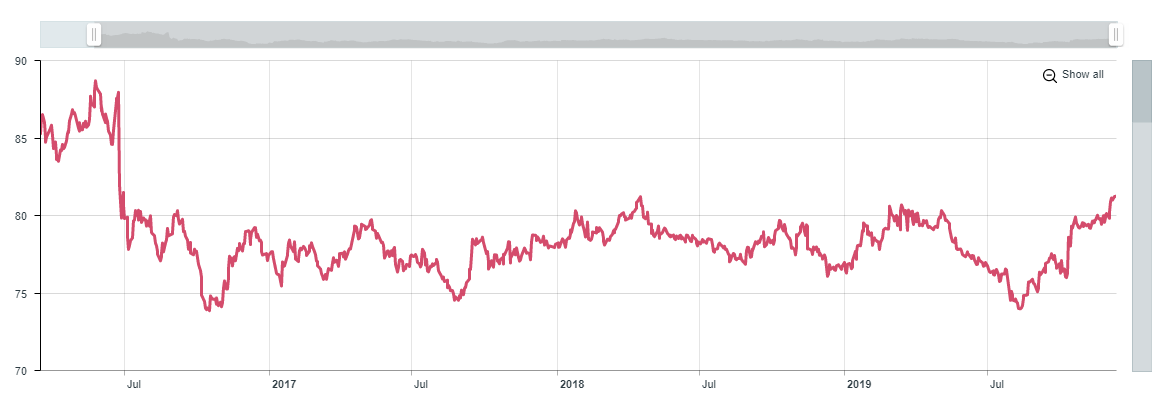
Source: Bank of England
The rise since August 2019 appears to predict the outcome of the election, but the currency still has far to rise if it is to return to pre-financial crisis levels, as this 20 year chart reveals: –
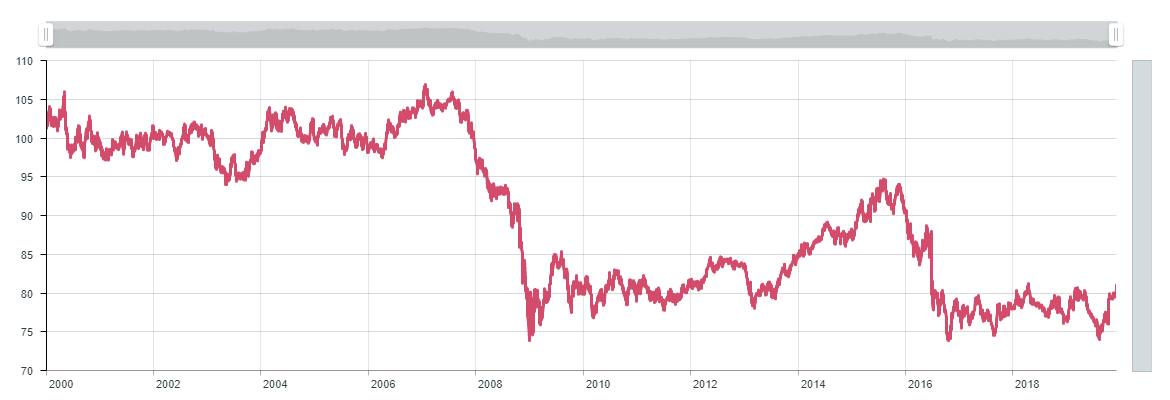
Source: Bank of England
The strong upward momentum which began in 2012 was swiftly terminated by the political morass which culminated in the UK referendum. The unexpected outcome of the 2016 Brexit vote only served to exacerbate the malaise.
The weakness of Sterling merely accelerated the deterioration in the UK terms of trade. The UK has run a continuous trade deficit since 1998 but, as the chart below reveals, the deficit has become structural: –
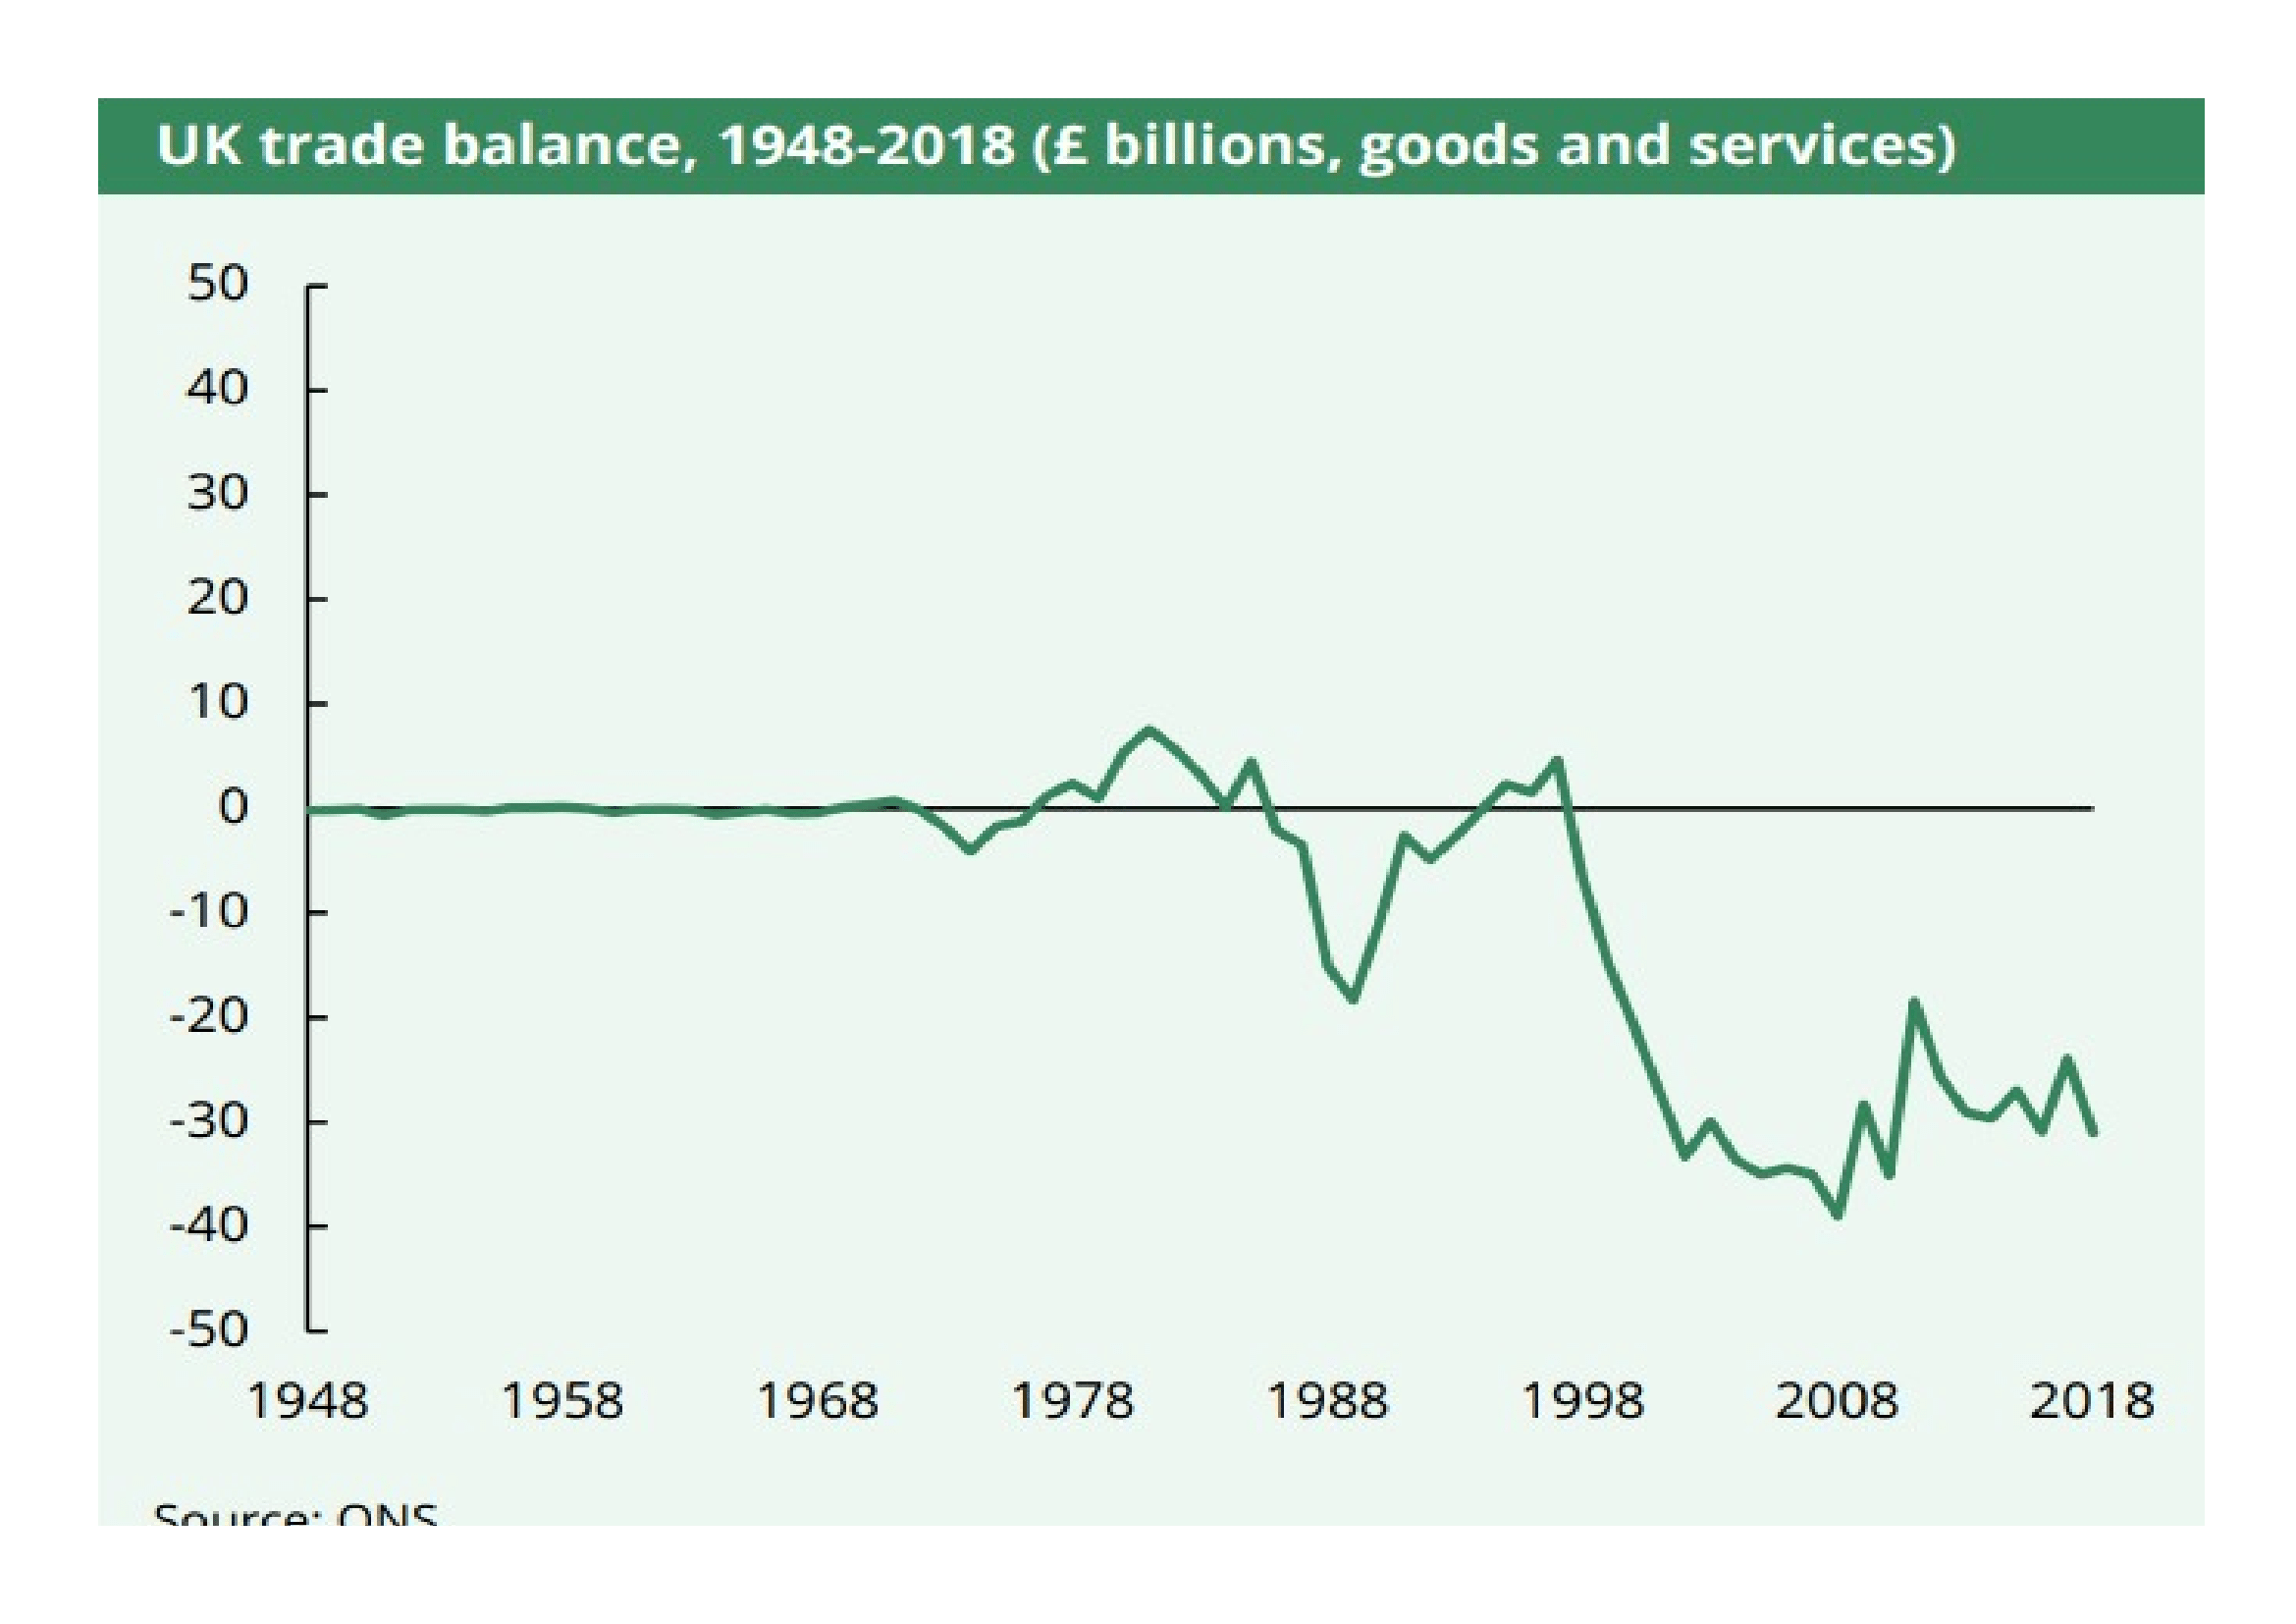
Source: ONS
Any significant imbalance in trade makes an economy sensitive to changes in the value of its currency. The fall in Sterling since 2016 has had a knock on effect on the rate of UK inflation: –
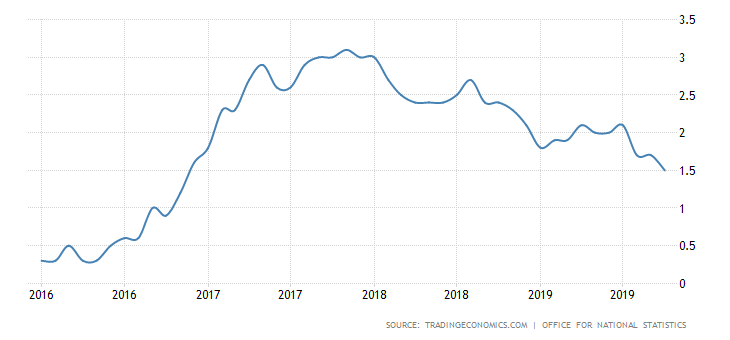
Source: ONS, Trading Economics
Viewed from a 10 year perspective, the reversal is even more pronounced. UK interest rates would probably have been substantially lower during the last four years had it not been for the uncertainty surrounding Brexit: –
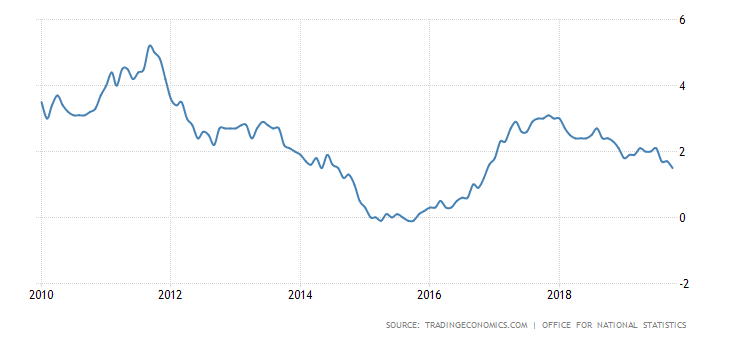
Source: ONS, Trading Economics
Is optimism now justified?
Aside from the trade balance, the charts above are a reflection of the discount financial markets have imposed on the UK. This month’s election justifies a rerating. Whilst the markets have not been overly enamoured with the latest Tory Brexit deal they have been craving certainty. A working majority of 80 allows room for any Conservative dissenters to be quashed. Then there is the ‘Corbyn Factor.’ Promises of widespread nationalisation, without clarity about the price with which private investors would be compensated, did not sit well. Neither did the proposed tax increases required to fuel the £80bln increase in fiscal spending. That threat has now passed.
Finally there was clarification of the nation’s opinion on Brexit itself. Labour lost ground almost everywhere; to Tories and the Brexit party in England and Wales, whilst in Scotland they ceded ground to the SNP.
This summation of the UK situation is an over-simplification, but from a financial market perspective the UK political landscape has improved. Suffice to say, there remain many challenges ahead, not least the Brexit transition period (end 2020) during which a free-trade agreement (FTA) needs to be agreed to avert unnecessary trade disruption. After four years, one might hope there has been behind the scenes preparation and that much of the deal will be a slight amendment to current access arrangements. In reality to complete a deal by year-end 2020 it will have to be an ‘FTA-lite’ affair, which may prove less than satisfactory. A swift trade deal should, nonetheless, reduce uncertainty which is also in the interests of the EU. I remain sceptical, there may be many a slip twixt cup and lip.
Conclusions and Investment Opportunities
Four years of deferred investment and consumption will now gradually be unleashed. This should bolster Sterling. As the Pound rises inflation should fall. Assuming they do not give up on their inflation target, currency strength should prompt the Bank of England to ease monetary conditions. Gilt yields will decline, forcing investors to seek longer duration bonds or higher credit risk to compensate for the shortfall in returns. Companies will find it easier to issue debt in order to fuel capital expenditure: although I expect it may lead to more share buybacks too. UK equity markets will rise, driven by an improved outlook for inflation, a lowering of interest rates and expectations of stronger economic growth.
For equity investors, this rising tide will float most ships, but not all companies will benefit equally. Those firms which were at risk of nationalisation have been immediate beneficiaries. The chart below tracks their relative underperformance: –
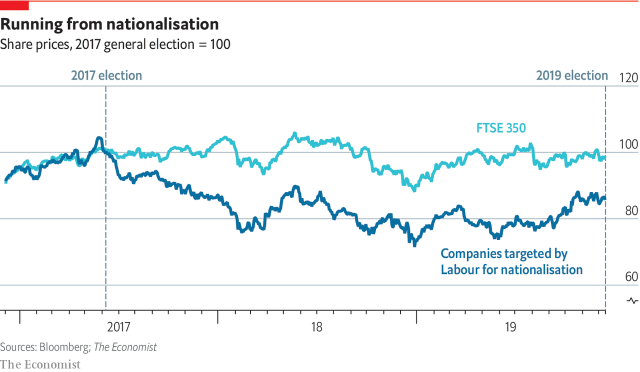
Source: Bloomberg, The Economist
A longer term investment opportunity should be found in the FTSE 250. The four year picture is found below (FTSE 100 in blue, FTSE 250 in red): –
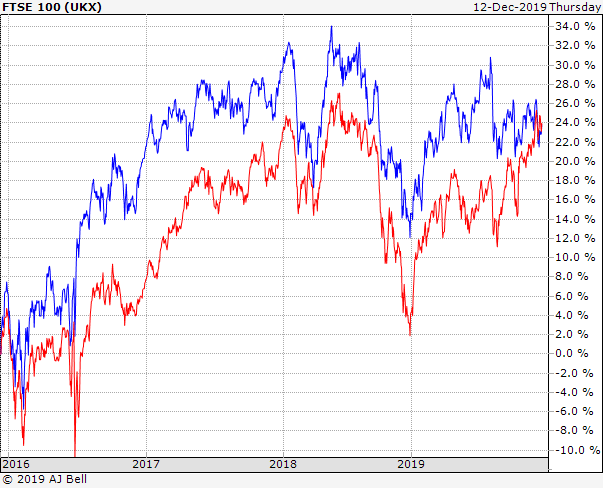
Source: AJ Bell
It might appear as if the FTSE 250 has already caught up with the FTSE 100, but this next chart reveals a rather different picture: –
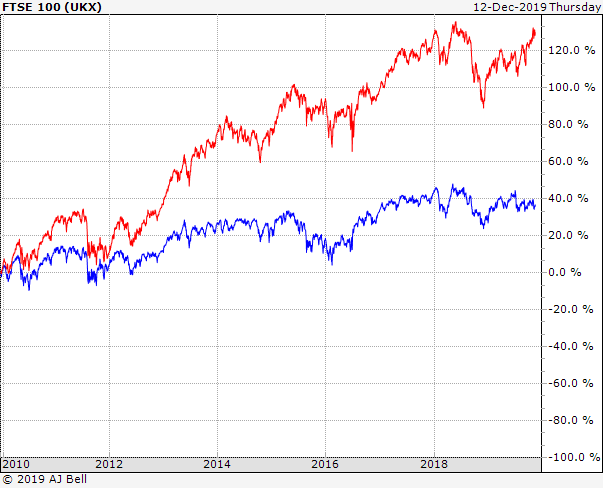
Source: AJ Bell
The FTSE 250 is much more closely entwined with the fortunes of the domestic UK economy. For the past four years many business plans in the UK have been on hold, awaiting clarity on Brexit. Now that a deal will be done and an FTA with the EU will follow, we may have finally reached the beginning of the end of uncertainty.

![]()
Macro Letter – No 115 – 24-05-2019
Trade Wars, the prospects for freer trade and the impact on asset prices
As Sino-US trade talks ended, not only, without a deal, but with another sharp increase in tariffs, it is worth looking at what has happened and why. During 2018 the US reversed 38 years of tariff reduction with a radical abruptness, imposing tariffs on 50% of Chinese imports, China retaliated in kind, imposing tariffs on 70% of US imports. The Peterson Institute – The 2018 US-China Trade Conflict after 40 Years of Special Protection – published before the recent tariff increases, reviews the situation in detail. The author, Chad Brown, begins by looking at the tariff reductions since the late 1980’s. For the US, these tariffs had fallen from 5% to 3%, whilst for China they declined from 40% to 8% by 2017. Over the same period China’s share of US imports rose from near to zero in 1978 to 20% by 2014. By contrast, Chinese imports from the US rose steadily, reaching 10% in 2001 – which coincided with their ascension to the World Trade Organisation (WTO) – however, since then, imports from the US have declined, dipping to 8.5% by 2017. In bilateral terms Chinese imports from the US are about a quarter of her exports to the land of the free.
At first sight, it might seem as if the trade tensions between China and the US are new, but relations have been deteriorating since the bursting of the US Tech bubble in 2001, if not before. Looking at the chart below, which measures antidumping and countervailing tariffs, it appears as if the Chinese did not begin to retaliate until 2006: –
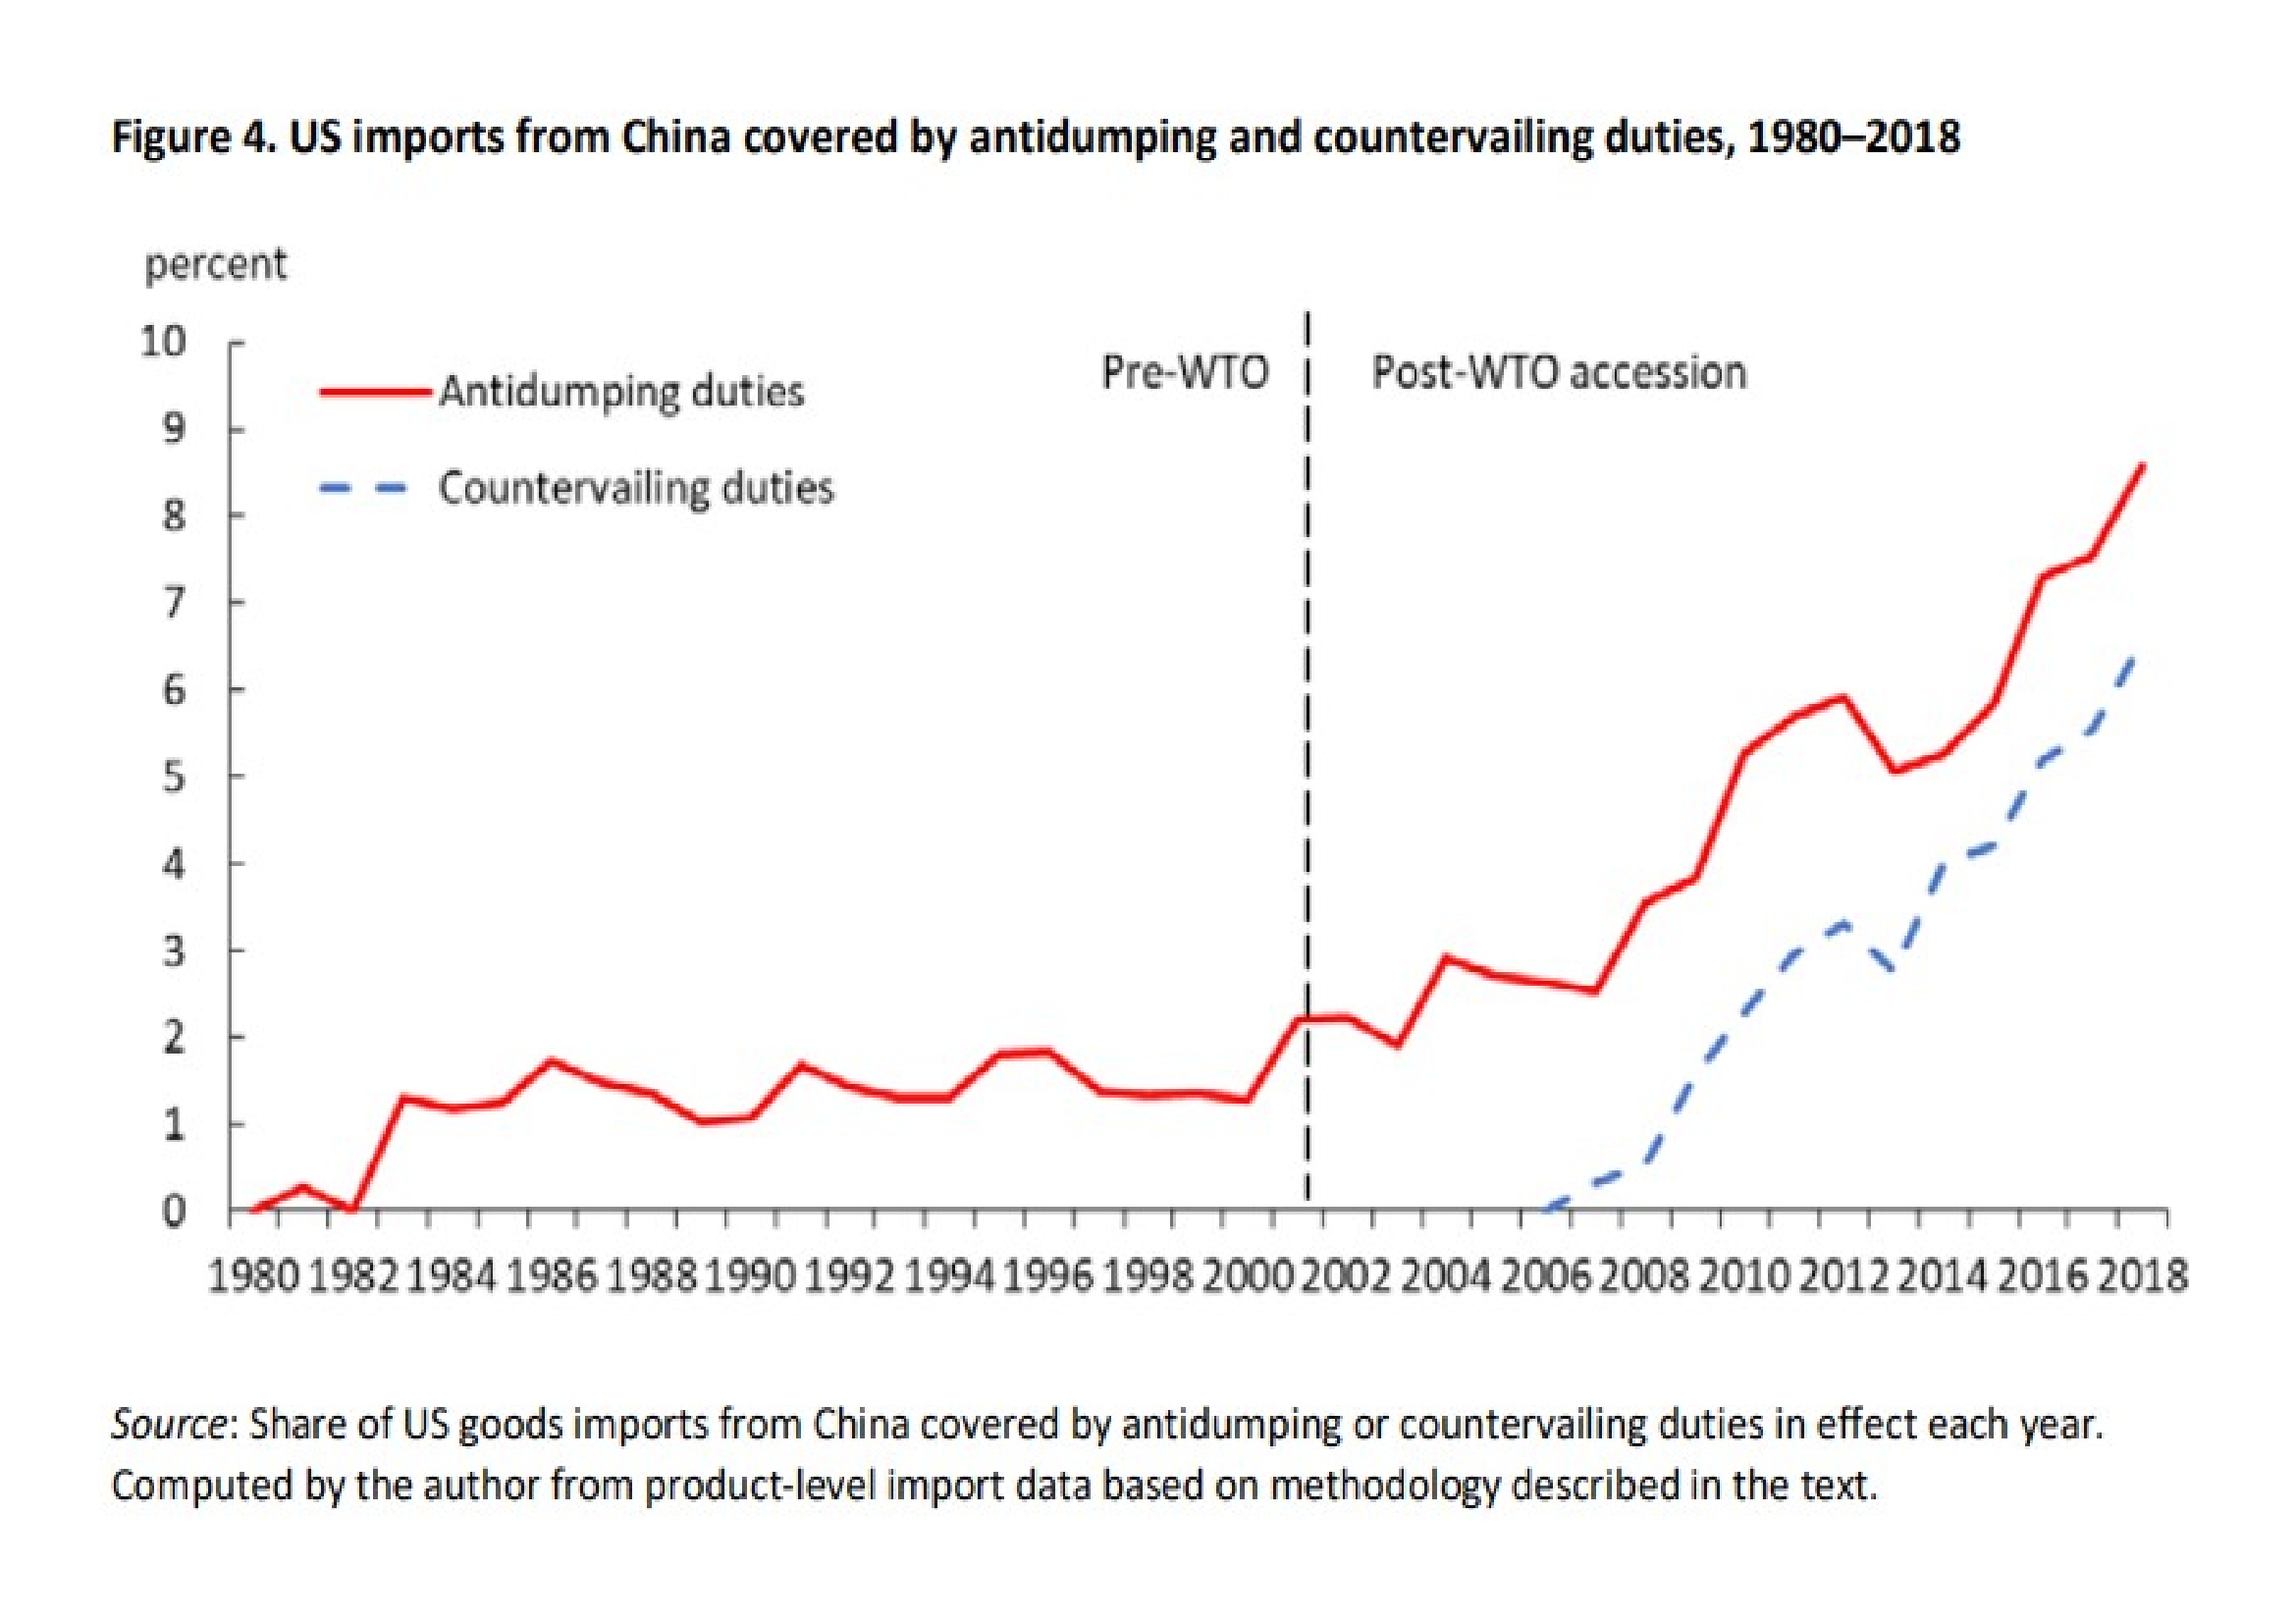
Source: Peterson Institute
Analysing anti-dumping and countervailing tariffs in isolation, however, gives a misleading impression of the US response to China. Peterson research attempts to assess the entire scope of the Sino-US trade dispute, by incorporating all forms of US special protection against China over the entire period. The next chart shows the true scale of US tariff reduction on Chinese imports; seen in this light, the extent of the recent policy shift is even more dramatic: –
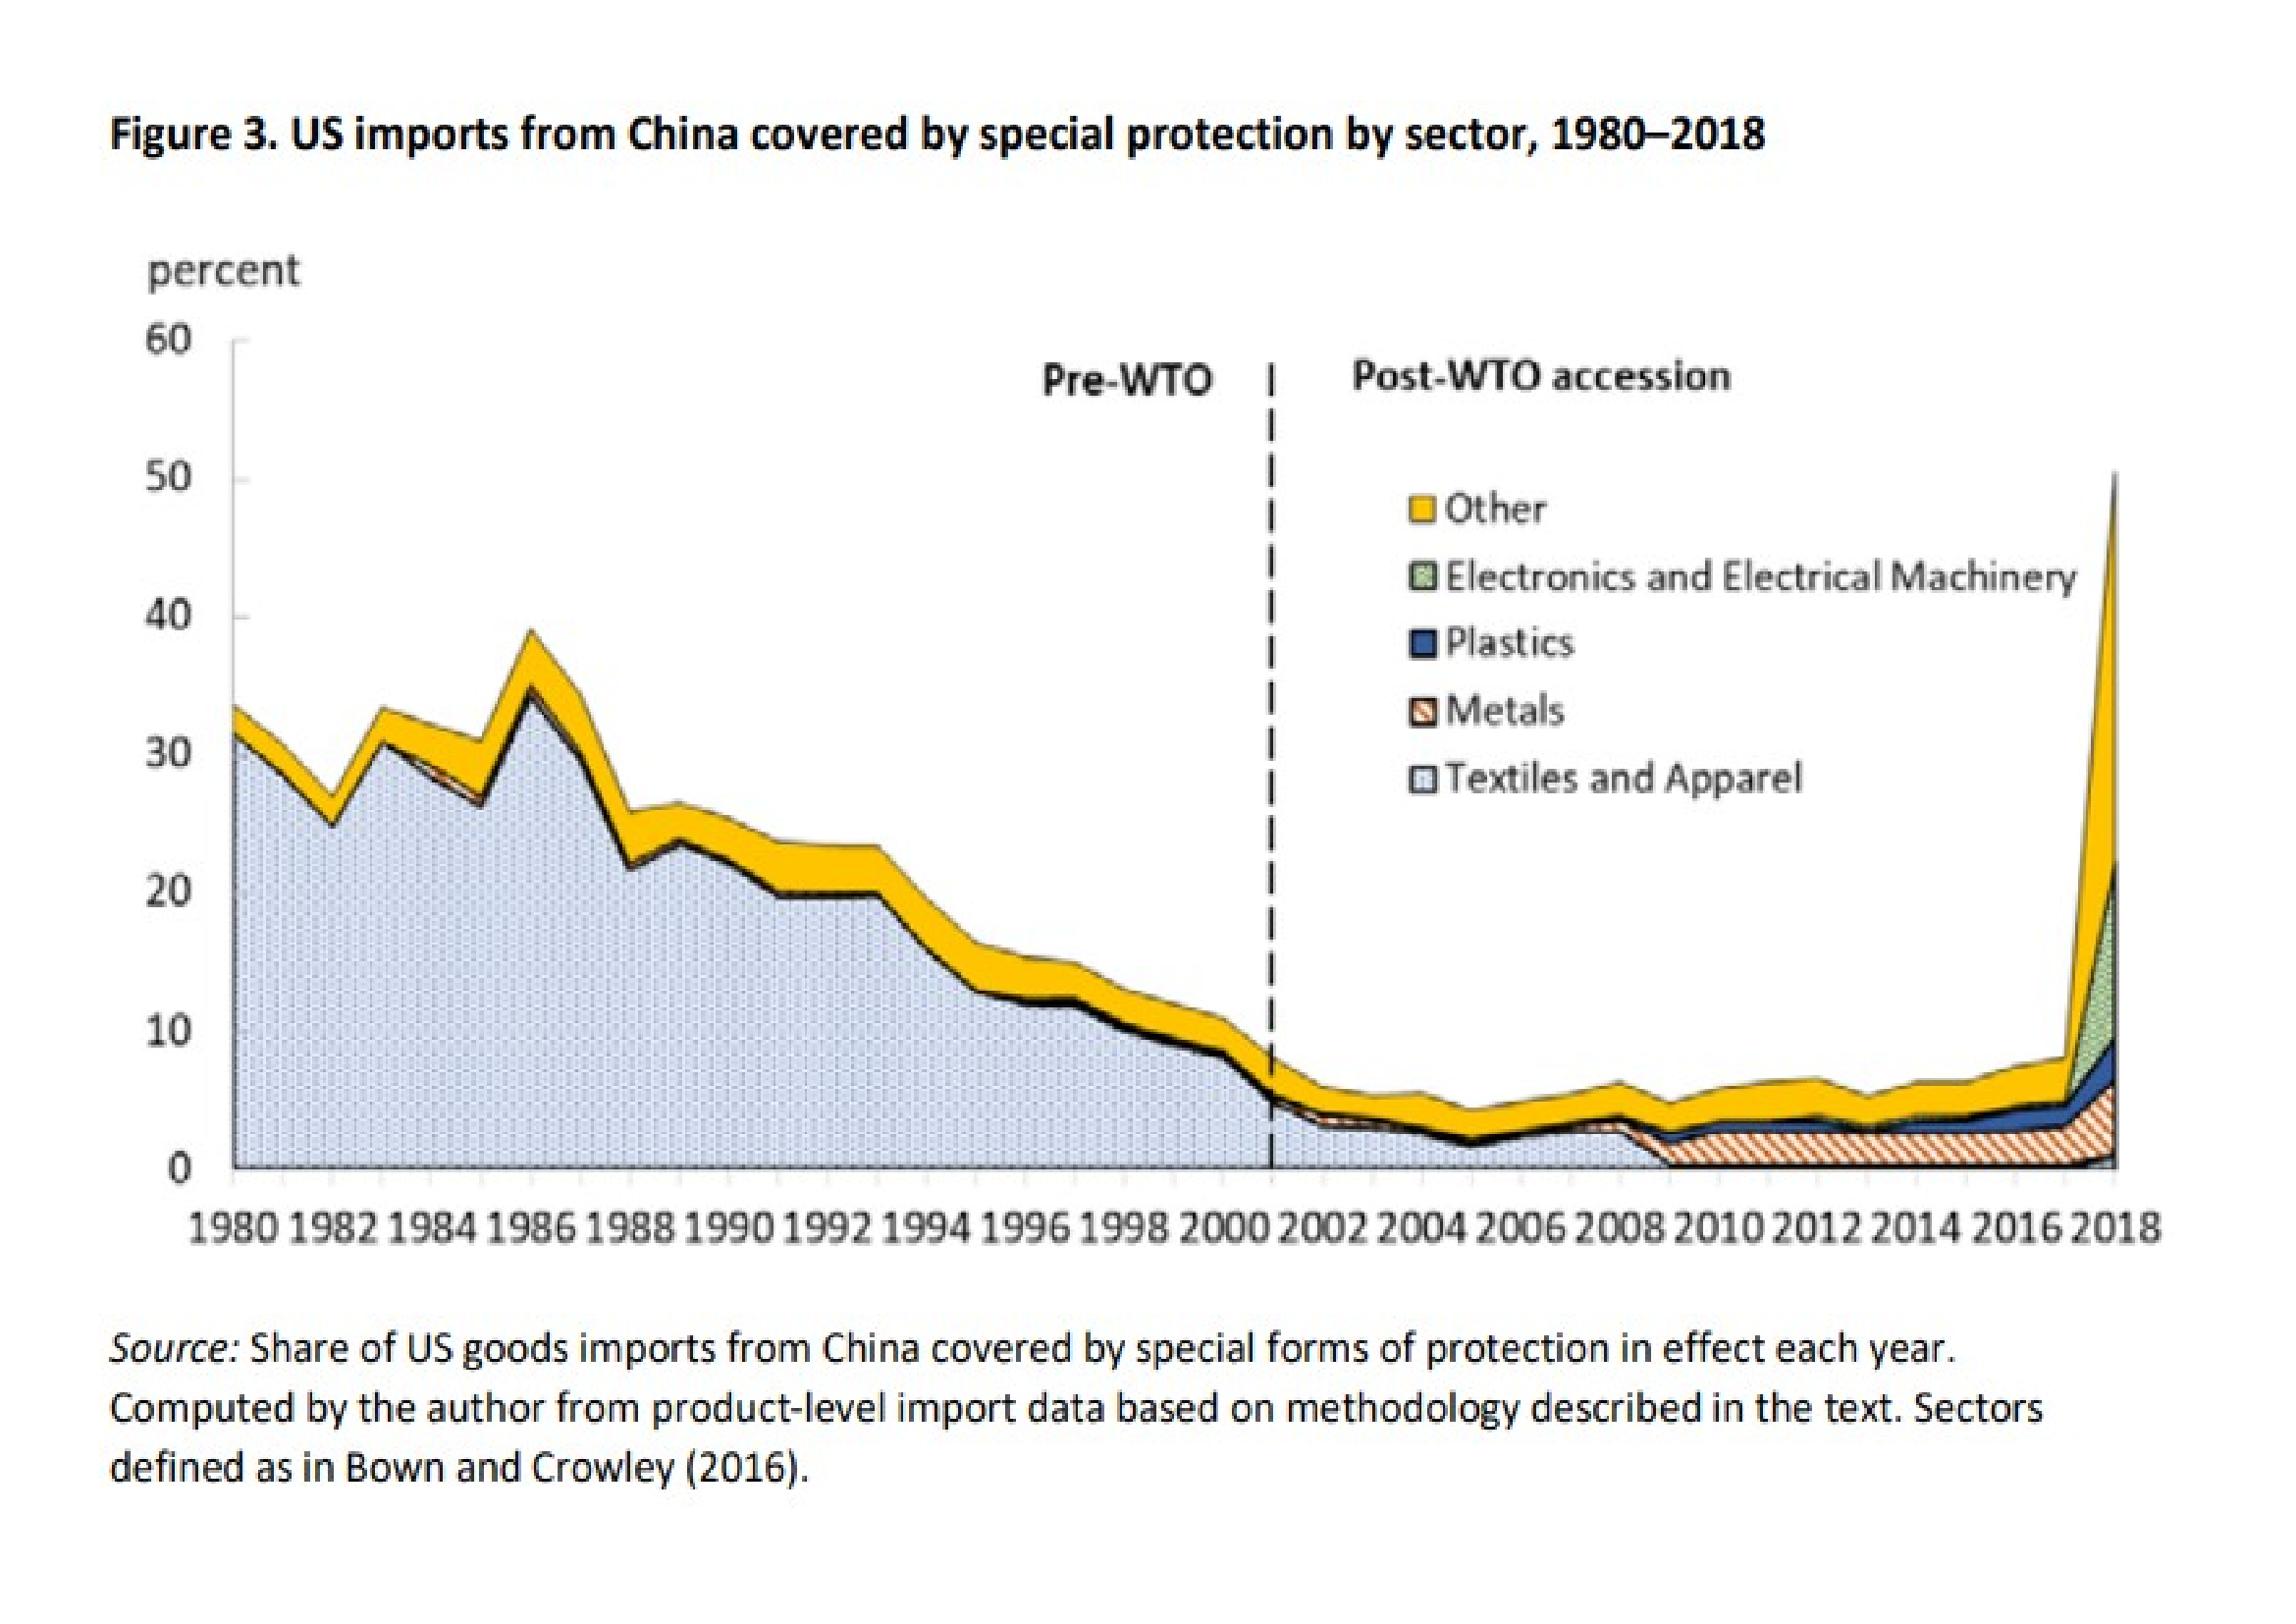
Source: Peterson Institute
Using this combined metric, US special protection peaked at 39% in 1986, after which these barriers declined rapidly reaching a nadir at 4.3% in 2005. On the eve of the trade war in 2017 barriers had risen to 8.1%. Prior to the May 10th tariff increase, that figure had jumped to 50%. An updated version of the Peterson chart of shown below: –
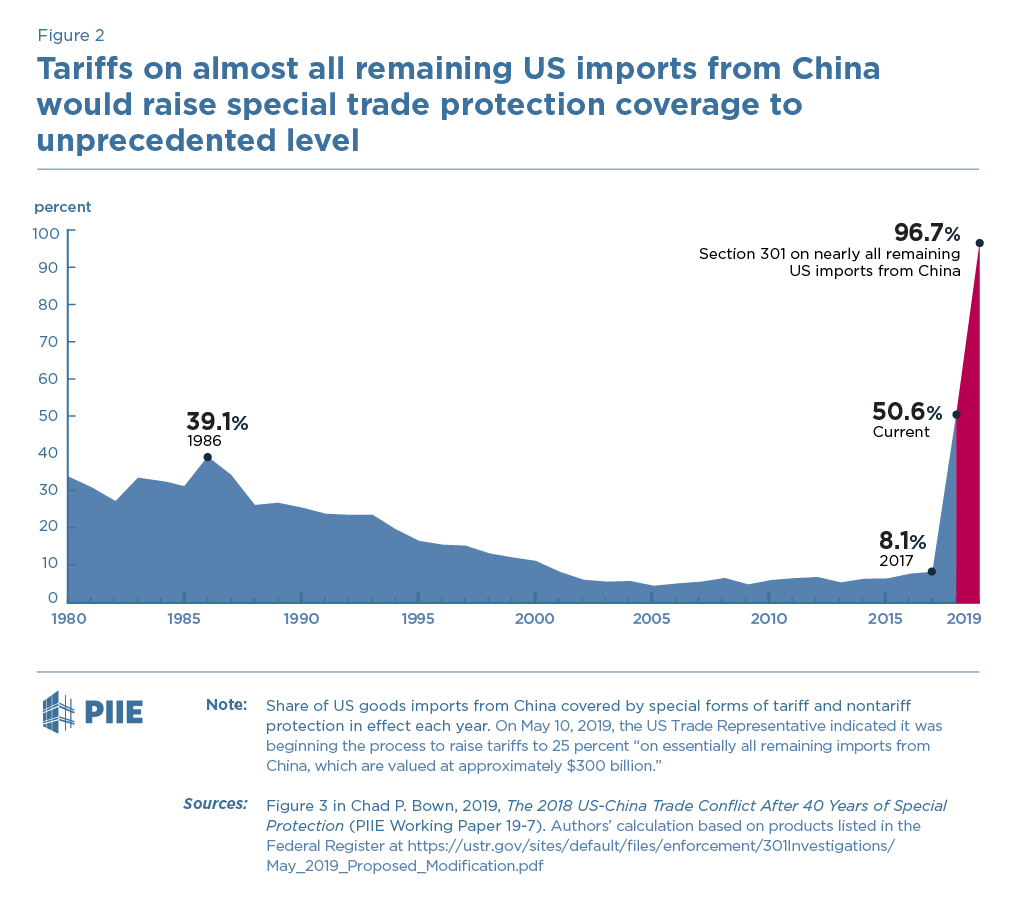
Source: Peterson Institute
The additional tariffs imposed this month will raise the average US tariff on Chinese goods to 18.3%. If Trump follows through with his threat to impose a 25% tariff on most of the rest of US imports from China, the average US tariff toward China would increase to 27.8%.
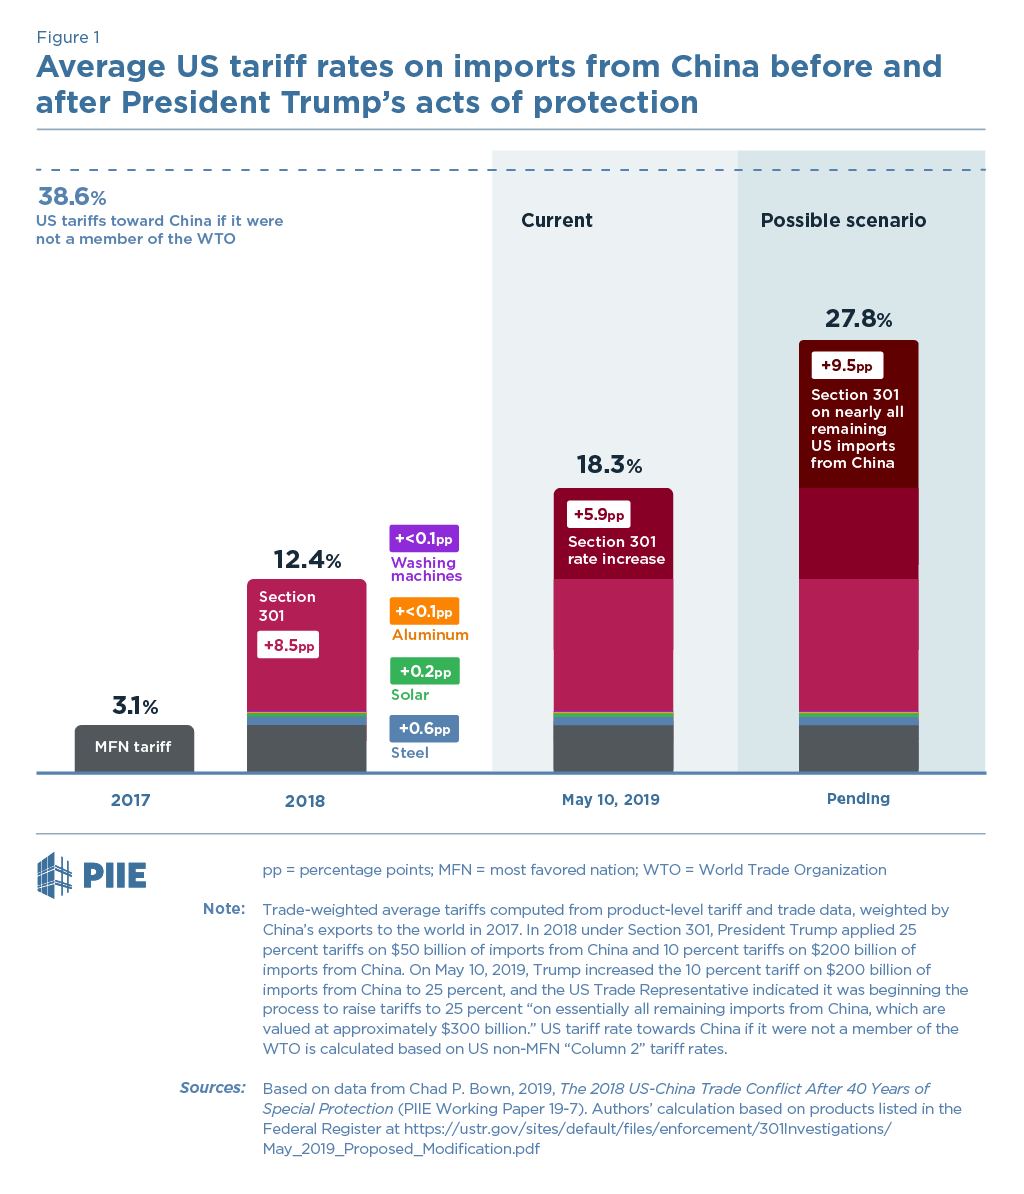
Source: Peterson Institute
What is the likely impact of these actions on trade and prices? For the US, import prices will increase, but given that US inflation has tended to be below the Fed target, this is manageable; corporates and consumers will pay the cost of tariffs, the tax receipts will help to finance the cost of recent US tax cuts. In China, whilst the impact is still negative, as this recent article from CFR – China Never Stopped Managing its Trade makes clear, the majority of imports are made by state owned enterprises or by companies which have a government permit to import such goods, added to which Chinese inflation has also been reasonably subdued, despite impressive continued economic expansion: –
When the state controls the firms that are doing the importing, a few phone calls can have a big impact. That’s why China can shut down trade in canola with Canada without formally introducing any tariffs.
That’s why China can scale back its purchases of Australian coal without filing a “dumping” or “national security” tariffs case.
And that’s why—when the trade war with the United States started—U.S. exports in a number of goods simply went to zero (normally, a 25 percent tariff would reduce imports by more like 50 percent or something…]
For US companies the four largest exports to China are aircraft, automobiles, soybeans and oil and gas. Of these, only automobiles are sold directly to the private sector. Here are three charts which explain why, for the US (at least in the near-term) there may be less to lose in this global game of chicken: –
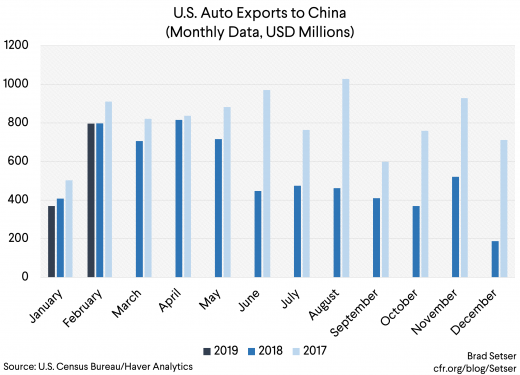
Source: US Census Bureau, Haver Analytics
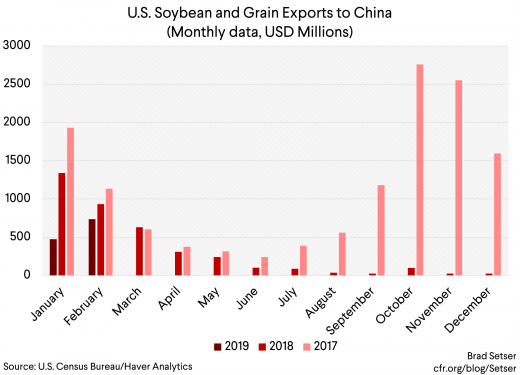
Source: US Census Bureau, Haver Analytics
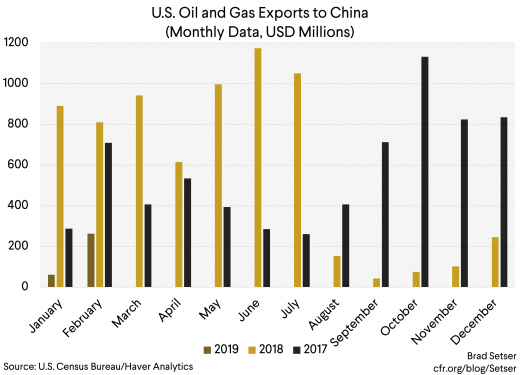
Source: US Census Bureau, Haver Analytics
The decline in US imports has been driven by a combination of substitution for imports from other sources and a rising domestic capability to manufacture intermediate goods. Faced with a dwindling market for their exports, the US might be forgiven for wishing to retire from the fray whilst it still has the advantage of being the ‘consumer of last resort’.
To date, US government receipts from tariff increases have amounted to an estimated $2bln. A study by the World Bank and the International Finance Corporation, however, estimates the true cost the US economy has been nearer to $6.4bln or 0.03% of GDP. The chart below shows the already substantial divergence between prices for tariff versus non-tariff goods: –
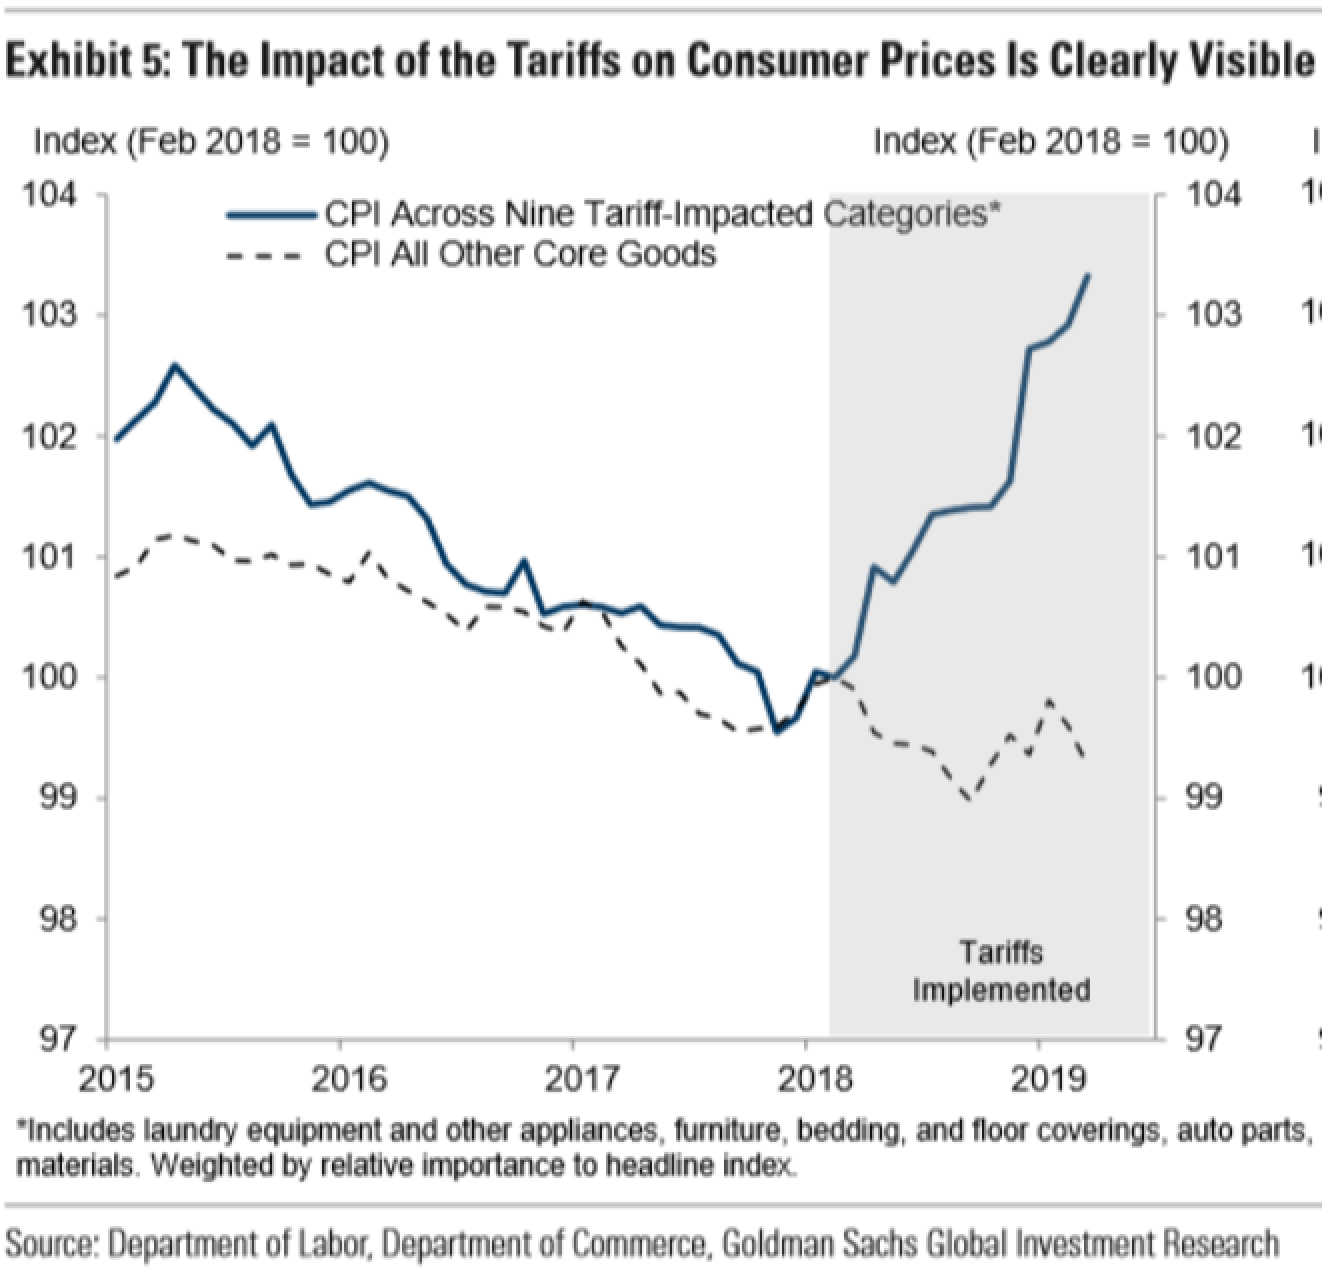
Source: Financial Sense, US Department of Labor, Commerce department, Goldman Sachs
The impact on China is more difficult to measure since Chinese statistics are difficult interpret, however, only 18% of Chinese exports are to the US – that equates to $446bln out of a total of $2.48trln in 2018, added to which, exports represent only 20% of Chinese GDP – all US imports amount to 3.6% of Chinese GDP.
The scale of the dispute (bilateral rather than multilateral) should not detract from its international significance. One institution which seen its credibility undermined by the imposition of US tariffs is the World Trade Organisation (WTO) – Chatham House – The Path Forward on WTO Reform provides an excellent primer to this knotty issue. Another concern, for economists, is that history is repeating itself. They fear Trump’s policies are a redux of the infamous Smoot-Hawley tariffs, imposed during the great depression. Peterson – Does Trump Want a Trade War? from March 2018 and Trump’s 2019 Protection Could Push China Back to Smoot-Hawley Tariff Levels published this month are instructive on this topic. These tariffs were implemented on 17th June 1930 and applied to hundreds of products. To put today’s dispute in perspective, the 1930’s tariff increase was only from 38% to 45% – a mere 18% increase – this month tariffs have increased from 10% to 25%: a 150% increase. Those who note that 25% is still well below 1930’s levels should not be complaisant, China remains a WTO member, were it not, US average tariffs would now be 38%. Back in 2016 President Trump talked of raising tariffs on Chinese imports to 45%, a number cunningly lifted from the Smoot-Hawley playbook.
One of the counter-intuitive effects of the 1930’s tariff increase was price deflation, in part due to many tariffs being imposed on a per unit cost basis. Today, per unit tariffs apply to only around 8% of goods, added to which, due to monetary engineering, by central banks, and the issuance of fiat currency by governments, the threat of real deflation is less likely.
Another risk is that the Sino-US spat engulfs other countries. The EU (especially Germany) has already suffered the ire of the US President. Recent trade deals between the EU and both Canada and Japan, have been heralded as a triumph for free-trade, however, they are an echo of the trading blocs which formed during the 1930’s. To judge by Trump’s recent tweets, for the moment, China has been singled out, on 13th May the President said: –
“Also, the Tariffs can be completely avoided if you buy from a non-Tariffed Country, or you buy the product inside the USA (the best idea). That’s Zero Tariffs. Many Tariffed companies will be leaving China for Vietnam and other such countries in Asia. That’s why China wants to make a deal so badly!”
Even if the trade dispute remains a Sino-US affair, there are other unseen costs to consider, on productivity and investment, Bruegal – Implications of the escalating China-US trade dispute takes up the discussion (emphasis mine): –
The direct aggregate effect of the tariffs on the welfare of the US and Chinese, while negative, is likely to be very small… because they represent a transfer from consumers, importers and partner exporters to the government… sooner or later, the American consumer will bear much of the cost of the tariff though higher prices, but also that tariff revenue will return to American residents in some form. The negative aggregate welfare effect of tariffs thus arises because, at the margin, they displace more efficient producers by less efficient ones… because, at the margin, tariffs artificially reduce the consumption or use of imports in favour of domestic goods or goods imported from third parties…
The distributional effect of tariffs is likely to be very uneven and severely negative on some people and sectors… while the Treasury will see increased revenue, and some producers who compete with imports will gain, small companies that depend on imported parts from China are likely to be very badly affected by tariffs…
Larger importers will also be adversely affected… US farmers who depend on Chinese markets have already been badly hurt by Chinese retaliation…
The biggest adverse effects of tariffs on aggregate economic activity is through investment. Lower investment is the natural result of the tariffs’ big distributional effects… and the uncertainty they engender. This effect on ‘animal spirits’ is difficult to model and impossible to quantify with precision… The extraordinary sensitivity of stock markets to trade news and their volatility is just one manifestation of this effect. The widening growth gap between the global manufacturing and services sectors evident in recent quarters is another, as is the slowdown in investment in many countries.
Bruegal go on to discuss the risk to the international trading system and the damage to the credibility of the WTO. Finally they suggest that the trade dispute is a kind of proxy-war between the two super-powers: this is much more than just a trade dispute.
Putting the Sino-US dispute in an historical context, a number of commentators have drawn comparisons between China today and Japan in the 1980’s. I believe the situation is quite different, as will be the outcome. Again, I defer to Bruegal – Will China’s trade war with the US end like that of Japan in the 1980s? The author’s argue that Japan chose to challenge the US when it was close to its economic peak and its productivity was stagnating. China, by contrast, has a younger population, rapidly improving productivity and, most importantly, remains a significant way below its economic peak: –
…Because China is at an earlier stage of economic development, it is expected to challenge the US hegemony for an extended period of time. Therefore, the US-China trade war could last longer than the one with Japan. With China’s growth prospects still relatively solid – it will soon overtake the US economy in size and it does not depend on the US militarily – China will likely challenge US pressure in the ongoing negotiations for a settlement to the trade war. This also means that any deal will only be temporary, as the US will not be able to contain China as easily as it contained Japan.
If you are looking for a more global explanation of the current dispute between the US and China, then this article from CFR – The Global Trading System: What Went Wrong and How to Fix It is instructive: –
As economist Richard Baldwin lays out in his book The Great Convergence, the Industrial Revolution of the 19th century had launched Europe, the US, Japan and Canada on a trajectory that would see their wealth surge ahead of the rest of the world. In 1820, for example, incomes in the US were about three times those of China; by 1914 Americans would be 10 times as wealthy as Chinese. Manufacturing clustered in the technologically advanced countries, while advances in containerized shipping and the lowering of tariffs through trade negotiations made it possible for these countries to specialize and trade in the classic Ricardian fashion.
The information technology revolution of the 1990s turned that story upside down. With the advent of cheap, virtually instant global communications via the Internet, it became possible – and then imperative for competitive success – for multinational companies to take their best technologies and relocate production in lower-wage countries. Manufacturing output rose in middle-income countries like China, India, Thailand, Poland and others, while falling sharply in the US, Japan, France, the UK and even Germany…
The global great convergence, however, coincided with a great divergence within the wealthy countries (and many developing countries as well). The new technologies and the disappearance of trade barriers upended the balance between labor and capital in the advanced industrialized countries, and contributed to soaring economic inequality…
In the US in 1979, an American with a college degree or higher earned about 50% more than one who had only a high school education or less. By 2018, American workers with a four-year college degree earned almost twice as much as those with just a high-school education, and were unemployed half as often, while those with a professional degree earned nearly three times as much.
The author goes on to liken today’s tension between the US and China with the situation which existed between the UK and US at the beginning of the 20th century: –
The world today again faces the same governance gap – a US that no longer has the economic muscle nor the political will to organize the global system, and a rising China that is reluctant to play a greater role.
CFR ask what the prospects maybe for renewed globalization? They identify three key elements which need to be addressed in order for de-globalisation to be reversed: a trade war truce (once both sides wake up to the extent of the empasse they have engineered), a filling the Leadership Vacuum (caused by both sides turning their backs on the WTO – they need to reengage and lead the world towards a solution) and, especially for the US, meeting the challenges at home (Trump cannot rely on a trade war in the long-run to solve the problem of inequality within the US).
Conclusions and investment opportunities
What is the likely impact on financial markets? To answer this question one needs to know whether the current trade war will escalate or dissipate: and if it escalates, will it be short and sharp or protracted and pernicious?
Alisdair Macleod of Gold Money – Post-tariff considerations identifies the following factors: –
The effect of the new tariff increases on trade volumes
The effect on US consumer prices
The effect on US production costs of tariffs on imported Chinese components
The consequences of retaliatory action on US exports to China
The recessionary impact of all the above on GDP
The consequences for the US budget deficit, allowing for likely tariff income to the US Treasury
Leading, in MacLeod’s opinion, to: –
Reassessment of business plans in the light of market information
A tendency for bank credit to contract as banks anticipate heightened lending risk
Liquidation of financial assets held by banks as collateral
Foreign liquidation of USD assets and deposits
The government’s borrowing requirement increasing unexpectedly
Bond yields rising to discount increasing price inflation
Banks facing increasing difficulties and the re-emergence of systemic risk
The author suggests that, all other things equal, tariffs should lead to price increases, but, with the US consumer already heavily burdened with debt, consumption demand will suffer.
I am less bearish than MacLeod because, if the Sino-US trade war threatens to puncture the decade long equity bull-market, we will see a combination of qualitative and quantitative easing from the largest central banks and aggressive fiscal stimulus from the governments of G20 and beyond. I wrote about this scenario (though without reference to the trade war) earlier this month in Macro Letter – No 114 – 10-05-2019 – Debasing the Baseless – Modern Monetary Theory. My, perhaps overly simple, prediction for assets in the longer-term is: bonds up, stocks up and real estate up.
In an alternative scenario, we might encounter asset price deflation and consumer price inflation occurring simultaneously. Worse still, this destructive combination of forces might coinciding with a global recession. The severity of any recession – and the inevitable correction to financial markets that such an economic downturn would precipitate – will depend entirely on the time it takes for US and Chinese trade negotiators to realise the danger and reach a compromise. I believe they will do so relatively quickly.
Attempting to predict what President Trump might do next is fraught with danger, but, due to the inherent weakness of the democratic process, I expect the US administration to concede. The US President has an election to win in November 2020; the President of China has been elected for life.
![]()
Macro Letter – No 103 – 26-10-2018
Not waving but drowning – Stocks, debt and inflation?
The recent decline in the US stock market, after the longest bull-market in history, has prompted many commentators to focus on the negative factors which could sow the seeds of the next recession. Among the main concerns is the inexorable rise in debt since the great financial recession (GFR) of 2008. According to May 2018 data from the IMF, global debt now stands at $63trln, with emerging economy debt expansion, over the last decade, more than offsetting the marking time among developed nations. The IMF – Global Debt Database: Methodology and Sources WP/18/111 – looks at the topic in more detail.
The title of this week’s Macro letter comes from the poet Stevie Smith: –
I was much further out than you thought
And not waving but drowning.
It seems an appropriate metaphor for valuation and leverage in asset markets. In 2013 Thomas Pickety published ‘Capital in the 21st Century’ in which he observed that income inequality was rising due to the higher return on unearned income relative to labour. He and his co-authors gathering together one of the longest historical data-set on interest rates and wages – an incredible achievement. Their conclusion was that the average return on capital had been roughly 5% over the very long run.
This is not the place to argue about the pros and cons of Pickety’s conclusions, suffice to say that, during the last 50 years, inflation indices have tended to understate what most of us regard as our own personal inflation rate, whilst the yield offered by government bonds has been insufficient to match the increase in our cost of living. The real rate of return on capital has diminished in the inflationary, modern era. Looked at from another perspective, our current fiat money and taxation system encourages borrowing rather than lending, both by households, corporates, for whom repayment is still an objective: and governments, for whom it is not.
Financial innovation and deregulation has helped to oil the wheels of industry, making it easier to service or reschedule debt today than in the past. The depth of secondary capital markets has made it easier to raise debt (and indeed equity) capital than at any time in history. These financial markets are underpinned by central banks which control interest rates. Since the GFR interest rates have been held at exceptionally low levels, helping to stimulate credit growth, however, that which is not seen, as Bastiat might have put it, is the effect that this credit expansion has had on the global economy. It has led to a vast misallocation of capital. Companies which would, in an unencumbered interest rate environment, have been forced into liquidation, are still able to borrow and continue operating; their inferior products flood the market place crowding out the market for new innovative products. New companies are confronted by unfair competition from incumbent firms. Where there should be a gap in the market, it simply does not exist. At a national and international level, productivity slows and the trend rate of GDP growth declines.
We are too far out at sea and have been for decades. Markets are never permitted to clear, during economic downturns, because the short-term pain of recessions is alleviated by the rapid lowering of official interest rates, prolonging the misallocation of capital and encouraging new borrowing via debt – often simply to retire equity capital and increase leverage. The price of money should be a determinant of the value of an investment, but when interest rates are held at an artificially low rate for a protracted period, the outcome is massively sub-optimal. Equity is replaced by debt, leverage increases, zombie companies limp on and, notwithstanding the number of technology start-ups seen during the past decade, innovation is crushed before it has even begun.
In an unencumbered market with near price stability, as was the case prior to the recent inflationary, fiat currency era, I suspect, the rate of return on capital would be approximately 5%. On that point, Pickety and I are in general agreement. Today, markets are as far from unencumbered as they have been at any time since the breakdown of the Bretton Woods agreement in 1971.
Wither the stock market?
With US 10yr bond yields now above 3%, stocks are becoming less attractive, but until real-yields on bonds reach at least 3% they still offer little value – US CPI was at 2.9% as recently as August. Meanwhile higher oil prices, import tariffs and wage inflation all bode ill for US inflation. Nonetheless, demand for US Treasuries remains robust while real-yields, even using the 2.3% CPI data for September, are still exceptionally low by historic standards. See the chart below which traces the US CPI (LHS) and US 10yr yields (RHS) since 1971. Equities remain a better bet from a total return perspective: –
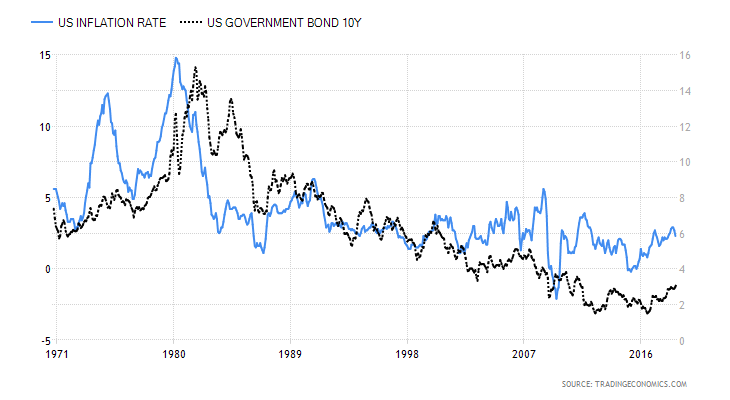
Source: Trading Economics
What could change sentiment, among other factors, is a dramatic rise in the US$, an escalation in the trade-war with China, or a further increase in the price of oil. From a technical perspective the recent weakness in stocks looks likely to continue. A test of the February lows may be seen before the year has run its course. Already around ¾ of the stocks in the S&P 500 have suffered a 10% plus correction – this decline is broad-based.
Many international markets have already moved into bear territory (declining more than 20% from their highs) but the expression, ‘when the US sneezes the world catches a cold,’ implies that these markets may fall less steeply, in a US stock downturn, but they will be hard-pressed to ignore the direction of the US equity market.
Conclusions and investment opportunities
Rumours abound of another US tax cut. Federal Reserve Chairman, Powell, has been openly criticised by President Trump; whilst this may not cause the FOMC to reverse their tightening, they will want to avoid going down in history as the committee that precipitated an end to Federal Reserve independence.
There is a greater than 50% chance that the S&P 500 will decline further. Wednesday’s low was 2652. The largest one month correction this year is still that which occurred in February (303 points). We are not far away, however, a move below 2637 will fuel fears. I believe it is a breakdown through the February low, of 2533, which will prompt a more aggressive global move out of risk assets. The narrower Dow Jones Industrials has actually broken to new lows for the year and the NASDAQ suffered its largest one day decline in seven years this week.
A close below 2352 for the S&P 500 would constitute a 20% correction – a technical bear-market. If the market retraces to the 2016 low (1810) the correction will be 38% – did someone say, ‘Fibonacci’ – if we reach that point the US Treasury yield curve will probably be close to an inversion: and from a very low level of absolute rates. Last week the FRBSF – The Slope of the Yield Curve and the Near-Term Outlook – analysed the recession predicting power of the shape of the yield curve, they appear unconcerned at present, but then the current slope is more than 80bp positive.
If the stock correction reaches the 2016 lows, a rapid reversal of Federal Reserve policy will be required to avoid accusations that the Fed deliberately engineered the disaster. I envisage the Fed calling upon other central banks to render assistance via another concert party of quantitative, perhaps backed up by qualitative, easing.
At this point, I believe the US stock market is consolidating, an immanent crash is not on the horizon. The GFR is still too fresh in our collective minds for history to repeat. Longer term, however, the situation looks dire – history may not repeat but it tends to rhyme. Among the principal problems back in 2008 was an excess of debt, today the level of indebtedness is even greater…
We are much further out than we thought,
And not waving but drowning.
Inflated Opinions author Paul Wynn discusses the current plight of Active Investment
Video – Paul discusses the current plight of Active Investment

![]()
Macro Letter – No 95 – 20-04-2018
Inflation or Employment
Given the official policy response to the Great Financial Recession – a mixture of central bank balance sheet expansion, lower for longer interest rates and a general lack of fiscal rectitude on the part of developed nation governments – I believe there are two factors which are key for stock markets over the next few years, inflation and employment. The fact that these also happen to be the two mandated targets of the Federal Reserve – full employment and price stability – is more than coincidental. My struggle is in attempting to decide whether demand-pull inflation can survive the impact of a rapid rise in unemployment come the next recession.
Inflation and the Central Bankers response is clearly the new narrative of the financial markets. In his latest essay, Ben Hunt of Salient Partners makes some fascinating observations – Epsilon Theory: The Narrative Giveth and The Narrative Taketh Away:-
This market, like all markets, cares about two things and two things only — the price of money and the real return on invested capital. Or, as they are typically represented in cartoon form, interest rates and growth.
…This market, like all markets, needs a positive narrative on risk (the price of money) or reward (the real return on capital) to go up. Any narrative will do! But when neither risk nor reward is represented with a positive narrative, this market, like all markets, will go down. And that’s where we are today.
Does the Fed have our back? No, they do not. They’ve told us and told us that they’re going to keep raising rates. And they will. The market still doesn’t fully believe them, and that’s going to be a constant source of market disappointment over the next few years. In the same way that markets go up as they climb a wall of worry, so do markets go down as they descend a wall of hope. The belief that central bankers care more about the stock market than the price stability of money is that wall of hope. It’s a forlorn hope.
The author goes on to discuss the way that inflation and the war on trade has derailed the global synchronized growth narrative. Dr Hunt writes at length about narratives; those who have been reading my letters for a while will know I regularly quote from his excellent Epsilon Theory.
The narrative has not yet become flesh, to coin a phrase, but in the author’s opinion it will:-
My view: the inflation narrative will surge again, as wage inflation is, in truth, not contained at all.
The trade war narrative hit markets in force in late February with the White House announcement on steel and aluminum tariffs. It subsided through mid-March as hope grew that Trump’s bark was worse than his bite, then resurfaced in late March with direct tariff threats against China, then subsided again on hopes that direct negotiations would contain the conflict, and has now resurfaced this past week with still more direct tariff threats against and from China. Already this weekend you’ve got Kudlow and other market missionaries trying to rekindle the hope of easy negotiations. But being “tough on trade” is a winning domestic political position for both Trump and Xi, and domestic politics ALWAYS trumps (no pun intended) international economics.
My view: the trade war narrative will be spurred on by BOTH sides, and is, in truth, not contained at all.
The two charts below employ natural language processing techniques. They show how the inflation narrative has rapidly increased during the last 12 months. I shall leave Dr Hunt to elucidate:-
… analysis of a large set of market relevant articles — in this case everything Bloomberg has published that talks about inflation — where linguistic similarities create clusters of articles with similar meaning (essentially a linguistic “gravity model”), and where the dynamic relationships between and within these clusters can be measured over time.

Source: Quid.inc
What this chart shows is the clustering of content in 1,400 Bloomberg articles, which mention US inflation, between April 2016 and March 2017. The graduated colouring – blue earlier and red later in the year – enriches the analysis.
The next chart is for the period April 2017 to March 2018:-

Source: Quid.Inc
During this period there were 2,400 articles (a 75% increase) but, of more relevance is the dramatic increase in clustering.
What is clear from these charts is the rising importance of inflation as a potential driver of market direction. Yet there are contrary signals that suggest that economic and employment growth are already beginning to weaken. Can inflation continue to rise in the face of these headwinds. Writing in The Telegraph, Ambrose Evans-Pritchard has his doubts (this transcript is care of Mauldin Economics) – JP Morgan fears Fed “policy mistake” as US yield curve inverts:-
US jobs growth fizzled to stall-speed levels of 103,000 in March. The worldwide PMI gauge of manufacturing and services has dropped to a 14-month low. The average “Nowcast” tracker of global growth has slid suddenly to a quarterly rate of 3.2pc from 4.1pc as recently as early February.
Analysts at JP Morgan say the forward curve for the one-month Overnight Index Swap rate (OIS) – a market proxy for the Fed policy rate – has flattened and “inverted” two years ahead. This is a collective bet by big institutional investors and fund managers that interest rates may be falling by then.
…The OIS yield curve has inverted three times over the last two decades. In 1998 it proved to be a false alarm because the Greenspan Fed did a pirouette and flooded the system with liquidity. In 2000 it was a clear precursor of recession. In 2005 it signaled that the US housing boom was already starting to deflate.
…Growth of the “broad” M3 money supply in the US has slowed to a 2pc rate over the last three months (annualised)…pointing to a “growth recession” by early 2019. Narrow real M1 money has actually contracted slightly since November.
…RBC Capital Markets says this will drain M3 money by roughly $300bn a year…
…Three-month Libor rates – used to set the cost of borrowing on $9 trillion of US and global loans, and $200 trillion of derivatives – have surged 60 basis points since January.
…The signs of a slowdown are even clearer in Europe…Citigroup’s economic surprise index for the region has seen the worst four-month deterioration since 2008. A reduction in the pace of QE from $80bn to $30bn a month has removed a key prop. The European Central Bank’s bond purchase programme expires altogether in September.
…The global money supply has been slowing since last September. The Baltic Dry Index measuring freight rates for dry goods peaked in mid-December and has since dropped 45pc.
Which brings us neatly to the commodity markets. Are real assets a safe place to hide in the coming inflationary (or perhaps stagflationary) environment? Will the lack of capital investment, resulting from the weakness in commodity prices following the financial crisis, feed through to cost-push inflation?
The trouble with commodities
Commodities are an excellent portfolio diversifier because they tend to be uncorrelated with stock, bonds or real estate. They have a weakness, however, since to invest in commodities one needs to accept that over the long run they have a negative real-expected return. Why? Because of man’s ingenuity. We improve our processes and invest in new technologies which reduce our production costs. We improve extraction techniques and enhance acreage yields. You cannot simply buy and hold commodities: they are trading assets.
Demand and supply of commodities globally is a complex challenge to measure; for grains, oilseeds and cotton the USDA World Agricultural Supply and Demand Estimates for March offers a fairly balanced picture:-
World 2017/18 wheat supplies increased this month by nearly 3.0 million tons as production is raised to a new record of 759.8 million
Global coarse grain production for 2017/18 is forecast 7.0 million tons lower than last month to 1,315.0 million
Global 2017/18 rice production is raised 1.2 million tons to a new record led by 0.3- million-ton increases each for Brazil, Burma, Pakistan, and the Philippines. Global rice exports are raised 0.8 million tons with a 0.3-million-ton increase for Thailand and 0.2- million-ton increases each for Burma, India, and Pakistan. Imports are raised 0.5 million tons for Indonesia and 0.3 million tons for Bangladesh. Global domestic use is reduced fractionally. With supplies increasing and total use decreasing, world ending stocks are raised 1.4 million tons to 144.4 million and are the second highest stocks on record.
Global oilseed production is lowered 5.7 million tons to 568.8 million, with a 6.1-million-ton reduction for soybean production and slightly higher projections for rapeseed, sunflower seed, copra, and palm kernel. Lower soybean production for Argentina, India, and Uruguay is partly offset by higher production for Brazil.
Cotton – Lower global beginning stocks this month result in lower projected 2017/18 ending stocks despite higher world production and lower consumption. World beginning stocks are 900,000 bales lower this month, largely attributable to historical revisions for Brazil and Australia. World production is about 250,000 bales higher as a larger Brazilian crop more than offsets a decline for Sudan. Consumption is about 400,000 bales lower as lower consumption in India, Indonesia, and some smaller countries more than offsets Vietnam’s increase. Ending stocks for 2017/18 are nearly 600,000 bales lower in total this month as reductions for Brazil, Sudan, the United States, and Australia more than offset an increase for Pakistan.
It is worth remembering that local market prices can be dramatically influenced by small changes in regional supply or demand and the vagaries of supply chain logistics. Added to which, for US grains there is heightened anxiety regarding tariffs: they are expected to be the main target of the Chinese retaliation.
Here is the price of US Wheat since 2007:-
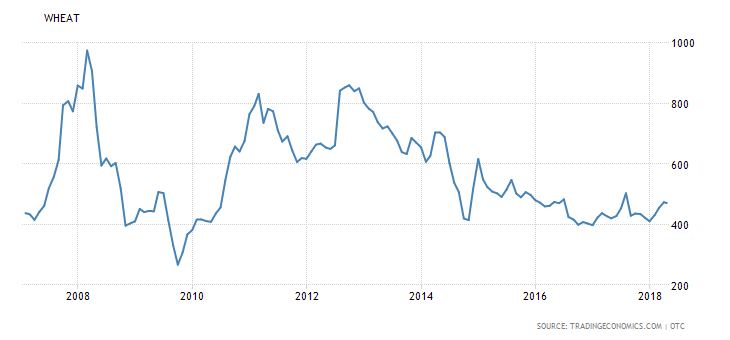
Source: Trading Economics
Crisis? What crisis? It is still near to multi-year lows, although above the nadir of the financial crisis in 2009.
The broader CRB Index shows a more pronounced recovery, it has been rising since the beginning of 2016:-
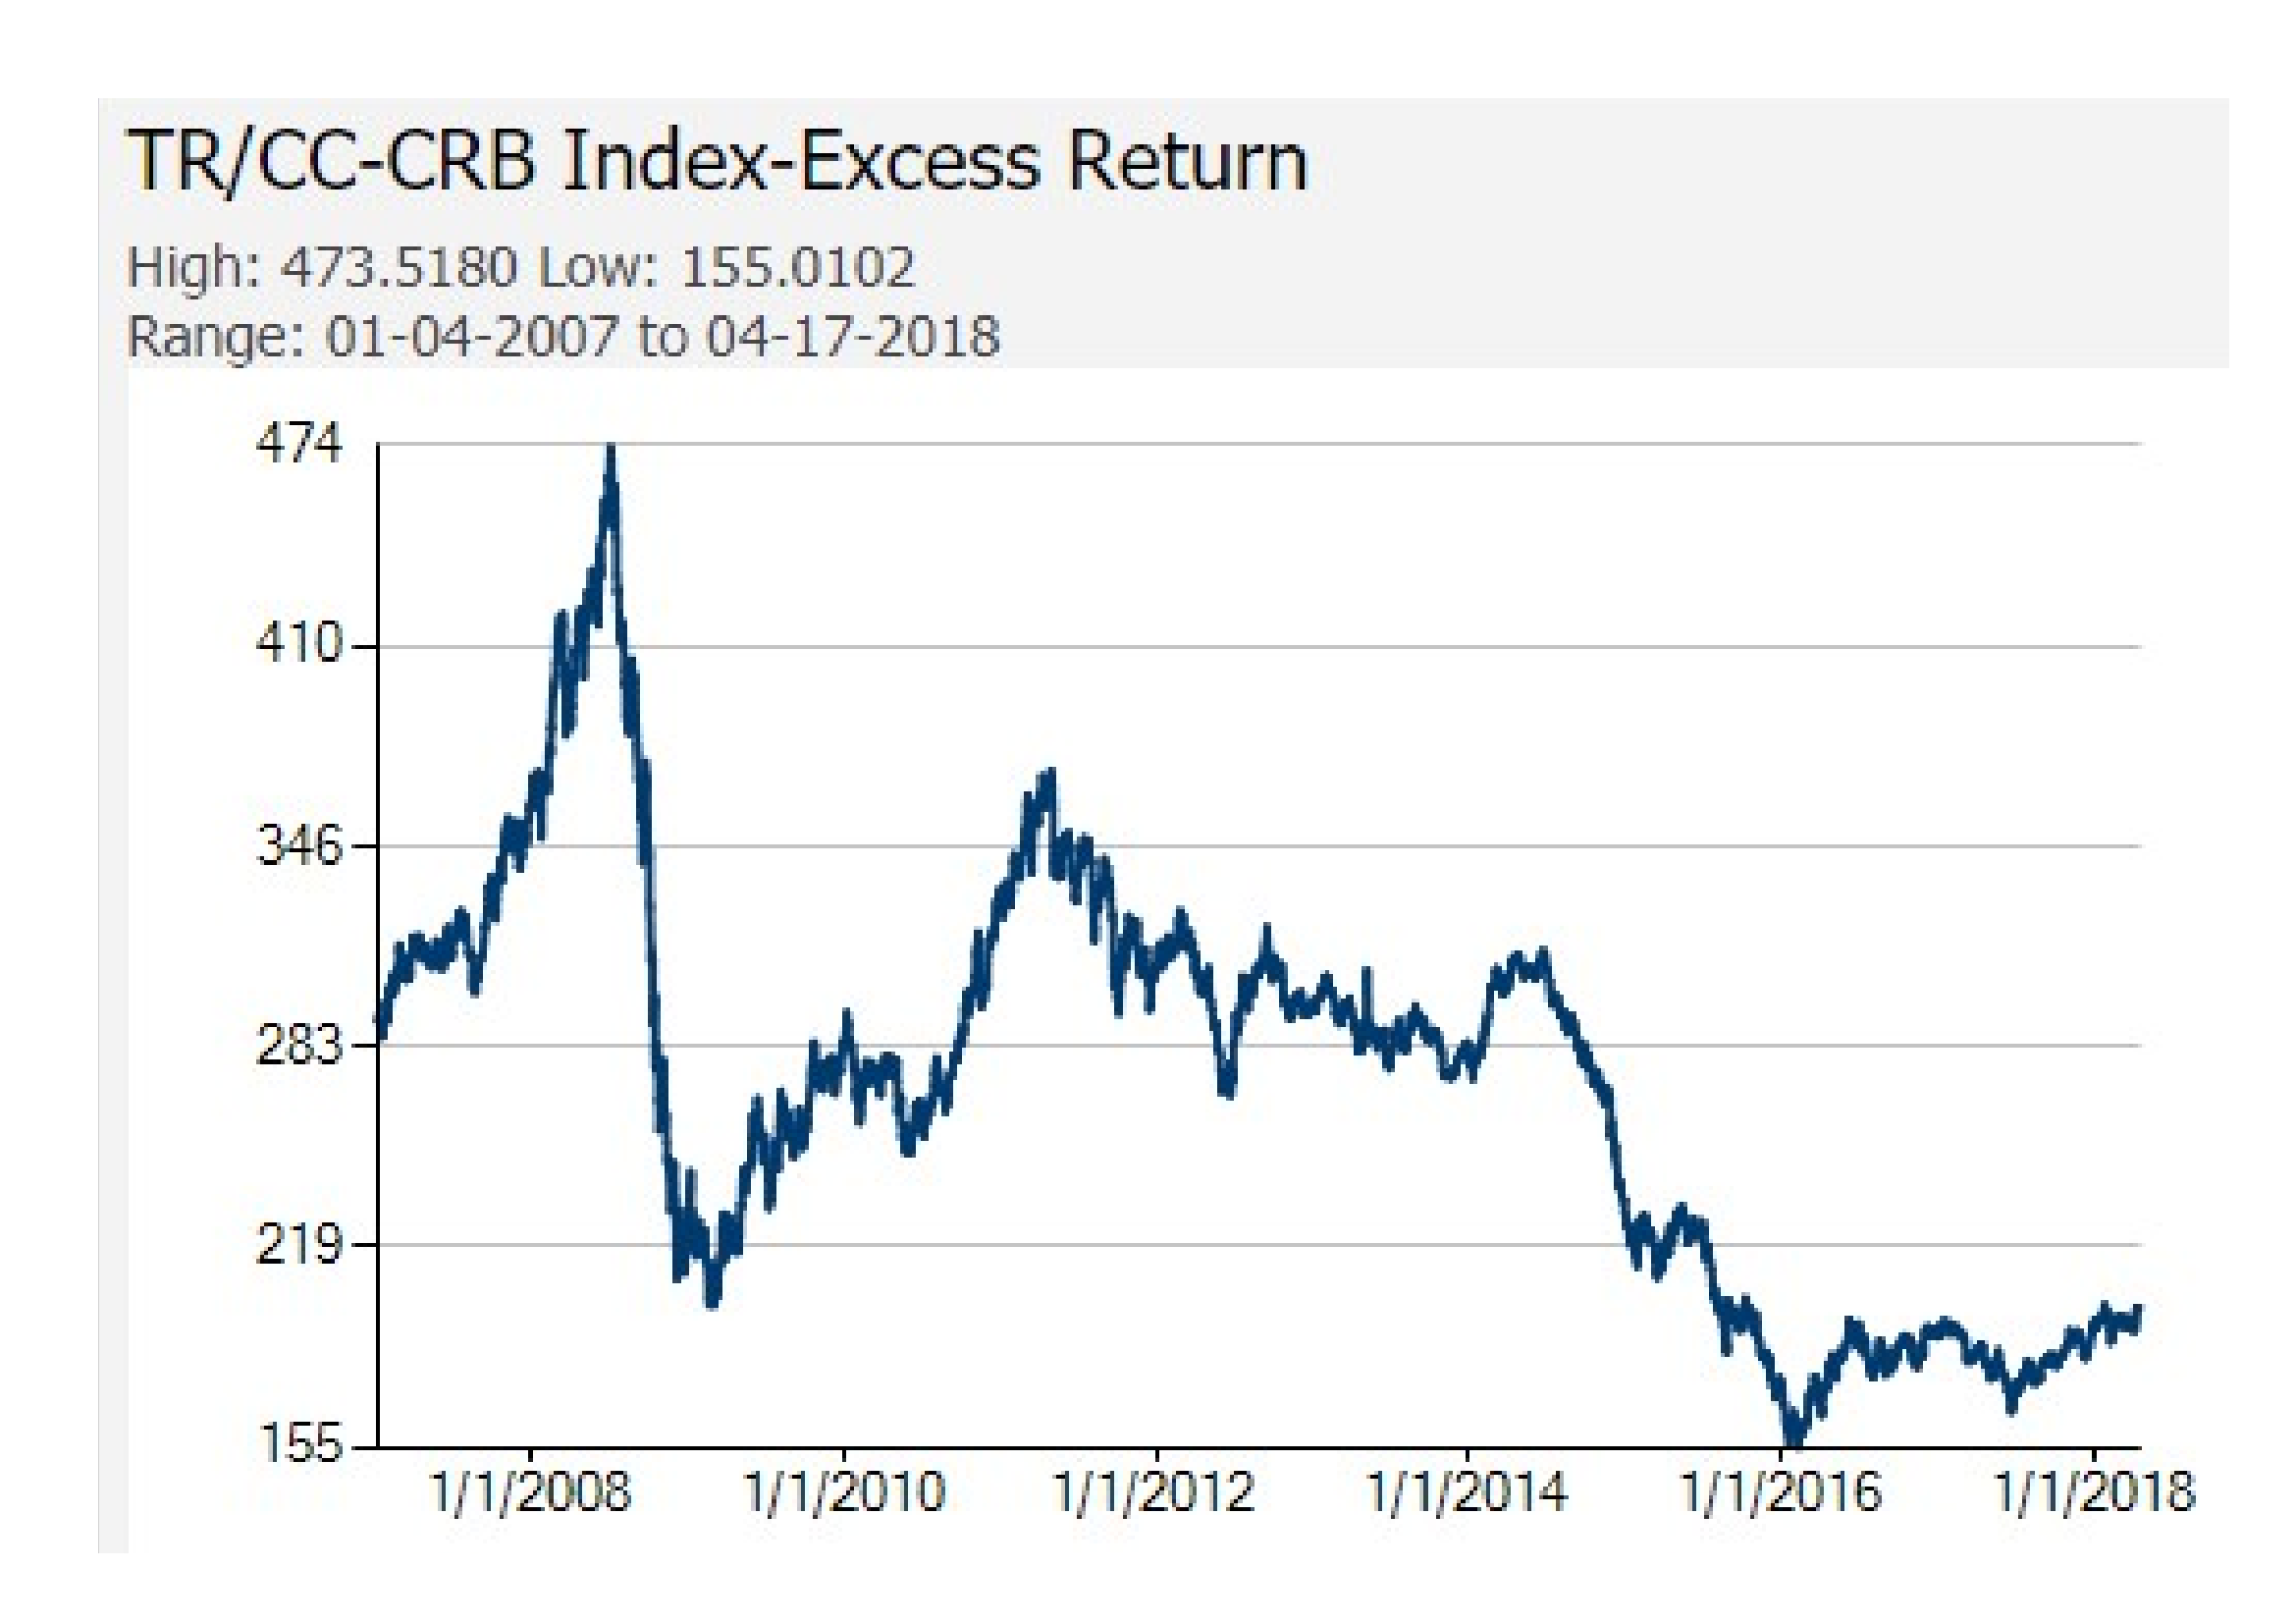
Source: Reuters, Core Commodity Indexes
Neither of these charts suggest that price momentum is that robust.
Another (and, perhaps, more global) measure of economic activity is the Baltic Dry Freight Index. This chart shows a very different reaction to the synchronised increase in world economic growth:-
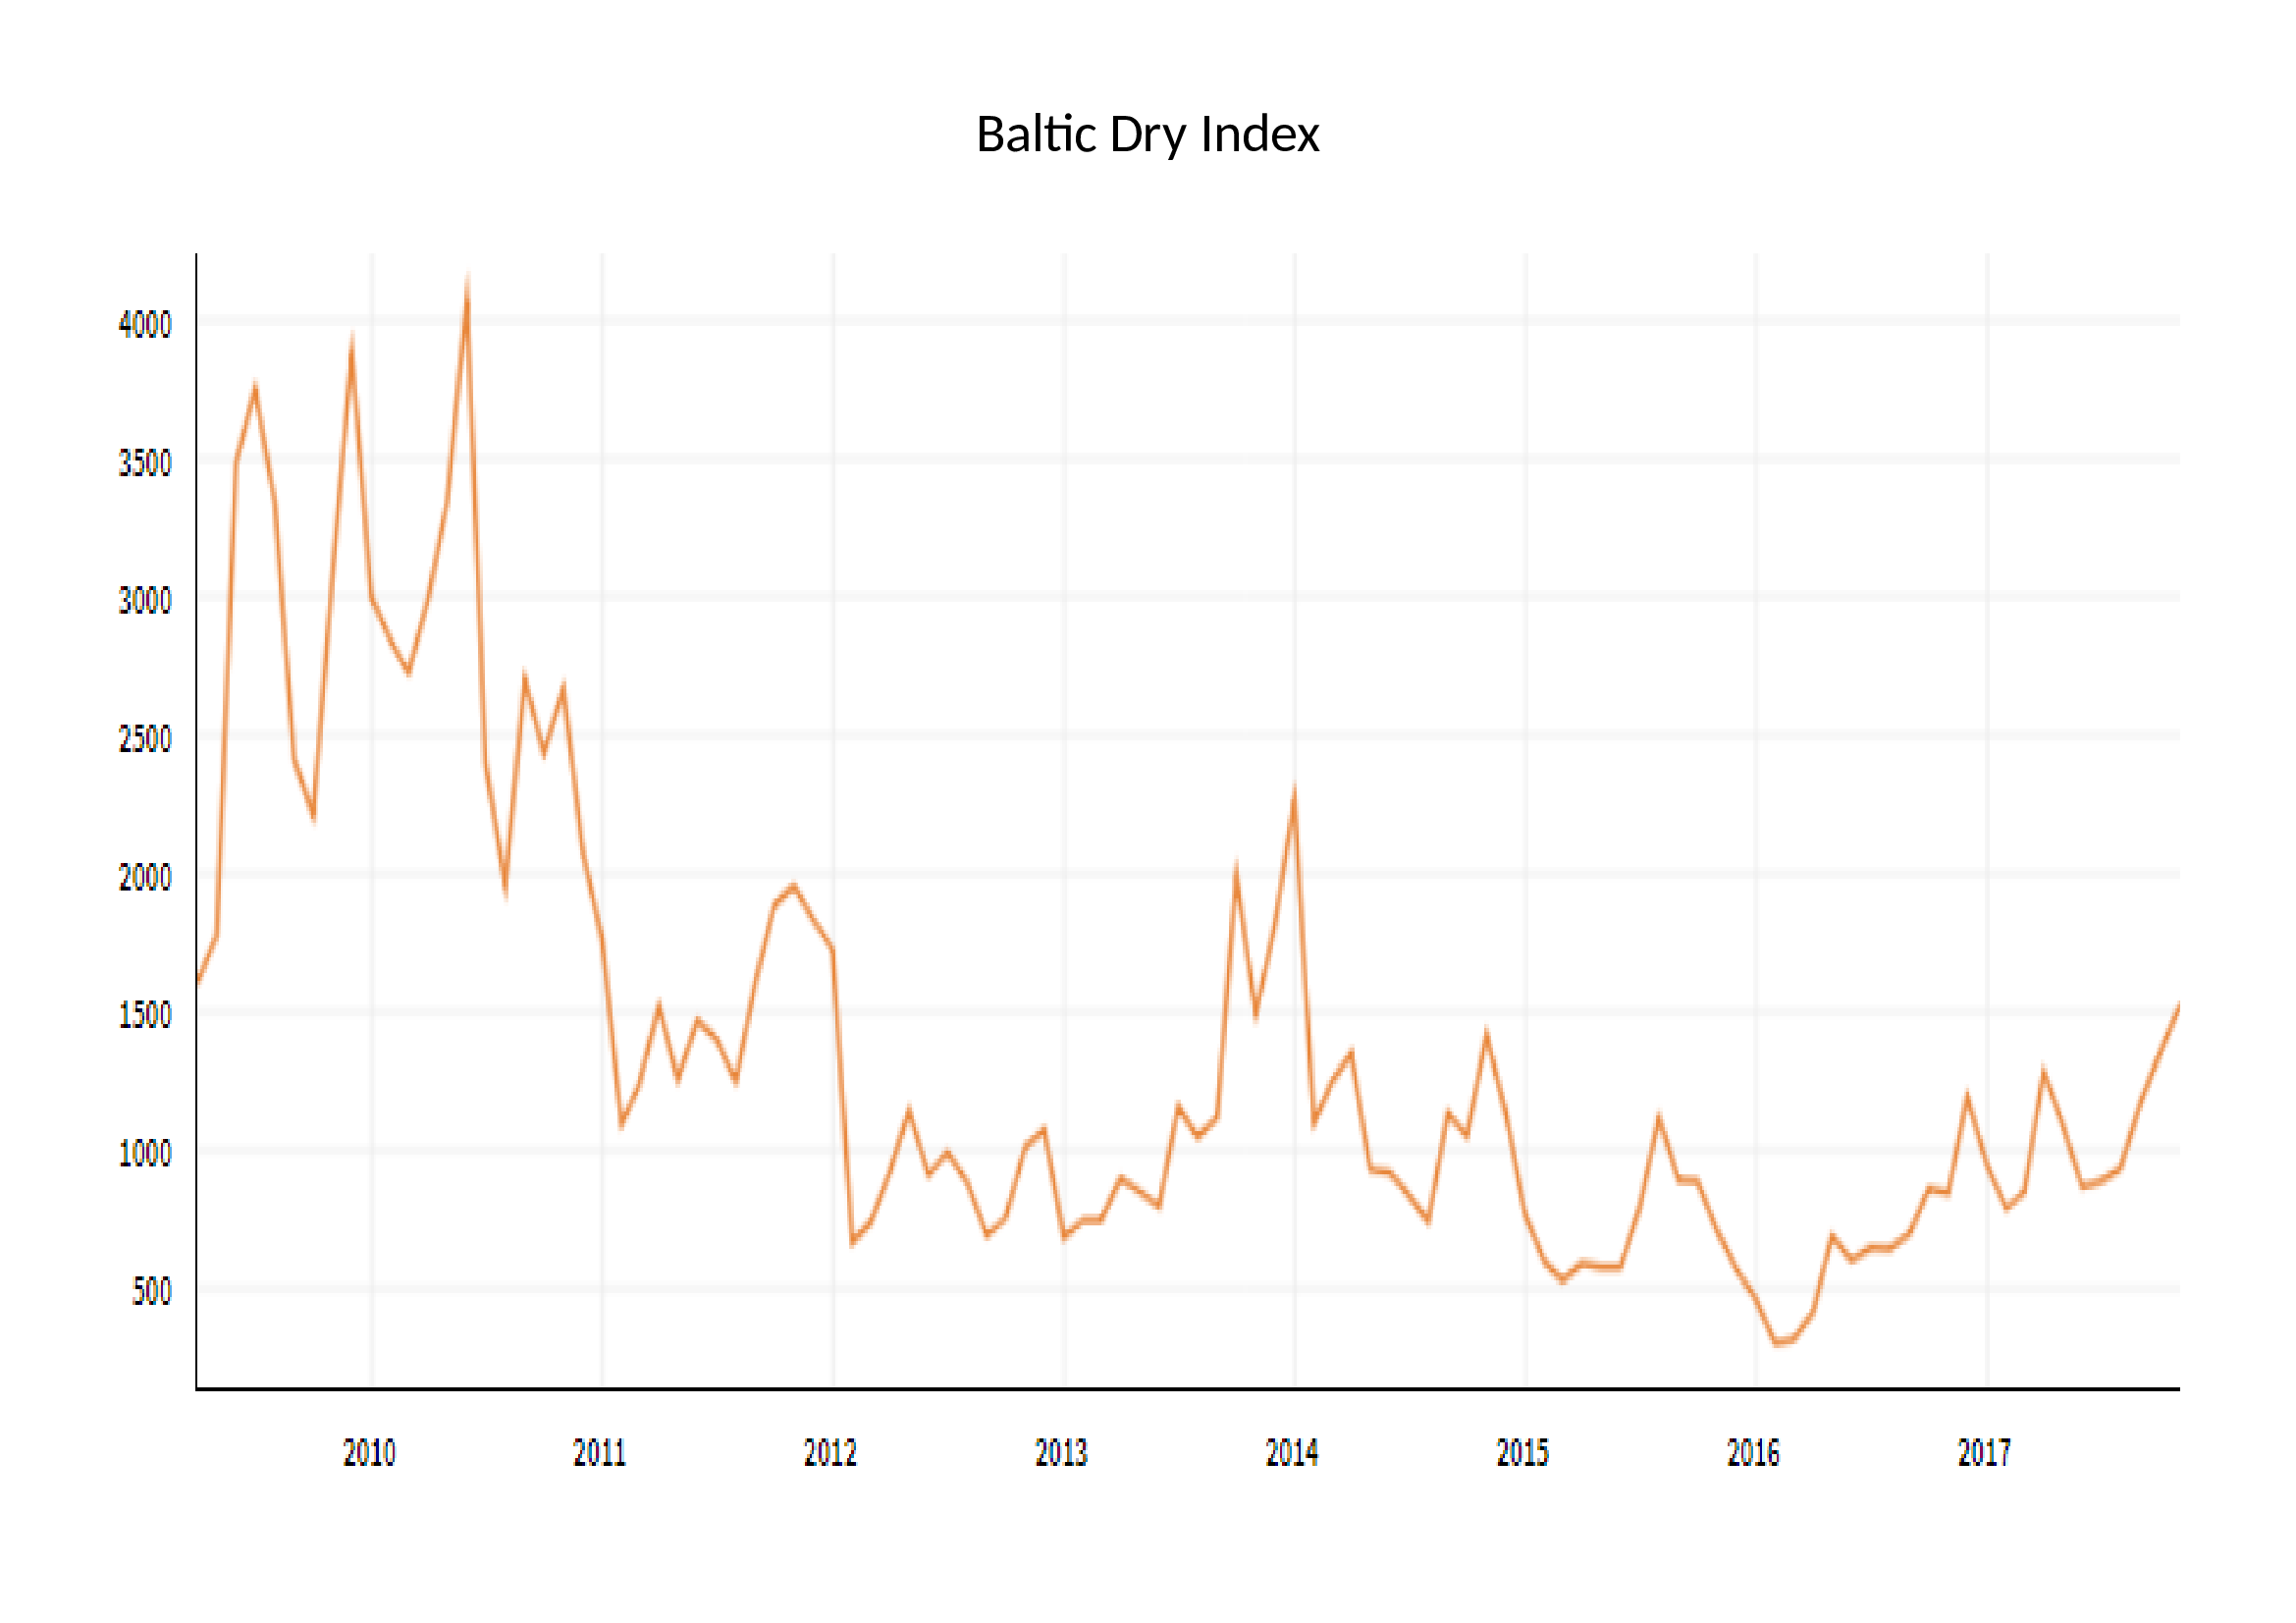
Source: Quandl
In absolute terms the index has more than tripled in price from the 2016 low, nonetheless, it is still in the lower half of the range of the past decade.
Global economic growth may have encouraged a rebound in Copper, another industrial bellwether, but it appears to have lost some momentum of late:-
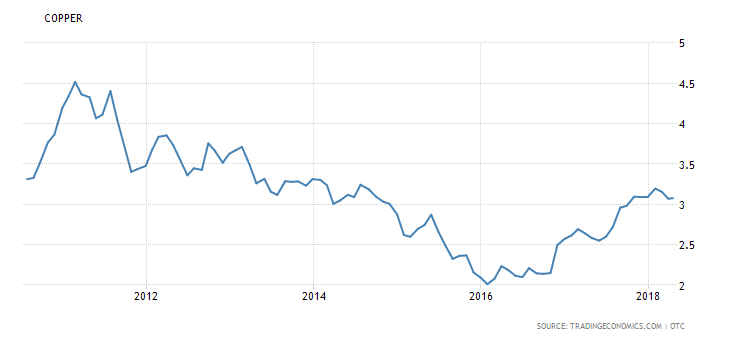
Source: Trading Economics
Brent Crude Oil also appears to be benefitting from the increase in economic activity. It has doubled from its low of two years ago. The US rig count has increased in response but at 800 it remains at half the level of a few years ago:-
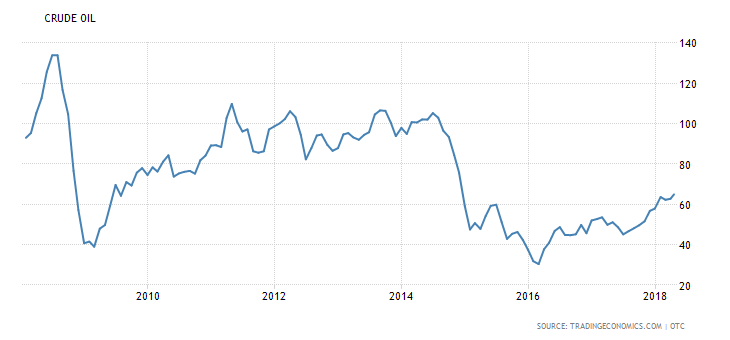
Source: Trading Economics
US Natural Gas, which might still manage an upward price spike on account of the unseasonably cold weather in the US, provides a less compelling argument:-
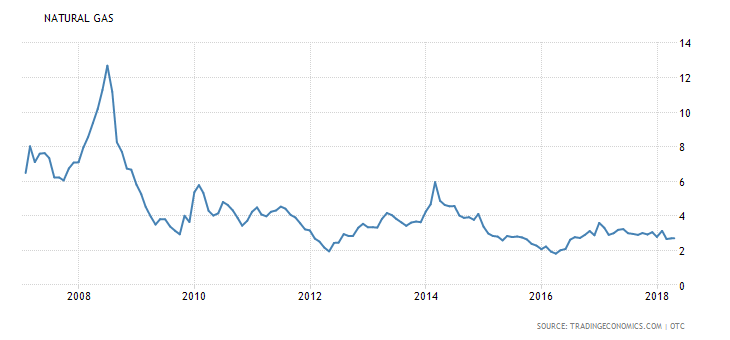
Source: Trading Economics
Commodity markets are clearly off their multi-year lows, but the strength of momentum looks mixed and, in grains and oil seeds, global supply and demand look fairly balanced. Cost push inflation may be a factor in certain markets, but, without price-pull demand, inflation pressures are likely to be short-lived. Late cycle increases in commodity prices are quite common, however, so we may experience a short-run stagflationary squeeze on incomes.
Conclusions and investment opportunities
When ever I write about commodities in a collective way, I remind readers that each market is unique, pretending they are homogenous is often misleading. The recent rise in Cocoa, after a two-year downtrend resulting from an increase in global supply, is a classic example. The time it takes to grow a Cocoa plant governs the length of the cycle. Similarly, the lead time for producing a new ship is a major factor in determining the length of the freight rate cycle. Nonetheless, at the risk of contradicting myself, what may keep a bid under commodity markets is the low level of capital investment which has been a hall-mark of the long, listless recovery from the great financial recession. I believe an economic downturn is likely and job losses will occur rapidly in response.
I entitled this letter ‘Inflation or Employment’, these are the factors which will dominate Central Bank policy. Currently commentators view inflation as the greater concern, as Dr Hunt’s research indicates, but I believe those Central Bankers who can (by which I mean the Federal Reserve) will attempt to insure they have raised interest rates to a level from which they can be cut, rather than having to rely on ever more unorthodox monetary policies.
