Macro Letter – No 68 – 13-01-2017
Equity valuation in a de-globalising world
- The Federal Reserve will raise rates in the coming year
- The positive Yield Gap will vanish but equity markets should still rise
- After an eight year bull market equities are vulnerable to negative shocks
- A value based investment approach is to be favoured even in the current environment
In this Macro Letter I review stock market valuation. I conclude with some general recommendations but the main purpose of my letter is to investigate different methods of valuation and consider the benefits and dangers of diversification. I begin by looking at the US market and the prospects for the US economy. Then I turn to global equity markets, where I consider the benefits and perils of diversification into Frontier stocks. I go on to review global industry sectors, before returning to examine the long term value to be found in developed markets. I finish by looking at the recent outperformance of Value versus Growth.
US Stocks and the Yield Gap
The Equity bull market is entering its eighth year and for US stocks this is the second longest bull-market since WWII – the longest being, between 1987 and 2000. The current bull-market has differed from the 1987-2000 period in that interest rates have fallen throughout the period. Bond yields have also declined to historically low levels. The Yield Gap – the premium of dividend yields over bond yields – which had been inverted since the mid-1950’s, turned positive once more. The chart below shows the yield of the S&P500 and 10yr T-Bonds since 1900:-
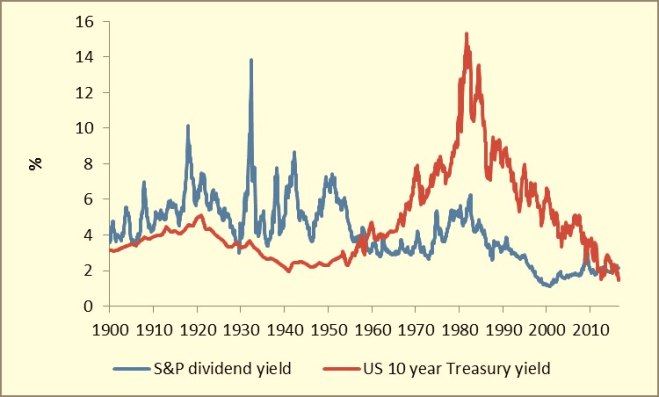
Source: Reuters
What this chart shows most clearly is that the return to a positive Yield Gap has been a function of falling bond yields rather than any substantial rise in dividend pay-out.
The chart below looks at the relationships between the Yield Gap and the real return on US 10yr Treasuries and S&P500 dividends since 1930 – I have used the Implicit Price Deflator as the measure of inflation:-
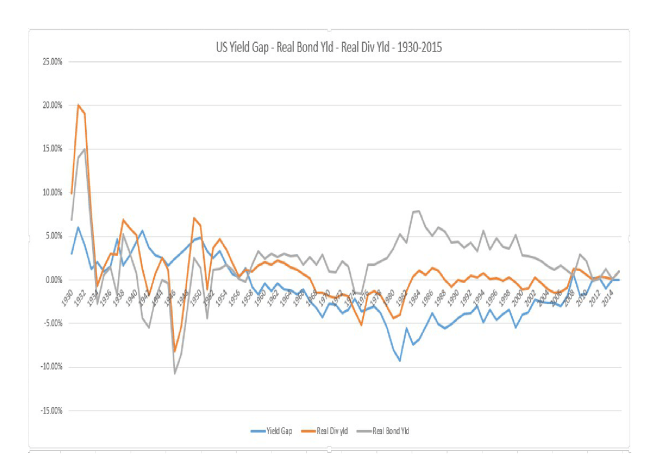
Source: Multpl, St Louis Federal Reserve
The decline in the real dividend yield was a response to rising inflation from the late 1950’s onwards. The return to a positive Yield Gap has been a recent phenomenon. The average Yield Gap since 1900 is -0.51%, since 1930 it has been -1.17%. It has been below its long-run average at -0.37% since 2008. The executive officers of US corporations will continue to favour share buy-backs over increased dividends – I do not expect dividend yields to keep pace with any pick-up in inflation in the near-term, but, share buy-backs will continue to support stocks in general.
S&P 500 forecasts for 2017
What does this mean for the return on the S&P 500 in 2017? According to Bloomberg, the consensus forecast is for a rise of 4% but the range of forecasts is a rather narrow +1.3% to +8.3%. As at the close on 11th January we were already up 1.6% from the 30th December close.
Corporate earnings continue to rise although the pace of increase has moderated. Factset Earning Insight – January 6th – makes the following observations:-
Earnings Growth: For Q4 2016, the estimated earnings growth rate for the S&P 500 is 3.0%. If the index reports earnings growth for Q4, it will mark the first time the index has seen year-over-year growth in earnings for two consecutive quarters since Q4 2014 and Q1 2015.
Earnings Revisions: On September 30, the estimated earnings growth rate for Q4 2016 was 5.2%. Ten of the eleven sectors have lower growth rates today (compared to September 30) due to downward revisions to earnings estimates, led by the Materials sector.
Earnings Guidance: For Q4 2016, 77 S&P 500 companies have issued negative EPS guidance and 34 S&P 500 companies have issued positive EPS guidance.
Valuation: The forward 12-month P/E ratio for the S&P 500 is 17.1. This P/E ratio is above the 5-year average (15.1) and the 10-year average (14.4).
Earnings Scorecard: As of today (with 4% of the companies in the S&P 500 reporting actual results for Q4 2016), 73% of S&P 500 companies have beat the mean EPS estimate and 36% of S&P 500 companies have beat the mean sales estimate.
…For Q1 2017, analysts are projecting earnings growth of 11.0% and revenue growth of 7.9%.
For Q2 2017, analysts are projecting earnings growth of 10.5% and revenue growth of 6.0%.
For all of 2017, analysts are projecting earnings growth of 11.5% and revenue growth of 5.9%.
…At the sector level, the Energy (33.2) sector has the highest forward 12-month P/E ratio, while the Telecom Services (14.2) and Financials (14.2) sectors have the lowest forward 12-month P/E ratios. Nine sectors have forward 12-month P/E ratios that are above their 10-year averages, led by the Energy (33.2 vs. 17.9) sector. One sector (Telecom Services) has a forward 12-month P/E ratio that is below the 10-year average (14.2 vs. 14.6).
Other indicators, which should be supportive for the US economy, include the ISM – PMI Index which is closely correlated to the business cycle. It came in at 54. 7 the highest since November 2014. Here is a 10 year chart:-
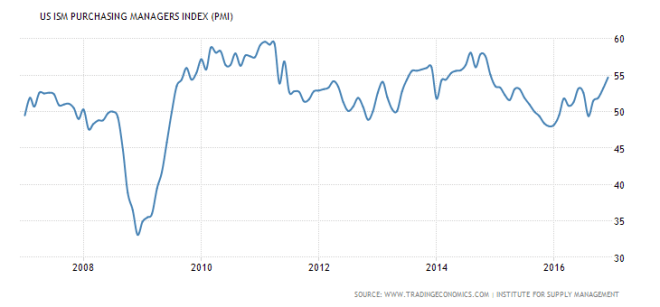
Source: Trading Economics, Institute for Supply Management
A shorter-term indicator for the US economy is the Citigroup Economic Surprise Index – CESI. The chart below suggests that the surprise caused by Trump’s presidential victory is still gathering momentum:-
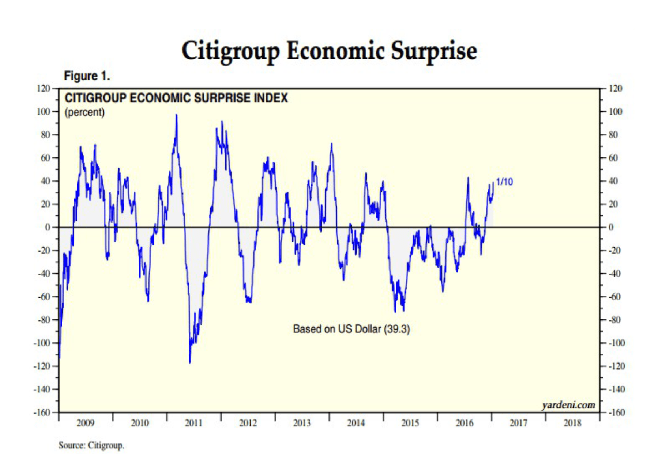
Source: Yardeni, Citigroup
With both the ISM and the CESI indices rising, even the most bearish of macro-economist is likely to be “sceptically positive” on the US economy and this should be supportive for the US stock market.
Global Stocks
I have focussed on the US stock market because of the close correlation between the US and other major stock markets around the world.
As the world becomes less globalised, or as one moves away from the major stock markets, the diversification benefits of a global portfolio, such as the one Andrew Craig describes in his book “How to Own the World”, becomes more enticing. Andrew recommends diversification by asset class, but even a diversified equity portfolio – without the addition of bonds, commodities, real-estate and infrastructure – can offer an enhanced Sharpe Ratio. The table below looks at the three year monthly correlations of emerging and frontier stock markets with a correlation of less than 0.40 to the US market:-
| Country | Correlations < 0.40 to US stocks – 36 months |
| Malawi | -0.12 |
| Iraq | -0.12 |
| Panama | -0.01 |
| Cambodia | 0.00 |
| Rwanda | 0.01 |
| Venezuela | 0.01 |
| Uganda | 0.01 |
| Trinidad and Tobago | 0.02 |
| Tunisia | 0.02 |
| Botswana | 0.07 |
| Mauritius | 0.07 |
| Tanzania | 0.08 |
| Palestine | 0.09 |
| Laos | 0.09 |
| Ghana | 0.10 |
| Zambia | 0.10 |
| Peru | 0.11 |
| Bahrain | 0.13 |
| Jordan | 0.15 |
| Cote D’Ivoire | 0.15 |
| Sri Lanka | 0.16 |
| Argentina | 0.17 |
| Nigeria | 0.17 |
| Qatar | 0.21 |
| Kenya | 0.21 |
| Pakistan | 0.24 |
| Jamaica | 0.24 |
| Oman | 0.25 |
| Colombia | 0.27 |
| Saudi Arabia | 0.31 |
| Kuwait | 0.36 |
| China | 0.37 |
| Bermuda | 0.38 |
| Egypt | 0.38 |
| Vietnam | 0.39 |
Source: Investment Frontier
Many of these stock markets are illiquid or suffer from investment restrictions: but here you will find some of the fastest growing economies in the world. These correlations look beguilingly low but remember that during broad-based market declines short-term correlations tend to rise – the illusory nature of liquidity drives this process. The price of a financial asset is driven by investment flows, cognitive behavioural biases drive investment decisions. Herd instinct rises dramatically when fear replaces greed.
Industry Sectors
The major stock markets also offer opportunities. Looking globally by industry sector there are some attractive longer-term value propositions. The table below ranks the major markets by sector as at 30th December 2016. The sectors have been sorted by trailing P/E ratio (mining and alternative energy P/E data is absent but by other measures mining is relatively cheap):-
| Industry Sector | PE | PC | PB | PS | DY |
| Real Est Serv | 11.2 | 14.9 | 1 | 2.2 | 2.70% |
| Auto | 12.1 | 5.7 | 1.4 | 0.6 | 2.50% |
| Banks | 13.8 | 9.6 | 1.1 | 3.30% | |
| Life Insur | 14.2 | 6.4 | 1.1 | 0.7 | 3.00% |
| Electricity | 14.9 | 5.6 | 1.3 | 1.1 | 4.00% |
| Forest & Paper | 15.1 | 7.1 | 1.6 | 0.9 | 2.90% |
| Nonlife Ins | 16.2 | 10.4 | 1.3 | 1 | 2.40% |
| Financial Serv | 16.7 | 13.8 | 1.8 | 2.3 | 2.20% |
| Telecom (fxd) | 17.5 | 5.5 | 2.3 | 1.4 | 4.20% |
| Travel & Leisure | 17.6 | 9.1 | 2.9 | 1.4 | 2.10% |
| Tech HW & Equ | 18.3 | 10.7 | 3 | 1.8 | 2.30% |
| Chemicals | 18.8 | 10.1 | 2.4 | 1.3 | 2.60% |
| Household Gds | 18.8 | 15 | 2.8 | 1.7 | 2.40% |
| Gen Ind | 19 | 11.3 | 1.9 | 1.1 | 2.40% |
| REITs | 20.4 | 16.7 | 1.7 | 7.7 | 4.50% |
| Construction | 20.9 | 11.4 | 1.9 | 0.9 | 2.10% |
| Telecom (mob) | 21.4 | 5.6 | 1.9 | 1.5 | 3.30% |
| Tobacco | 21.5 | 21.1 | 9.8 | 4.9 | 3.60% |
| Media | 21.6 | 10.9 | 2.9 | 2 | 2.10% |
| Food Retail | 21.6 | 10.2 | 2.8 | 0.4 | 2.00% |
| Eltro & Elect Equ | 21.7 | 12.2 | 2.2 | 1 | 1.70% |
| Pharma & Bio | 22.4 | 16.3 | 3.4 | 3.5 | 2.30% |
| Food Prod | 23.2 | 14.3 | 2.6 | 1.2 | 2.20% |
| Healthcare | 23.7 | 13.1 | 3.2 | 1.4 | 1.10% |
| Leisure Gds | 23.9 | 8.4 | 2 | 1.1 | 1.20% |
| Inds Transport | 23.9 | 10.4 | 2.5 | 1.3 | 2.50% |
| Aero & Def | 23.9 | 14.9 | 5 | 1.3 | 2.10% |
| Inds Eng | 24.6 | 12.4 | 2.5 | 1.1 | 2.00% |
| Personal Gds | 24.7 | 16.8 | 4.3 | 2 | 2.00% |
| Gen Retail | 25.8 | 14 | 4.2 | 1 | 1.70% |
| Support Serv | 26.4 | 11.9 | 2.8 | 1.1 | 1.90% |
| Beverages | 27 | 14.9 | 4.2 | 2.4 | 2.70% |
| SW & Comp Serv | 27.3 | 15.9 | 4.5 | 3.8 | 1.10% |
| Oil Service | 73.9 | 11.8 | 1.9 | 1.7 | 3.70% |
| Oil&Gas Prod | 116.9 | 8.2 | 1.4 | 1 | 3.10% |
| Inds Metal | 165.7 | 7.7 | 1.1 | 0.7 | 2.40% |
| Mining | 8.9 | 1.6 | 1.5 | 1.90% | |
| Alt Energy | 10.5 | 1.7 | 0.9 | 1.20% |
Source: Star Capital
A number of sectors have been out of favour since 2008 and may remain so in 2017 but it is useful to know where under-performance can be found.
Developed Market Opportunities
At a country level there is better long-term valuation to be found outside the US, even among the developed countries. Here is Star Capital’s 10 to 15 year total annual return forecast for the major markets and regions:-
| Country | CAPE | Forecast | PB | Forecast | ø Forecast |
| Italy | 12.7 | 9.10% | 1.2 | 10.40% | 9.70% |
| Spain | 11.7 | 9.70% | 1.4 | 8.80% | 9.30% |
| United Kingdom | 14.8 | 8.00% | 1.8 | 7.20% | 7.60% |
| France | 18.3 | 6.60% | 1.6 | 8.10% | 7.30% |
| Australia | 16.8 | 7.10% | 2 | 6.60% | 6.90% |
| Germany | 18.6 | 6.40% | 1.8 | 7.40% | 6.90% |
| Japan | 24.9 | 4.40% | 1.3 | 9.40% | 6.90% |
| Netherlands | 19.8 | 6.00% | 1.8 | 7.20% | 6.60% |
| Canada | 20.5 | 5.70% | 1.9 | 6.90% | 6.30% |
| Sweden | 20.6 | 5.70% | 2.1 | 6.20% | 5.90% |
| Switzerland | 21.5 | 5.40% | 2.4 | 5.30% | 5.30% |
| United States | 26.4 | 4.00% | 2.9 | 4.10% | 4.00% |
| Emerging Markets | 14 | 8.40% | 1.6 | 7.90% | 8.20% |
| Developed Europe | 16.6 | 7.20% | 1.8 | 7.40% | 7.30% |
| World AC | 20.8 | 5.60% | 2 | 6.70% | 6.20% |
| Developed Markets | 21.9 | 5.30% | 2 | 6.50% | 5.90% |
Source: Star Capital, Bloomberg, Reuters
I have sorted this data based on Star Capital’s composite annual return forecast. The first three countries, Italy, Spain and the UK, all face uncertainty linked to the future of the EU. Interestingly Switzerland offers better long-term returns than the US – with considerably less currency risk for the international investor.
Value Investing
Since the financial crisis in 2008 through to 2015 Growth stocks outperformed Value stocks. I predict a sea-change. The fathers of Value Investing, Ben Graham and David Dodd first published Securities Analysis in 1934. Towards the end of his career Graham opined (emphasis is mine):-
I am no longer an advocate of elaborate techniques of security analysis in order to find superior value opportunities. This was a rewarding activity, say, 40 years ago, when our textbook “Graham and Dodd” was first published; but the situation has changed a great deal since then. In the old days any well-trained security analyst could do a good professional job of selecting undervalued issues through detailed studies; but in the light of the enormous amount of research now being carried on, I doubt whether in most cases such extensive efforts will generate sufficiently superior selections to justify their cost. To that very limited extent, I’m on the side of the “efficient market” school of thought now generally accepted by the professors.
As we embrace the “Big Data” era, the cost of analysing vast amounts of data will collapse, whilst, at the same time, the amount of available data will grow exponentially. I believe we are at the dawn of a new age for Value Investing where the quantitative analysis of a vast array of qualitative factors will allow investors to defy the Efficient Market Hypothesis, even if we cannot satisfactorily refute Eugene Fama’s premise. In 2016, for the first time in seven years, Value beat Growth across all major categories:-
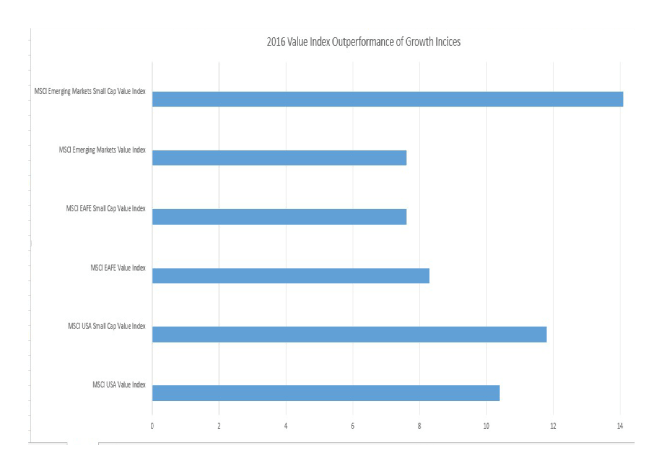
Source: MSCI, Bloomberg
Value stocks tend to exhibit higher volatility than growth stocks, but volatility is only one aspect of risk: buying Value offers long-term protection, especially during an economic downturn. According to Bloomberg’s Nir Kaissar, Value has consistently underperformed Growth since the financial crisis except in US Small Cap’s – his article – Value Investing Hits Back – is insightful.
Conclusion and Investment Opportunities
When I first began investing in stocks the one of the general rules was to buy when the P/E ratio was below 10 and sell when it rose above 20. Today, of the world’s major stock markets, only Russia and China offer single digit P/Es – low ratios are a structural feature of these markets. I wrote about Russia last month in – Russia – Will the Bear come in from the cold? My conclusion was that one should be cautiously optimistic:-
The Russian stock market has already factored in much of the positive economic and political news. The OPEC deal took shape in a series of well publicised stages. The “Trump Effect” is unlikely to be as significant as some commentators hope. The ending of sanctions is the one factor which could act as a positive price shock, however, the Russian economy has suffered a severe recession and now appears to be recovering of its own accord.
Interest rates in the US will rise, though probably not by as much, nor as quickly as the market is currently betting. A value based approach to stock selection offers greater protection and greater return in the long run.
The US stock market continues to rise. The US economy looks set to grow more rapidly in 2017 due to tax cuts and fiscal stimulus, but, for international companies which export to the US, the threat of protectionism is likely to temper enthusiasm for their stocks.
US financial services firms were a big winner after the Trump election result, they should continue to benefit even as interest rates increase – yield curves will steepen, increasing return on capital. US telecommunications stocks have a performed well since the election along with biotechnology – I have no specific view on these industries. Energy stocks have also rallied, perhaps as much on the OPEC deal as the Trump triumph – many new technologies are starting to be implemented by the energy industry but enthusiasm for these stocks may be tempered by a decline in oil prices once the rig count rebounds. The Baker-Hughes Rig Count ended the year at 525 up from a low of 316 in May. The old high of 1,609 was set back in October 2014 – there is plenty of spare capacity which will exert downward pressure on oil prices.
Indian economic growth will outpace China for another year. Despite a weakening Chinese Yuan, Vietnam remains competitive – it is on the cusp of moving from Frontier to Emerging Market status. Indonesia also looks likely to perform well during 2017, GDP forecasts are around 5%; however, Indonesia’s strong reliance on commodity exports makes it more vulnerable than some of its South and East Asian neighbours.