Will technology change the prospects for emerging market growth?

Will technology change the prospects for emerging market growth?

400dpiLogo

Macro Letter – No 75 – 21-04-2017

Will technology change the prospects for emerging market growth?

  • The challenge to low-cost manufacturing in emerging markets is from technology
  • Some industries will benefit but many jobs will be displaced globally
  • The mercantilist model of emerging market growth will need to adapt
  • Technology will solve some of the demographic challenges of the developed world

In July 2016 the International Labor Organisation (ILO) released a report entitled – ASEAN in Transformationin the preface it relates the apocryphal story of a 1950’s conversation between Henry Ford, Chairman of Ford Motor Company, and Walter Reuther, Leader of the United Automobile Workers Union.

Ford asked, “Walter, how are you going to get those robots to pay your union dues?” to which Reuther responded, “Henry, how are you going to get them to buy your cars?” It reminds us that disruptive technology is not new. As the latest wave of innovation begins to disrupt employment globally, it makes sense to reassess the prospects for some of the world’s fastest growing economies.

The ILO report goes on to focus on the impact of technology on ASEAN countries, a region with 632mln people. This is an under-researched topic. They highlight the industries which are most likely to be affected and suggest ways countries can adapt to minimise the impact of automation on employment. This is their conclusion:-

Considerable opportunities for growth exist within ASEAN. Importantly, the local domestic market is expanding, and ASEAN’s middle class is expected to grow to 125 million by 2025. This represents a massive and emerging regional market.

However, threats remain, and in some cases, are intensifying. In particular, a range of labour-intensive sectors in a number of less developed countries are susceptible to major technological disruption, leading to potential large-scale job displacement. The consequences for these countries could be profoundly negative if they are unprepared to adapt.

We are witnessing the emergence of new markets, the potential relocation of production, the rise of new hiring trends and the displacement of lower skilled jobs. Supplying workers with the appropriate skills and competencies remains a major challenge. Overall, concerted efforts are required from all ASEAN stakeholders. They should act now to build a future of innovation and growth shaped with better employment opportunities.

The World Bank Development Report 2016 – Digital Dividends provides a global perspective. Here are a couple of graphs which illuminate the challenging landscape:-

World_Bank_-_Impact_of_Automation_on_employment_20

Source: World Bank

If the unadjusted percentages indicated in the graph above are realised the social and political stability of many countries maybe undermined, however, the next graph shows which occupations are likely to be most at risk. It also shows which occupations can be expected to benefit from the productivity enhancing impact of new technology:-

World_Bank_-_probability_of_being_computerised_and

Source: World Bank

Educational challenge

Be an expensive complement (stats knowhow) to something that’s getting cheaper (data).

—Hal Varian, Chief Economist, Google, 2014

Going back to the ILO report, the key to creating workers with the correct skills is designing appropriate education. According to Asian Nation:-

50.5% Asians, age 25 and older, who have a bachelor’s degree or higher level of education. Asians have the highest proportion of college graduates of any race or ethnic group in the country and this compares with 28 percent for all Americans 25 and older.

This graph shows the educational attainment across ASEAN:-

ASEAN_Student_Survey_-_ILO

Source: ILO

Singapore scores highly but so does Cambodia, however, it is the low skilled worker who will suffer; the retraining challenges, for Asia and elsewhere, will be substantial. More than 60% of salaried workers in Indonesia and 73% in Thailand are at risk from automation. The highest risk group are employed in Textiles, Clothing and Footware.  More than 9mln people are employed in this sector across ASEAN and the ILO estimate that 64% are at risk in Indonesia, 86% in Vietnam whilst in Cambodia that figure rises to 88%.

Business Process Outsourcing (BPO) is another industry which is ripe for automation. There is a heavy concentration of BPO in the Philippines where more than 1mln salaried working are employed. The ILO estimate that 89% are at risk from automation.

Earlier this year I discussed the demise of China as a low-cost manufacturing hub in – Low cost manufacturing in Asia – The Mighty Five – MITI V – Malaysia, India, Thailand, Indonesia and Vietnam. I concluded:-

Vietnamese stocks look attractive, the country has the highest level of FDI of the group (6.1% of GDP) but there is a favourable case for investing in the stocks of the other members of the MITI V, even with FDI nearer 3%. They all have favourable demographics, except perhaps Thailand, and its age dependency ratio is quite low. High literacy, above 90% in all except India, should also be advantageous.

Over the next few years I remain confident about these economies but the headwinds of technology will blow through these markets, nonetheless. Low cost manufacturing has to be set alongside, efficient inventory management and transit costs. In the apparel industry, where trends change in a rapid and unpredictable fashion, the advantage of fast design to production lead times makes the benefits of robotic production, geographically close to the consumer, much more alluring.

In a fascinating post on LinkedIn – Robots Take Over – The Apparel Production – Susanna Koelblin – discusses the decision by Adidas to transfer a part of the production of their sports shoes back to Germany for the first time in more than 20 years. Another “Speed factory” will open in the US later this year. Here are some of her observations:-

It took 50 years for the world to install the first million industrial robots. The next million will take only eight. Importantly, much of the recent growth happened in particular in China, which has an aging population and where wages have risen…

German robot maker Kuka, acquired last year by China’s Midea, estimates a typical industrial robot costs about 5 euros an hour. Manufacturers spend 50 euros an hour to employ someone in Germany and about 10 euros an hour in China. Rather than seek out an even cheaper source of labor elsewhere – in another emerging Asian economy, say – Chinese manufacturers are choosing to install more robots, especially for more complex tasks. China isn’t getting rid of the work, just the workers…

It is in fact China which is leading the world in terms of the installation of industrial robots, but relative to the size of its workforce these concentrations are still relatively low. China boasts 4.9 robots/1,000 workers while Germany tops the world ranking at 30.1/1,000. That is almost twice the concentration of the US and four times that of the UK.

The current level of earnings in manufacturing still favours the work force of the MITI V but as the cost of automation continues to fall and average earnings in, lower cost Asia, rises, an inflection point will be reached:-

Wage_costs_-_inflation_and_currency_MITI_V_-_Tradi

Source: Trading Economics

Manufacturing wage inflation has been high in Indonesia partly in response to earlier currency depreciations – over 10 years the Rupiah has declined by 46% against the US$ whilst manufacturing wages have increased by 164%. All these emerging economies maintain a manufacturing cost advantage relative to robotic automation, however, for countries like Malaysia, which has seen its currency decline by 46.7% over the last five years, whilst manufacturing wages have only risen by 37.6%, the competitive advantage versus robotic automation is narrowing. Malaysia now has a manufacturing wage cost which is slightly higher than China’s.

Interestingly, India has seen a real-terms improvement in export competitiveness. Its currency has fallen 21.4% over five years but manufacturing wages have only risen by 14.6%. Vietnam and Thailand have seen export competitiveness decline, yet in both cases they have had considerable room for manoeuvre.

I am in agreement with Dr. Jing Bing Zhang, Research Director of IDC Worldwide Robotics, we should not be worried about automation derailing the emerging market growth model over the next decade. This is what he said in a recent interview with the Diplomat:-

There are different schools of thought…  From my research, I don’t see it. Maybe we will be less dependent on human labor. But there is no way this will eliminate the need for people in the next 15-20 years. We are entering high speed growth for robotics but in 2014 global density for robotics was still very low at 66 per 10,000 employees, 36 in China, 57 in Thailand, and close to none in India.

The uptake of robots does not appear to have damaged employment in Germany where unemployment recently dipped below 4%, the lowest level since 1981. One can argue that demographic forces are at work here but Germany has the highest concentration of robots relative to workers globally.

Chatham House – Robots and pensioners to the rescue – examines a different aspect of automation and demographics, focussing on Japan:-

Bleak demographics saddle Japan with a potential growth rate of less than 1 per cent, economists say, unless there are aggressive moves to accept more immigrants, boost the role of women in the workforce and overhaul workplace inefficiencies to increase productivity.

Yet despite its real and chronic problems, Japan may arguably be faring better than the image often projected of a country on the brink of an abyss. Japan still feels safe, prosperous and dazzlingly futuristic. While the overall economy has stagnated, GDP per head has outperformed most of the developed world, including Germany and France, according to World Bank figures − partly a consequence of the population crunch…

Most importantly, a shrinking population fosters innovation to boost productivity. Writing in the Financial Times, Michael Lind, a senior fellow at New America, a Washington think-tank, argued that a labour shortage can be a blessing rather than a curse: ‘Where labour is scarce and expensive, businesses have an incentive to invest in labour-saving technology,’ he wrote, ‘which boosts productivity growth by enabling fewer workers to produce more.’

That is precisely what is happening in today’s Japan, with investment pouring into robotics, industrial automation and artificial intelligence. Furuta notes that a similar phenomenon took place in 18th-century Japan, under the Tokugawa shoguns, when sharp population declines due to famine and natural disaster spurred an age of innovation in science, the arts and agriculture. Such thinking has prompted Prime Minister Abe to embrace the idea that Japan’s population crunch may have a silver lining: ‘Japan may be losing its population. But these are incentives,’ Abe said in a speech last year. ‘Japan’s demography, paradoxically, is not an onus, but a bonus.’

In my previous Macro Letter – No 72 – Low cost manufacturing in Asia – The Mighty Five – MITI VI reproduced the latest Deloitte Global Manufacturing Competitiveness Index, here it is again:-

Deloitte_-_gx-us-global-manufacturing-table-rankin

Source: Deloitte

The MITI V are all expected to rise up the competitiveness ranking over the next three years – with the exception of Thailand which remains unchanged in 14th place.

I remain optimistic about emerging market growth, but keep in mind the industries which will benefit from technology and those which will be harmed. For example, the software developers of India look well placed to thrive; the garment workers of China may not.

Central Banks – Ah Aaaaahhh! – Saviours of the Universe?

400dpiLogo

Macro Letter – No 48 – 29-01-2016

Central Banks – Ah Aaaaahhh! – Saviours of the Universe?

Flash-Gordon-flash-gordon-23432257-1014-1600

Copryright: Universal Pictures

  • Freight rates have fallen below 2008 levels
  • With the oil price below $30 many US producers are unprofitable
  • The Fed has tightened but global QE gathers pace
  • Chinese stimulus is fighting domestic strong headwinds

Just in case you’re not familiar with it here is a You Tube video of the famous Queen song. It is seven years since the Great Financial Crisis; major stock markets are still relatively close to their highs and major government bond yields remain near historic lows. If another crisis is about to engulf the developed world, do the central banks (CBs) have the means to avert catastrophe once again? Here are some of the factors which may help us to reach a conclusion.

Freight Rates

Last week I was asked to comment of the prospects for commodity prices, especially energy. Setting aside the geo-politics of oil production, I looked at the Baltic Dry Index (BDI) which has been plumbing fresh depths this year – 337 (28/1/16) down from August 2015 highs of 1200. Back in May 2008 it touched 11,440 – only to plummet to 715 by November of the same year. How helpful is the BDI at predicting the direction of the economy? Not very – as this 2009 article from Business Insider – Shipping Rates Are Lousy For Predicting The Economy – points out. Nonetheless, the weakness in freight rates is indicative of an inherent lack of demand for goods. The chart below is from an article published by Zero Hedge at the beginning of January – they quote research from Deutsche Bank.

BDI_-_1985_-_2016 (4)

Source: Zerohedge

A “Perfect Storm Is Coming” Deutsche Warns As Baltic Dry Falls To New Record Low:

…a “perfect storm” is brewing in the dry bulk industry, as year-end improvements in rates failed to materialize, which indicates a looming surge in bankruptcies.

The improvement in dry bulk rates we expected into year-end has not materialized.

…we believe a number of dry bulk companies are contemplating asset sales to raise liquidity, lower daily cash burn, and reduce capital commitments. The glut of “for sale” tonnage has negative implications for asset and equity values. More critically, it can easily lead to breaches in loan-to-value covenants at many dry bulk companies, shortening the cash runway and likely necessitating additional dilutive actions.

Dry bulk companies generally have enough cash for the next 1yr or so, but most are not well positioned for another leg down in asset values.

China

The slowing and rebalancing of the Chinese economy may be having a significant impact on global trade flows. Here is a recent article on the subject from Mauldin Economics – China’s Year of the Monkees:-

China isn’t the only reason markets got off to a terrible start this month, but it is definitely a big factor (at least psychologically). Between impractical circuit breakers, weaker economic data, stronger capital controls, and renewed currency confusion, China has investors everywhere scratching their heads.

When we focused on China back in August (see “When China Stopped Acting Chinese”), my best sources said the Chinese economy was on a much better footing than its stock market, which was in utter chaos. While the manufacturing sector was clearly in a slump, the services sector was pulling more than its fair share of the GDP load. Those same sources have new data now, which leads them to quite different conclusions.

…Now, it may well be the case that China’s economy is faltering, but its GDP data is not the best evidence.

…To whom can we turn for reliable data? My go-to source is Leland Miller and company at the China Beige Book.

…China Beige Book started collecting data in 2010. For the entire time since then, the Chinese economy has been in what Leland calls “stable deceleration.” Slowing down, but in an orderly way that has generally avoided anything resembling crisis. 

…China Beige Book noticed in mid-2014 that Chinese businesses had changed their behavior. Instead of responding to slower growth by doubling down and building more capacity, they did the rational thing (at least from a Western point of view): they curbed capital investment and hoarded cash. With Beijing still injecting cash that businesses refused to spend, the liquidity that flowed into Chinese stocks produced the massive rally that peaked in mid-2015. It also allowed money to begin to flow offshore in larger amounts. I mean really massively larger amounts.

Dealing with a Different China

China Beige Book’s fourth-quarter report revealed a rude interruption to the positive “stable deceleration” trend. Their observers in cities all over that vast country reported weakness in every sector of the economy. Capital expenditures dropped sharply; there were signs of price deflation and labor market weakness; and both manufacturing and service activity slowed markedly.

That last point deserves some comment. China experts everywhere tell us the country is transitioning from manufacturing for export to supplying consumer-driven services. So if both manufacturing and service activity are slowing, is that transition still happening?

The answer might be “yes” if manufacturing were decelerating faster than services. For this purpose, relative growth is what counts. Unfortunately, manufacturing is slowing while service activity is not picking up all the slack. That’s not the combination we want to see.

Something else China Beige Book noticed last quarter: both business and consumer loan volume did not grow in response to lower interest rates. That’s an important change, and probably not a good one. It means monetary stimulus from Beijing can’t save the day this time. Leland thinks fiscal stimulus isn’t likely to help, either. Like other governments and their central banks, China is running out of economic ammunition.

Mauldin goes on to discuss the devaluation of the RMB – which I also discussed in my last letter – Is the ascension of the RMB to the SDR basket more than merely symbolic? The RMB has been closely pegged to the US$ since 1978 though with more latitude since 2005, this has meant a steady appreciation in its currency relative to many of its emerging market trading partners. Now, as China begins to move towards full convertibility, the RMB will begin to float more freely. Here is a five year chart of the Indian Rupee and the CNY vs the US$:-

INR vs RMB - Yahoo

Source: Yahoo finance

The Chinese currency could sink significantly should their government deem it necessary, however, expectations of a collapse of growth in China may be premature as this article from the Peterson Institute – The Price of Oil, China, and Stock Market Herding – indicates:-

A collapse of growth in China would indeed be a world changing event. But there is just no evidence of such a collapse. At most there is suggestive evidence of a mild slowdown, and even that is far from certain. The mechanical effects of such a mild decrease on the US economy should, by all accounts, and all the models we have, be limited. Trade channels are limited (US exports to China represent less than 2 percent of GDP), and so are financial linkages. The main effect of a slowdown in China would be through lower commodity prices, which should help rather than hurt the United States.

Peterson go on to suggest:-

Maybe we should not believe the market commentaries. Maybe it was neither oil nor China. Maybe what we are seeing is a delayed reaction to the slowdown in the world economy, a slowdown that has now gone on for a few years. While there has been no significant news in the last two weeks, maybe markets are only realizing that growth in emerging markets will be lower for a long time, that growth in advanced economies will be unexciting. Maybe…

I think the explanation is largely elsewhere. I believe that to a large extent, herding is at play. If other investors sell, it must be because they know something you do not know. Thus, you should sell, and you do, and so down go stock prices. Why now? Perhaps because we have entered a period of higher uncertainty. The world economy, at the start of 2016, is a genuinely confusing place. Political uncertainty at home and geopolitical uncertainty abroad are both high. The Fed has entered a new regime. The ability of the Chinese government to control its economy is in question. In that environment, in the stock market just as in the presidential election campaign, it is easier for the bears to win the argument, for stock markets to fall, and, on the political front, for fearmongers to gain popularity.

They are honest enough to admit that economics won’t provide the answers.

Energy Prices

The June 2015 BP – Statistical Review of World Energy – made the following comments:-

Global primary energy consumption increased by just 0.9% in 2014, a marked deceleration over 2013 (+2.0%) and well below the 10-year average of 2.1%. Growth in 2014 slowed for every fuel other than nuclear power, which was also the only fuel to grow at an above-average rate. Growth was significantly below the 10-year average for Asia Pacific, Europe & Eurasia, and South & Central America. Oil remained the world’s leading fuel, with 32.6% of global energy consumption, but lost market share for the fifteenth consecutive year.

Although emerging economies continued to dominate the growth in global energy consumption, growth in these countries (+2.4%) was well below its 10-year average of 4.2%. China (+2.6%) and India (+7.1%) recorded the largest national increments to global energy consumption. OECD consumption fell by 0.9%, which was a larger fall than the recent historical average. A second consecutive year of robust US growth (+1.2%) was more than offset by declines in energy consumption in the EU (-3.9%) and Japan (-3.0%). The fall in EU energy consumption was the second-largest percentage decline on record (exceeded only in the aftermath of the financial crisis in 2009).

The FT – The world energy outlook in five charts – looked at five charts from the IEA World Energy Outlook – November 2015:-

Demand_Growth_in_Asia

Source: IEA

With 315m of its population expected to live in urban areas by 2040, and its manufacturing base expanding, India is forecast to account for quarter of global energy demand growth by 2040, up from about 6 per cent currently.

India_moving_to_centre

Source: IEA

Oil demand in India is expected to increase by more than in any other country to about 10m barrels per day (bpd). The country is also forecast to become the world’s largest coal importer in five years. But India is also expected to rely on solar and wind power to have a 40 per cent share of non-fossil fuel capacity by 2030.

A_new_chapter_in_Chinas_growth_story

Source: IEA

China’s total energy demand is set to nearly double that of the US by 2040. But a structural shift in the Asian country away from investment-led growth to domestic-demand based economy will “mean that 85 per cent less energy is required to generate each unit of future economic growth than was the case in the past 25 years.”

A_new_balancing_item_in_the_oil_market

Source: IEA

US shale oil production is expected to “stumble” in the short term, but rise as oil price recovers. However the IEA does not expect crude oil to reach $80 a barrel until 2020, under its “central scenario”. The chart shows that if prices out to 2020 remain under $60 per barrel, production will decline sharply.

Power_is_leading_the_transformation

Source: IEA

Renewables are set to overtake coal to become the largest source of power by 2030. The share of coal in the production of electricity will fall from 41 per cent to 30 per cent by 2040, while renewables will account for more than half the increase in electricity generation by then.

The cost of solar energy continues to fall and is now set to “eclipse” natural gas, as this article from Seeking Alpha by Siddharth Dalal – Falling Solar Costs: End Of Natural Gas Is Near? Explains:-

A gas turbine power plant uses 11,371 Btu/kWh. The current price utilities are paying per Btu of natural gas are $3.23/1000 cubic feet. 1000 cubic feet of natural gas have 1,020,000 BTUs. So $3.23 for 90kWh. That translates to 3.59c/kWh in fuel costs alone.

A combined cycle power plant uses 7667 Btu/kWh, which translates to 2.42c/kWh.

Adding in operating and maintenance costs, we get 4.11c/kWh for gas turbines and 3.3c/kWh for combined cycle power plants. This still doesn’t include any construction costs.

…The average solar PPA is likely to go under 4c/kWh next year. Note that this is the total cost that the utility pays and includes all costs.

And the trend puts total solar PPA costs under gas turbine fuel costs and competitive with combined cycle plant total operating costs next year.

At this point it becomes a no brainer for a utility to buy cheap solar PPAs compared to building their own gas power plants.

The only problem here is that gas plants are dispatchable, while solar is not. This is a problem that is easily solved by batteries. So utilities would be better served by spending capex on batteries as opposed to any kind of gas plant, especially anything for peak generation.

The influence of the oil price, whilst diminishing, still dominates. In the near term the importance of the oil price on financial market prices will relate to the breakeven cost of production for companies involved in oil exploration. Oil companies have shelved more than $400bln of planned investment since 2014. The FT – US junk-rated energy debt hits two-decade lowtakes up the story:-

US-High Yield - Thompson Reuters

Source: Thomson Reuters Datastream, FT

The average high-yield energy bond has slid to just 56 cents on the dollar, below levels touched during the financial crisis in 2008-09, as investors brace for a wave of bankruptcies.

…The US shale revolution which sent the country’s oil production soaring from 2009 to 2015 was led by small and midsized companies that typically borrowed to finance their growth. They sold $241bn worth of bonds during 2007-15 and many are now struggling under the debts they took on.

Very few US shale oil developments can be profitable with crude at about $30 a barrel, industry executives and advisers say. Production costs in shale have fallen as much as 40 per cent, but that has not been enough to keep pace with the decline in oil prices.

…On Friday, Moody’s placed 120 oil and gas companies on review for downgrade, including 69 in the US.

…The yield on the Bank of America Merrill Lynch US energy high-yield index has climbed to the highest level since the index was created, rising to 19.3 per cent last week, surpassing the 17 per cent peak hit in late 2008.

More than half of junk-rated energy groups in the US have fallen into distress territory, where bond yields rise more than 1,000 basis points above their benchmark Treasury counterpart, according to S&P.

All other things equal, the price of oil is unlikely to rally much from these levels, but, outside the US, geo-political risks exist which may create an upward bias. Many Middle Eastern countries have made assumptions about the oil price in their estimates of tax receipts. Saudi Arabia has responded to lower revenues by radical cuts in public spending and privatisations – including a proposed IPO for Saudi Aramco. As The Guardian – Saudi Aramco privatisation plans shock oil sector – explains, it will certainly be difficult to value – market capitalisation estimates range from $1trln to $10trln.

Outright energy company bankruptcies are likely to be relatively subdued, unless interest rates rise dramatically – these companies locked in extremely attractive borrowing rates and their bankers will prefer to renegotiate payment schedules rather than write off the loans completely. New issuance, however, will be a rare phenomenon.

Technology

“We don’t want technology simply because it’s dazzling. We want it, create it and support it because it improves people’s lives.”

These words were uttered by Canadian Prime Minister, Justin Trudeau, at Davos last week. The commodity markets have been dealing with technology since the rise of Sumer. The Manhattan Institutes – SHALE 2.0 Technology and the Coming Big-Data Revolution in America’s Shale Oil Fields highlights some examples which go a long way to explaining the downward trajectory in oil prices over the last 18 months – emphasis is mine:-

John Shaw, chair of Harvard’s Earth and Planetary Sciences Department, recently observed: “It’s fair to say we’re not at the end of this [shale] era, we’re at the very beginning.” He is precisely correct. In recent years, the technology deployed in America’s shale fields has advanced more rapidly than in any other segment of the energy industry. Shale 2.0 promises to ultimately yield break-even costs of $5–$20 per barrel—in the same range as Saudi Arabia’s vaunted low-cost fields.

…Compared with 1986—the last time the world was oversupplied with oil—there are now 2 billion more people living on earth, the world economy is $30 trillion bigger, and 30 million more barrels of oil are consumed daily. The current 33 billion-barrel annual global appetite for crude will undoubtedly rise in coming decades. Considering that fluctuations in supply of 1–2 MMbd can swing global oil prices, the infusion of 4 MMbd from U.S. shale did to petroleum prices precisely what would be expected in cyclical markets with huge underlying productive capacity.

Shipbuilding has also benefitted from technological advances in a variety of areas, not just fuel efficiency. This article (please excuse the author’s English) from Marine Insight – 7 Technologies That Can Change The Future of Shipbuilding – highlights several, I’ve chosen five:-

3-D Printing Technology:…Recently, NSWC Carderock made a fabricated model of the hospital ship USNS Comfort (T-AH 20) using its 3-D printer, first uploading CAD drawings of ship model in it. Further developments in this process can lead the industry to use this technique to build complex geometries of ship like bulbous bow easily. The prospect of using 3-D printers to seek quick replacement of ship’s part for repairing purpose is also being investigated. The Economist claims use this technology to be the “Third Industrial Revolution“.

Shipbuilding Robotics: Recent trends suggest that the shipbuilding industry is recognizing robotics as a driver of efficiency along with a method to prevent workers from doing dangerous tasks such as welding. The shortage of skilled labour is also one of the reasons to look upon robotics. Robots can carry out welding, blasting, painting, heavy lifting and other tasks in shipyards.

LNG Fueled engines

…In the LNG engines, CO2 emission is reduced by 20-25% as compared to diesel engines, NOX emissions are cut by almost 92%, while SOX and particulates emissions are almost completely eliminated.

…Besides being an environmental friendly fuel, LNG is also cheaper than diesel, which helps the ship to save significant amount of money over time.

…Solar & Wind Powered Ships:

…The world’s largest solar powered ship named ‘Turanor’ is a 100 metric ton catamaran which motored around the world without using any fuel and is currently being used as a research vessel. Though exclusive solar or wind powered ships look commercially and practically not viable today, they can’t be ruled out of future use with more technical advancements.

Recently, many technologies have come which support the big ships to reduce fuel consumption by utilizing solar panels or rigid sails. A device named Energy Sail (patent pending) has been developed by Eco Marine Power will help the ships to extract power from wind and sun so as to reduce fuel costs and emission of greenhouse gases. It is exclusively designed for shipping and can be fitted to wide variety of vessels from oil carrier to patrol ships.

Buckypaper: Buckypaper is a thin sheet made up of carbon nanotubes (CNT). Each CNT is 50,000 thinner than human air. Comparing with the conventional shipbuilding material (i.e. steel), buckypaper is 1/10th the weight of steel but potentially 500 times stronger in strength  and 2 times harder than diamond when its sheets are compiled to form a composite. The vessel built from this lighter material would require less fuel, hence increasing energy efficiency. It is corrosion resistant and flame retardant which could prevent fire on ships. A research has already been initiated for the use of buckypaper as a construction material of a future aeroplane. So, a similar trend can’t be ruled out in case of shipbuilding.

Shipping has always been a cyclical business, driven by global demand for freight on the one hand and improvements in technology on the other. The cost of production continues to fall, old inventory rapidly becomes uncompetitive and obsolete. The other factor effecting the cycle is the cost of finance; this is true also of energy exploration and development. Which brings us to the actions of the CBs.

The central role of the central banks

Had $100 per barrel oil encouraged a rise in consumer price inflation in the major economies, it might have been appropriate for their CBs to raise interest rates, however, high levels of debt kept inflation subdued. The “unintended consequences” or, perhaps we should say “collateral damage” of allowing interest rates to remain unrealistically low, is overinvestment. The BIS – Self-oriented monetary policy, global financial markets and excess volatility of international capital flows – looks at the effect developed country CB policy – specifically the Federal Reserve – has had on emerging markets:-

A major policy question arising from these events is whether US monetary policy imparts a global ‘externality’ through spillover effects on world capital flows, credit growth and asset prices. Many policy makers in emerging markets (e.g. Rajan, 2014) have argued that the US Federal Reserve should adjust its monetary policy decisions to take account of the excess sensitivity of international capital flows to US policy. This criticism questions the view that a ‘self-oriented’ monetary policy based on inflation targeting principles represents an efficient mechanism for the world monetary system (e.g. Obstfeld and Rogoff, 2002), without the need for any cross-country coordination of policies.

…Our results indicate that the simple prescriptions about the benefits of flexible exchange rates and inflation targeting are very unlikely to hold in a global financial environment dominated by the currency and policy of a large financial centre, such as the current situation with the US dollar and US monetary policy. Our preliminary analysis does suggest however that an optimal monetary policy can substantially improve the workings of the international system, even in the absence of direct intervention in capital markets through macro-prudential policies or capital controls. Moreover, under the specific assumptions maintained in this paper, this outcome can still be consistent with national independence in policy, or in other words, a system of ‘self-oriented’ monetary policy making.

Whether CBs should consider the international implications of their actions is not a new subject, but this Cobden Centre article by Alisdair Macleod – Why the Fed Will Never Succeed – suggests that the Fed should be mandated to accept a broader role:-

That the Fed thinks it is only responsible to the American people for its actions when they affect all nations is an abrogation of its duty as issuer of the reserve currency to the rest of the world, and it is therefore not surprising that the new kids on the block, such as China, Russia and their Asian friends, are laying plans to gain independence from the dollar-dominated system. The absence of comment from other central banks in the advanced nations on this important subject should also worry us, because they appear to be acting as mute supporters for the Fed’s group-think.

This is the context in which we need to clarify the effects of the Fed’s monetary policy. The fundamental question is actually far broader than whether or not the Fed should be raising rates: rather, should the Fed be managing interest rates at all? Before we can answer this question, we have to understand the relationship between credit and the business cycle.

There are two types of economic activity, one that correctly anticipates consumer demand and is successful, and one that fails to do so. In free markets the failures are closed down quickly, and the scarce economic resources tied up in them are redeployed towards more successful activities. A sound-money economy quickly eliminates business errors, so this self-cleansing action ensures there is no build-up of malinvestments and the associated debt that goes with it.

When there is stimulus from monetary inflation, it is inevitable that the strict discipline of genuine profitability that should guide all commercial enterprises takes a back seat. Easy money and interest rates lowered to stimulate demand distort perceptions of risk, over-values financial assets, and encourages businesses to take on projects that are not genuinely profitable. Furthermore, the owners of failing businesses find it possible to run up more debts, rather than face commercial reality. The result is a growing accumulation of malinvestments whose liquidation is deferred into the future.

Macleod goes on to discuss the Cantillon effect, at what point we are in the Credit Cycle and why the Fed decided to raise rates now:-

We must put ourselves in the Fed’s shoes to try to understand why it has raised rates. It has seen the official unemployment rate decline for a prolonged period, and more recently energy and commodity prices have fallen sharply. Assuming it believes government unemployment figures, as well as the GDP and its deflator, the Fed is likely to think the economy has at least stabilised and is fundamentally healthy. That being the case, it will take the view the business cycle has turned. Note, business cycle, not credit-driven business cycle: the Fed doesn’t accept monetary policy is responsible for cyclical phenomena. Therefore, demand for energy and commodities is expected to increase on a one or two-year view, so inflation can be expected to pick up towards the 2% target, particularly when the falls in commodity and energy prices drop out of the back-end of the inflation numbers. Note again, inflation is thought to be a demand-for-goods phenomenon, not a monetary phenomenon, though according to the Fed, monetary policy can be used to stimulate or control it.

Unfortunately, the evidence from multiple surveys is that after nine years since the Lehman crisis the state of the economy remains suppressed while debt has continued to increase, so this cycle is not in the normal pattern. It is clear from the evidence that the American economy, in common with the European and Japanese, is overburdened by the accumulation of malinvestments and associated debt. Furthermore, nine years of wealth attrition through monetary inflation (as described above) has reduced the purchasing power of the average consumer’s earnings significantly in real terms. So instead of a phase of sustainable growth, it is likely America has arrived at a point where the economy can no longer bear the depredations of further “monetary stimulus”. It is also increasingly clear that a relatively small rise in the general interest rate level will bring on the next crisis.

So what will the Fed – and, for that matter, other major CBs – do? I look back to the crisis of 2008/2009 – one of the unique aspects of this period was the coordinated action of the big five: the Fed, ECB, BoJ, BoE and SNB. In 1987 the Fed was the “saviour of the universe”. Their actions became so transparent in the years that followed, that the phase “Greenspan Put” was coined to describe the way the Fed saved stock market investors and corporate creditors. CEPR – Deleveraging? What deleveraging? which I have quoted from in previous letters, is an excellent introduction to the unintended consequences of CB largesse.

Since 2009 economic growth has remained sluggish; this has occurred despite historically low interest rates – it’s not unreasonable to surmise that the massive overhang of debt, globally, is weighing on both demand pull inflation and economic growth. Stock buy-backs have been rife and the long inverted relationship between dividend yields and government bond yields has reversed. Paying higher dividends may be consistent with diversifying a company’s investor base but buying back stock suggests a lack of imagination by the “C” Suite. Or perhaps these executives are uncomfortable investing when interest rates are artificially low.

I believe the vast majority of the rise in stock markets since 2009 has been the result of CB policy, therefore the Fed rate increase is highly significant. The actions of the other CBs – and here I would include the PBoC alongside the big five – is also of significant importance. Whilst the Fed has tightened the ECB and the PBoC continue to ease. The Fed appears determined to raise rates again, but the other CBs are likely to neutralise the overall effect. Currency markets will take the majority of the strain, as they have been for the last couple of years.

A collapse in equity markets will puncture confidence and this will undermine growth prospects globally. Whilst some of the malinvestments of the last seven years will be unwound, I expect CBs to provide further support. The BoJ is currently the only CB with an overt policy of “qualitative easing” – by which I mean the purchasing of common stock – I fully expect the other CBs to follow to adopt a similar approach. For some radical ideas on this subject this paper by Professor Roger Farmer – Qualitative Easing: How it Works and Why it Matters – which was presented at the St Louis Federal Reserve conference in 2012 – makes interesting reading.

Investment opportunities

In comparison to Europe– especially Germany – the US economy is relatively immune to the weakness of China. This is already being reflected in both the currency and stocks markets. The trend is likely to continue. In the emerging market arena Brazil still looks sickly and the plummeting price of oil isn’t helping, meanwhile India should be a beneficiary of cheaper oil. Some High yield non-energy bonds are likely to be “tarred” (pardon the pun) with the energy brush. Meanwhile, from an international perspective the US$ remains robust even as the US$ Index approaches resistance at 100.

US_Index_-_5_yr_Marketwatch

Source: Marketwatch

Have technological advances offset the reduction in capital allocated to financial markets trading?

400dpiLogo

Macro Letter – No 45 – 06-11-2015

Have technological advances offset the reduction in capital allocated to financial markets trading?

  • Increases in capital requirements have curtailed financial institutions trading
  • Improved execution, clearing and settlement has reduced frictions in transactions
  • Faster real-time risk management systems have enhanced the efficiency of capital
  • On-line services have democratized market access

Liquidity in financial markets means different things to different participants. A sharp increase in trading volume is no guarantee that liquidity will persist. Before buying (or selling) any financial instrument the first thing one should ask is “how easy will it be to liquidate my exposure?” This question was at the heart of a recent paper by the UK Government – The future of computer trading in financial markets – 2012here are some of the highlights:-

…The Project has found that some of the commonly held negative perceptions surrounding HFT are not supported by the available evidence and, indeed, that HFT may have modestly improved the functioning of markets in some respects. However, it is believed that policy makers are justified in being concerned about the possible effects of HFT on instability in financial markets.

There will be increasing availability of substantially cheaper computing power, particularly through cloud computing: those who embrace this technology will benefit from faster and more intelligent trading systems in particular.

Special purpose silicon chips will gain ground from conventional computers: the increased speed will provide an important competitive edge through better and faster simulation and analysis, and within transaction systems.

Computer-designed and computer-optimised robot traders could become more prevalent: in time, they could replace algorithms designed and refined by people, posing new challenges for understanding their effects on financial markets and for their regulation.

Opportunities will continue to open up for small and medium-sized firms offering ‘middleware’ technology components, driving further changes in market structure: such components can be purchased and plugged together to form trading systems which were previously the preserve of much larger institutions.

The extent to which different markets embrace new technology will critically affect their competitiveness and therefore their position globally: The new technologies mean that major trading systems can exist almost anywhere. Emerging economies may come to challenge the long-established historical dominance of major European and US cities as global hubs for financial markets if the former capitalise faster on the technologies and the opportunities presented.

The new technologies will continue to have profound implications for the workforce required to service markets, both in terms of numbers employed in specific jobs, and the skills required: Machines can increasingly undertake a range of jobs for less cost, with fewer errors and at much greater speed. As a result, for example, the number of traders engaged in on-the-spot execution of orders has fallen sharply in recent years, and is likely to continue to fall further in the future. However, the mix of human and robot traders is likely to continue for some time, although this will be affected by other important factors, such as future regulation.

Markets are already ‘socio-technical’ systems, combining human and robot participants. Understanding and managing these systems to prevent undesirable behaviour in both humans and robots will be key to ensuring effective regulation…

While the effect of CBT (Computer Based Trading) on market quality is controversial, the evidence available to this Project suggests that CBT has several beneficial effects on markets, notably:

liquidity, as measured by bid-ask spreads and other metrics, has improved;

transaction costs have fallen for both retail and institutional traders, mostly due to changes in trading market structure, which are related closely to the development of HFT in particular;

market prices have become more efficient, consistent with the hypothesis that CBT links markets and thereby facilitates price discovery.

While overall liquidity has improved, there appears to be greater potential for periodic illiquidity: The nature of market making has changed, with high frequency traders now providing the bulk of such activity in both futures and equities. However, unlike designated specialists, high frequency traders typically operate with little capital, hold small inventory positions and have no obligations to provide liquidity during periods of market stress. These factors, together with the ultra-fast speed of trading, create the potential for periodic illiquidity. The US Flash Crash and other more recent smaller events illustrate this increased potential for illiquidity.

…Three main mechanisms that may lead to instabilities and which involve CBT are:

nonlinear sensitivities to change, where small changes can have very large effects, not least through feedback loops;

incomplete information in CBT environments where some agents in the market have more, or more accurate, knowledge than others and where few events are common knowledge;

internal ‘endogenous’ risks based on feedback loops within the system.

The crux of the issue is whether market-makers have been replaced by traders. This trend is not new. On the LSE the transition occurred at “Big Bang” in October 1986. The LSE was catching up with the US deregulation which prompted the formation of NASDAQ in 1971.

Electronic trading, once permitted, soon eclipsed the open-outcry of futures pits and traditional practices of stock exchange floors. Transactions became cheaper, audit trails, more accurate and error incidence declined. Commission rates fell, bid/offer spreads narrowed, volumes increased, in an, almost, entirely virtuous circle.

The final development which was needed to insure liquidity, was the evolution of an efficient repurchase market for securities – sadly this market-place remains remarkably opaque. Nonetheless, the perceived need for designated market-makers, with an obligation to make a two-way price, has diminished. It has been replaced by proprietary trading firms, which forgo the privileges of the market-maker – principally lower fees or preferential access to supply – for the flexibility to abstain from providing liquidity at their own discretion.

In the late 1990’s I remember a conversation with a partner at NYSE Specialist – Foster, Marks & Natoli – he had joined the firm in 1953 and sold his business to Spear, Leeds Kellogg in 1994. He told me that during his career he estimated the amount of capital relative to size of the trading portfolio had declined by a factor of five times.

Since the mid-1990’s stock market volumes have increased dramatically as the chart below shows:-

NYSEvolume

Source: NYSE

The recommendations of the UK Government report include:-

European authorities, working together, and with financial practitioners and academics, should assess (using evidence-based analysis) and introduce mechanisms for managing and modifying the potential adverse side-effects of CBT and HFT.

Coordination of regulatory measures between markets is important and needs to take place at two levels: Regulatory constraints involving CBT in particular need to be introduced in a coordinated manner across all markets where there are strong linkages.

Regulatory measures for market control must also be undertaken in a systematic global fashion to achieve in full the objectives they are directed at. A joint initiative from a European Office of Financial Research and the US Office of Financial Research (OFR), with the involvement of other international markets, could be one option for delivering such global coordination.

Legislators and regulators need to encourage good practice and behaviour in the finance and software engineering industries. This clearly involves the need to discourage behaviour in which increasingly risky situations are regarded as acceptable, particularly when failure does not appear as an immediate result.

Standards should play a larger role. Legislators and regulators should consider implementing accurate, high resolution, synchronised timestamps because this could act as a key enabling tool for analysis of financial markets. Clearly it could be useful to determine the extent to which common gateway technology standards could enable regulators and customers to connect to multiple markets more easily, making more effective market surveillance a possibility.

In the longer term, there is a strong case to learn lessons from other safety-critical industries, and to use these to inform the effective management of systemic risk in financial systems. For example, high-integrity engineering practices developed in the aerospace industry could be adopted to help create safer automated financial systems.

Making surveillance of financial markets easier…The development of software for automated forensic analysis of adverse/extreme market events would provide valuable assistance for regulators engaged in surveillance of markets. This would help to address the increasing difficulty that people have in investigating events

At no point do they suggest that all market participants – especially those with principal or spread risk – be required to increase their capital. This will always remain an option. An alternative solution, the reinstatement of designated market-makers with obligations and privileges, is also absent from the report – this may prove to be a mistake.

An example of technological emancipation

In this paper, Review of Development Finance – The impact of technological improvements on developing financial markets: The case of the Johannesburg Stock Exchange – Q3 – 2013 – the authors investigate how the adoption of the SETS trading platform transformed the volume traded on the JSE:-

The adoption of the SETS trading platform was supposed to represent a watershed moment in the history of the Johannesburg Stock Exchange. The JSE is more liquid after SETS. The JSE has nearly doubled its trading activity (volume), trading is cheaper, and there are more trades at JSE after SETS.

Overall, average daily returns are higher. We posit that this is mainly because the returns are increased to the levels demanded for the associated risk. With the new trading platform, it would also be expected that there would be improvements in market efficiency. Higher numbers of investors, more listed companies, faster trading and more trade (evidenced with trading activity and liquidity), all would imply more market efficiency. Contrary to our expectations, however, market-wide and individual-level stock returns are still somewhat predictable; this is a clear violation of market efficiency.

If market participants had been required to increase their capital in line with the increased volume, the transformation would have been far less dramatic. This is not to say that increased trading volume equates to increased risk. Technology has improved access, traders are able to liquidate positions more easily, most of the time, due to improved technology. At any point in the trading day they may hold the same open position size, but by turning over their positions more frequently they may be able to increase their return on capital (and risk) employed.

Federal Reserve concern

The Federal Reserve Bank of New York – Introduction to a series on Liquidity published eleven articles on different aspects of liquidity during the last three months, here are some of the highlights:-

Has U.S. Treasury Market Liquidity Deteriorated? …it might be that liquidity concerns reflect anxiety about future liquidity conditions, with a possible imbalance between liquidity supply and demand. On the demand side, the share of Treasuries owned by mutual funds, which may demand daily liquidity, has increased. On the supply side, the primary dealers have pared their financing activities sharply since the crisis and shown no growth in their gross positions despite the sharp increase in Treasury debt outstanding.

This seems to ignore the effect of QE on the “free-float” of T-Bonds. The chart below shows the growth of the Federal Reserve holdings during the last decade:-

T-Bonds at the Fed - St Louis Fed

Source: St Louis Federal Reserve

Liquidity during Flash Events…all three events exhibited strained liquidity conditions during periods of extreme price volatility but the Treasury market event arguably exhibited a greater degree of price continuity, consistent with descriptions of the flash rally as “slow-moving.”

Unlike the FX and equity market, the US government still appoint primary dealers who have privileged access to the issuer. This probably explains much of the improved price continuity.

High-Frequency Cross-Market Trading in U.S. Treasury Markets. Cross-market trading by now accounts for a significant portion of trading in Treasury instruments in both the cash and futures markets. This reflects improvements in trading technology that allow for high-frequency trading within and across platforms. In particular, nearly simultaneous trading between the cash and futures platforms now accounts for up to 20 percent of cash market activity on many days. Market participants often presume that price discovery happens in Treasury futures. However, our findings show that this is not always the case: Although futures usually lead cash, the reverse is also often true. Therefore, from a price discovery point of view, the two markets can effectively be seen as one.

For many years the T-Bond future was regarded as the most liquid market and was therefore the preferred means of liquidation in times of stress. The most extreme example I have witnessed was in the German bond market during re-unification (1988). The Bund future was the most liquid market in which to lay off risk. As a result, Bund futures traded more than 10 bps cheap to cash and cash Bunds offered a yield premium of 13bps to bank Schuldschein – unsecured promissory notes.

The introduction of electronic trading in T-Bond cash markets has created competing pools of liquidity which should be additive in times of stress. The increasing use of Central Counter Party (CCP) clearing has allowed new market participants to operate with a smaller capital base.

This evolution has also been sweeping through the Interest Rate Swap market, reducing pressure on the T-Bond futures market further still.

The Evolution of Workups in the U.S. Treasury Securities Market. The workup is a unique feature of the interdealer cash Treasury market. Over time, the details of the workup have changed in response to changing market conditions, with the abandonment of the private phase and the shortening of the default duration to 3 seconds. While some market participants may consider it an anachronism, given the increased trading activity in benchmark Treasuries and the tight link to the extremely liquid Treasury futures market, the workup has not only remained an important feature of the interdealer market; it has actually grown in importance, now accounting for almost two-thirds of trading volume in the benchmark ten-year Treasury note.

On the Frankfurt stock exchange each Bund issue is “fixed” at around 13:00 daily. This process creates a liquidity concentration. A similar “clearing” process occurs at the end of LME rings. For spread traders, the ability to “lean” against a relatively un-volatile market – such as during a workup – whilst making an aggressive market in the correspondingly more volatile companion, represents an enhanced trading opportunity. One side of the potential spread price is provided “risk-free”.

What’s Driving Dealer Balance Sheet Stagnation? …The growing role of electronic trading has likely narrowed bid-ask spreads and reduced dealers’ profits from intermediating customer order flow, causing dealers to step back from making markets and reducing their need for large balance sheets. The changing competitive landscape of market making, as manifested by the entry of nondealer firms since the early 2000s, may therefore also play a role in the post-crisis dealer balance sheet dynamics.  …The picture that emerges is that post-crisis dealer asset growth represents the confluence of several issues. Our findings suggest that business-cycle factors (the hangover from the housing boom and bust and subsequent risk aversion) and secular trends (electronification and competitive entry) should be considered alongside tighter regulation in explaining stagnating dealer balance sheets. 

I refer back to my conversation with Mr Foster, the NYSE Specialist; in asset markets – equities and to a lesser extent bonds – as volume increases during a bull-market, the number of market participants increases. In this environment “liquidity providers” trade more frequently with the same capital base. Subsequently, as volatility declines – provided trading volume is maintained – these liquidity providers increase their trading size in order to maintain the same return on capital. When the bear-market arrives, the new participants, who arrived during the bull-market, liquidate. The remaining “liquidity providers” – those that haven’t exited the gene pool – are left passing the parcel among themselves as the return on capital declines precipitously (the chart, some way below, shows this evolution quite clearly).

Has U.S. Corporate Bond Market Liquidity Deteriorated? …price-based liquidity measures—bid-ask spreads and price impact—are very low by historical standards, indicating ample liquidity in corporate bond markets. This is a remarkable finding, given that dealer ownership of corporate bonds has declined markedly as dealers have shifted from a “principal” to an “agency” model of trading. These findings suggest a shift in market structure, in which liquidity provision is not exclusively provided by dealers but also by other market participants, including hedge funds and high-frequency-trading firms.

Given the “quest for yield” and the reduction in T-Bond supply due to QE, this shift in market structure is unsurprising, however the relatively illiquid nature of the Corporate bond repo market means much of the activity is based around “carry” returns. Participants are cognizant of the dangers of swift reversals of sentiment in carry trading.

Has Liquidity Risk in the Corporate Bond Market Increased? …We measure market liquidity risk by counting the frequency of large day-to-day increases in illiquidity and price volatility, where “large” is defined relative to measures of recent liquidity and volatility changes (details are described here). We refer to the illiquidity jumps as “liquidity risk” and to the volatility jumps as “vol-of-vol.” Counting the number of such jumps in an eighteen-month trailing window shows that liquidity risk and vol-of-vol have declined substantially from crisis levels…

…Current metrics indicate ample levels of liquidity in the corporate bond market, and liquidity risk in the corporate bond market seems to have actually declined in recent years. This is in contrast to liquidity risk in equity and Treasury markets…

The Fed methodology is contained in a four page paper A Note on Measuring Illiquidity Jumps. It may be of interest to those with an interest in exotic option pricing. I’m not convinced that I agree with their conclusions about Liquidity Risk – it is difficult to measure that which is unseen.

Has Liquidity Risk in the Treasury and Equity Markets Increased? …While current levels of liquidity appear similar to those observed before the crisis, sudden spikes in illiquidity—like the equity market flash crash of 2010, the recent equity market volatility on August 24, and the flash rally in Treasury yields on October 15, 2014—seem to have become more common. Such spikes in illiquidity tend to coincide with spikes in option-implied volatility, in both equity and Treasury markets…

…we refer to these liquidity jumps as “liquidity risk” and volatility jumps as “vol-of-vol.” Counting the number of such jumps in an eighteen-month trailing window reveals a recent uptick in liquidity risk and vol-of-vol, and confirms the link between them… The evidence that liquidity risk in equities and Treasuries is elevated contrasts with our earlier post, which found no such increase for corporate bonds.

Our findings suggest a trade-off between liquidity levels and liquidity risk: while equity and Treasury markets have been highly liquid in recent years, liquidity risk appears elevated. This change has gone hand in hand with an apparent increase in the vol-of-vol of asset prices, so that illiquidity spikes seem to coincide with volatility spikes. Our findings further suggest that the increase in liquidity risk is more likely attributable to changes in market structure and competition than dealer balance sheet regulations, since the latter would also have caused corporate bond liquidity risk to rise. Moreover, evidence from option markets suggests that this seeming rise in liquidity risk is not reflected in the price of volatility.

Market liquidity in a given market is never constant, the trading volume may remain the same but the market participants, wholly different. In the 1980’s Japanese institutions were a significant influence on the US bond market, today it is the Federal Reserve. Changes, such as minimum price increments and exchange trading hours are significant; the list of factors is long and ever changing. The increase in Liquidity Risk has as much to do with the increase in systematic trading and the relative consistency of approach these traders take to risk management. These traders and their methods have become increasingly prevalent. Whilst cognizant of skewness they see the world through a Gaussian lense. They measure strategy success by Sharpe and Sortino ratio, assessing it by the minute or the hour and being “flat” by market close.

Changes in the Returns to Market Making. We show estimated returns to market making to be at historically low levels—a finding that seems inconsistent with market analysts’ argument that higher capital requirements have reduced market liquidity. The picture that emerges from our analysis is of a change in the risk-sharing arrangement among trading institutions. We uncover a compression in expected returns to market making in the corporate bond market, where dealers remain the predominant market makers, as well as the equity market, where dealers are less important. The compression of market making returns may be tied to competitive pressures, with high-frequency trading competition being important in the equity market.

High-Frequency Equity Market-Making Returns and VIX

Source: Reuters, Haver Analytics

The chart above looks at one minute reversals on the Dow. As long ago as 2003, the HFT customers I dealt with were operating on sub-second reversal time horizons. Nonetheless, the pattern of profitability may be broadly similar.

Redemption Risk of Bond Mutual Funds and Dealer Positioning. Mutual funds’ share of corporate bond ownership has increased sharply in recent years, while dealers’ share has declined substantially. Because mutual funds are subject to redemption risk, this shift in ownership patterns raises the concern that redemption risk might have increased. However, we find no evidence that the net flow volatility of bond funds has increased. Likewise, we uncover no evidence of contrarian behavior by dealers relative to bond fund flows. Therefore, even if we do observe large mutual fund redemptions in the future, our evidence does not suggest that reduced dealer positions will exacerbate the effects on corporate bond pricing and liquidity.

Since the Mutual Fund “Late Trading” scandal of 2003, arbitrage operators have maintained a low-profile. The “flight-to-quality” properties of T-Bonds should also mean mass-redemption is a much lower probability – “mass-subscription” is a higher risk.

The Liquidity Mirage. While low-latency cross-market trading has undoubtedly led to more consistent pricing of Treasury securities and derivatives, there is strong evidence that it has also resulted in a more complex and dynamic nature of market liquidity. Under the new market structure, it has arguably become more challenging for large investors to accurately assess available liquidity based on displayed market depth across venues. The striking cross-market patterns in trading and order book changes suggest that quote modifications/cancellations by high-frequency market makers rather than preemptive aggressive trading are an important contributing factor to the liquidity mirage phenomenon.

In the days of open-outcry trading on futures exchanges “local” traders would frequently cancel and replace bids and offers. These participants were visible, their reliability, or otherwise, was known to the market-place. In an electronic order book there is less transparency. Algorithmic trading solutions have developed, over the last twenty years, to enable efficient execution in this more opaque environment.

“Cost plus” pricing for equity and futures execution is still quite rare outside the HFT world but it has had a dramatic influence on stock market micro-structure and liquidity since the 1990’s.

In a recent speech by Minouche Shafik of the Bank of England – Dealing with change: Liquidity in evolving market structuressuggested that the changes in liquidity are a natural process:-

The reduction in the relative size of dealer balance sheets may also be a natural process of evolution as the market-making industry matures and emphasis is placed on using its warehousing capacity efficiently rather holding lots of inventory. Market making wouldn’t be the first industry to go through such a change: Just In Time management swept through manufacturing in the 70s and 80s with its focus on minimising waste, eliminating inventories, and quickly responding to changing market demand. More recently, supermarkets have reversed their once relentless expansion of retail space, and started moving away from inventory-intensive hypermarkets toward smaller retail units.

Indeed, moving toward smaller in-store inventories is not the only parallel between retailing and market making: both have also been dramatically changed by innovation. Just as the rise of internet shopping has given consumers access to a broader choice of shops and much easier means of price comparison, so has electronic trading facilitated new ways of matching buyers and sellers in financial markets, and added to the data generally available for price discovery.

The Deputy Governor goes on to remind us that the BoE acted as Market-Maker of Last Resort during the last crisis and would do so again.

Conclusion – Financial markets – for the benefit of whom

Financial markets evolve to allow investors to provide capital in exchange for a financial reward. Technology has increased the speed and reliability of market access whilst reducing the cost, however these benefits change the underlying structure of markets, be it co-location of servers in the last decade or block-chain technology in the next.

Politicians seek to encourage long-term investment; high frequency trading is a very short-term investment strategy indeed, but without short-term investors – shall we call them speculators – the ability to transfer of capital is severely impaired. Even the most jaundiced politician will admit, speculators are a necessary evil.

Innovation has democratized financial markets, it has enabled individual investors to create complex portfolios and implement strategies which were once the preserve of hedge funds and investment banks, however the experience has not been an unmitigated success, in the process it purportedly enabled one man from Hounslow to wipe $750bln off the value of the US stock market in May 2010. That this was possible defies credulity for many; I believe it indicates how technology has more than offset the decline in capital allocated to financial market trading, nonetheless, when it comes to financial market liquidity, I concur with Deputy Governor Shakif – “caveat emptor”.

Technology Indices and Creative Destruction – When Might the Bubble Burst?

400dpiLogo

Macro Letter – No 33 – 10-04-2015

Technology Indices and Creative Destruction – When Might the Bubble Burst?

  • Publically traded technology stocks trade on modest multiples compared to 2000
  • Private sector overinvestment may, however, be cause for concern
  • European technology companies have outperformed US this year – it may not last
  • Technology and growth stocks remain highly correlated to the major indices

I adhere to the belief that technology and other such improvements in manufacturing are the key to delivering productivity growth, which thereby improves the quality of life for the greatest number. Of course, as Joseph Schumpeter so incisively illustrated, the process is often cathartic. For the technology investor this increases both the risk and potential reward.

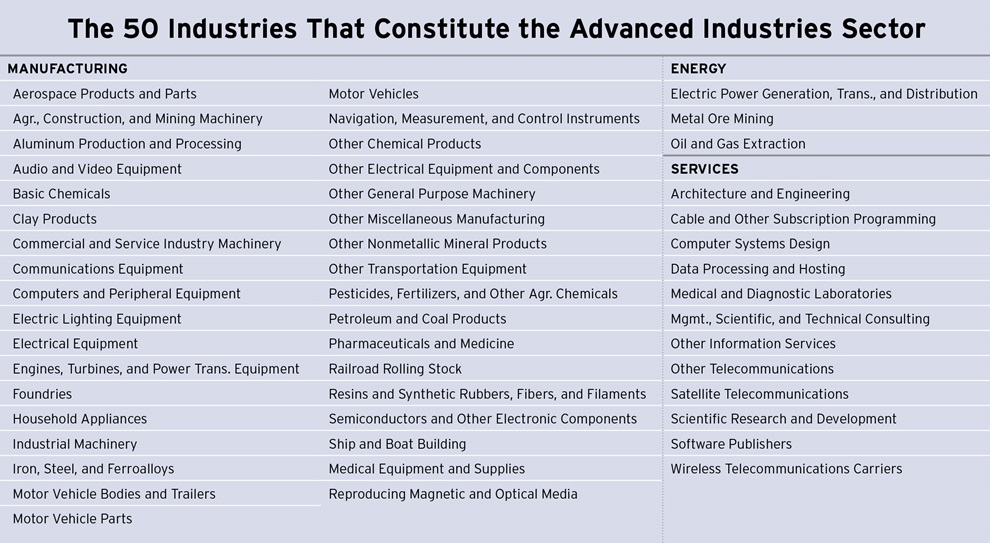
Technology is affects all industries. In an attempt to be more specific, here is a table taken from a February 2015 report by Brookings – America’s Advanced Industries:-

Americas Advance Industries - Brookings

Source: Brookings

The report goes on to describe the scale and importance of these industries to the US economy:-

As of 2013, the nation’s 50 advanced industries employed 12.3 million U.S. workers. That amounts to about 9 percent of total U.S. employment. And yet, even with this modest employment base, U.S. advanced industries produce $2.7 trillion in value added annually—17 percent of all U.S. gross domestic product (GDP). That is more than any other sector, including healthcare, finance, or real estate.

At the same time, the sector employs 80 percent of the nation’s engineers; performs 90 percent of private-sector R&D; generates approximately 85 percent of all U.S. patents; and accounts for 60 percent of U.S. exports. Advanced industries also support unusually extensive supply chains and other forms of ancillary economic activity. On a per worker basis, advanced industries purchase $236,000 in goods and services from other businesses annually, compared with $67,000 in purchasing by other industries. This spending sustains and creates more jobs. In fact, 2.2 jobs are created domestically for every new advanced industry job—0.8 locally and 1.4 outside of the region. This means that in addition to the 12.3 million workers employed by advanced industries, another 27.1 million U.S. workers owe their jobs to economic activity supported by advanced industries. Directly and indirectly, then, the sector supports almost 39 million jobs—nearly one-fourth of all U.S. employment.

…From 1980 to 2013 advanced industries expanded at a rate of 5.4 percent annually—30 percent faster than the economy as a whole. 

…Workers in advanced industries are extraordinarily productive and generate some $210,000 in annual value added per worker compared with $101,000, on average, outside advanced industries. Because of this, advanced industries compensate their workers handsomely and, in contrast to the rest of the economy, wages are rising sharply. In 2013, the average advanced industries worker earned $90,000 in total compensation, nearly twice as much as the average worker outside of the sector. Over time, absolute earnings in advanced industries grew by 63 percent from 1975 to 2013, after adjusting for inflation. This compares with 17 percent gains outside the sector. Even workers with lower levels of education can earn salaries in advanced industries that far exceed their peers in other industries. In this regard, the sector is in fact accessible: More than half of the sector’s workers possess less than a bachelor’s degree.

The report is not an unalloyed paean of praise, however, they go on to emphasise the need for better education and training in order to maintain momentum.

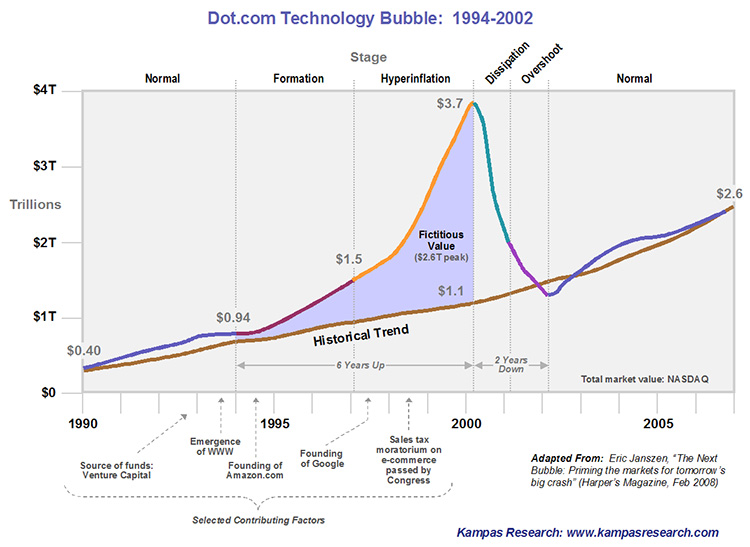
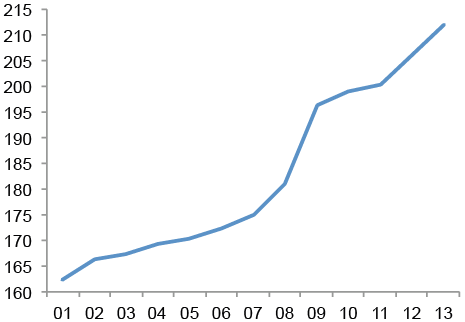
The last great technology stock collapse was seen in the aftermath of the “Dotcom” bubble which burst in 2001:-

dot-com-bubble

Source: Kampas Research

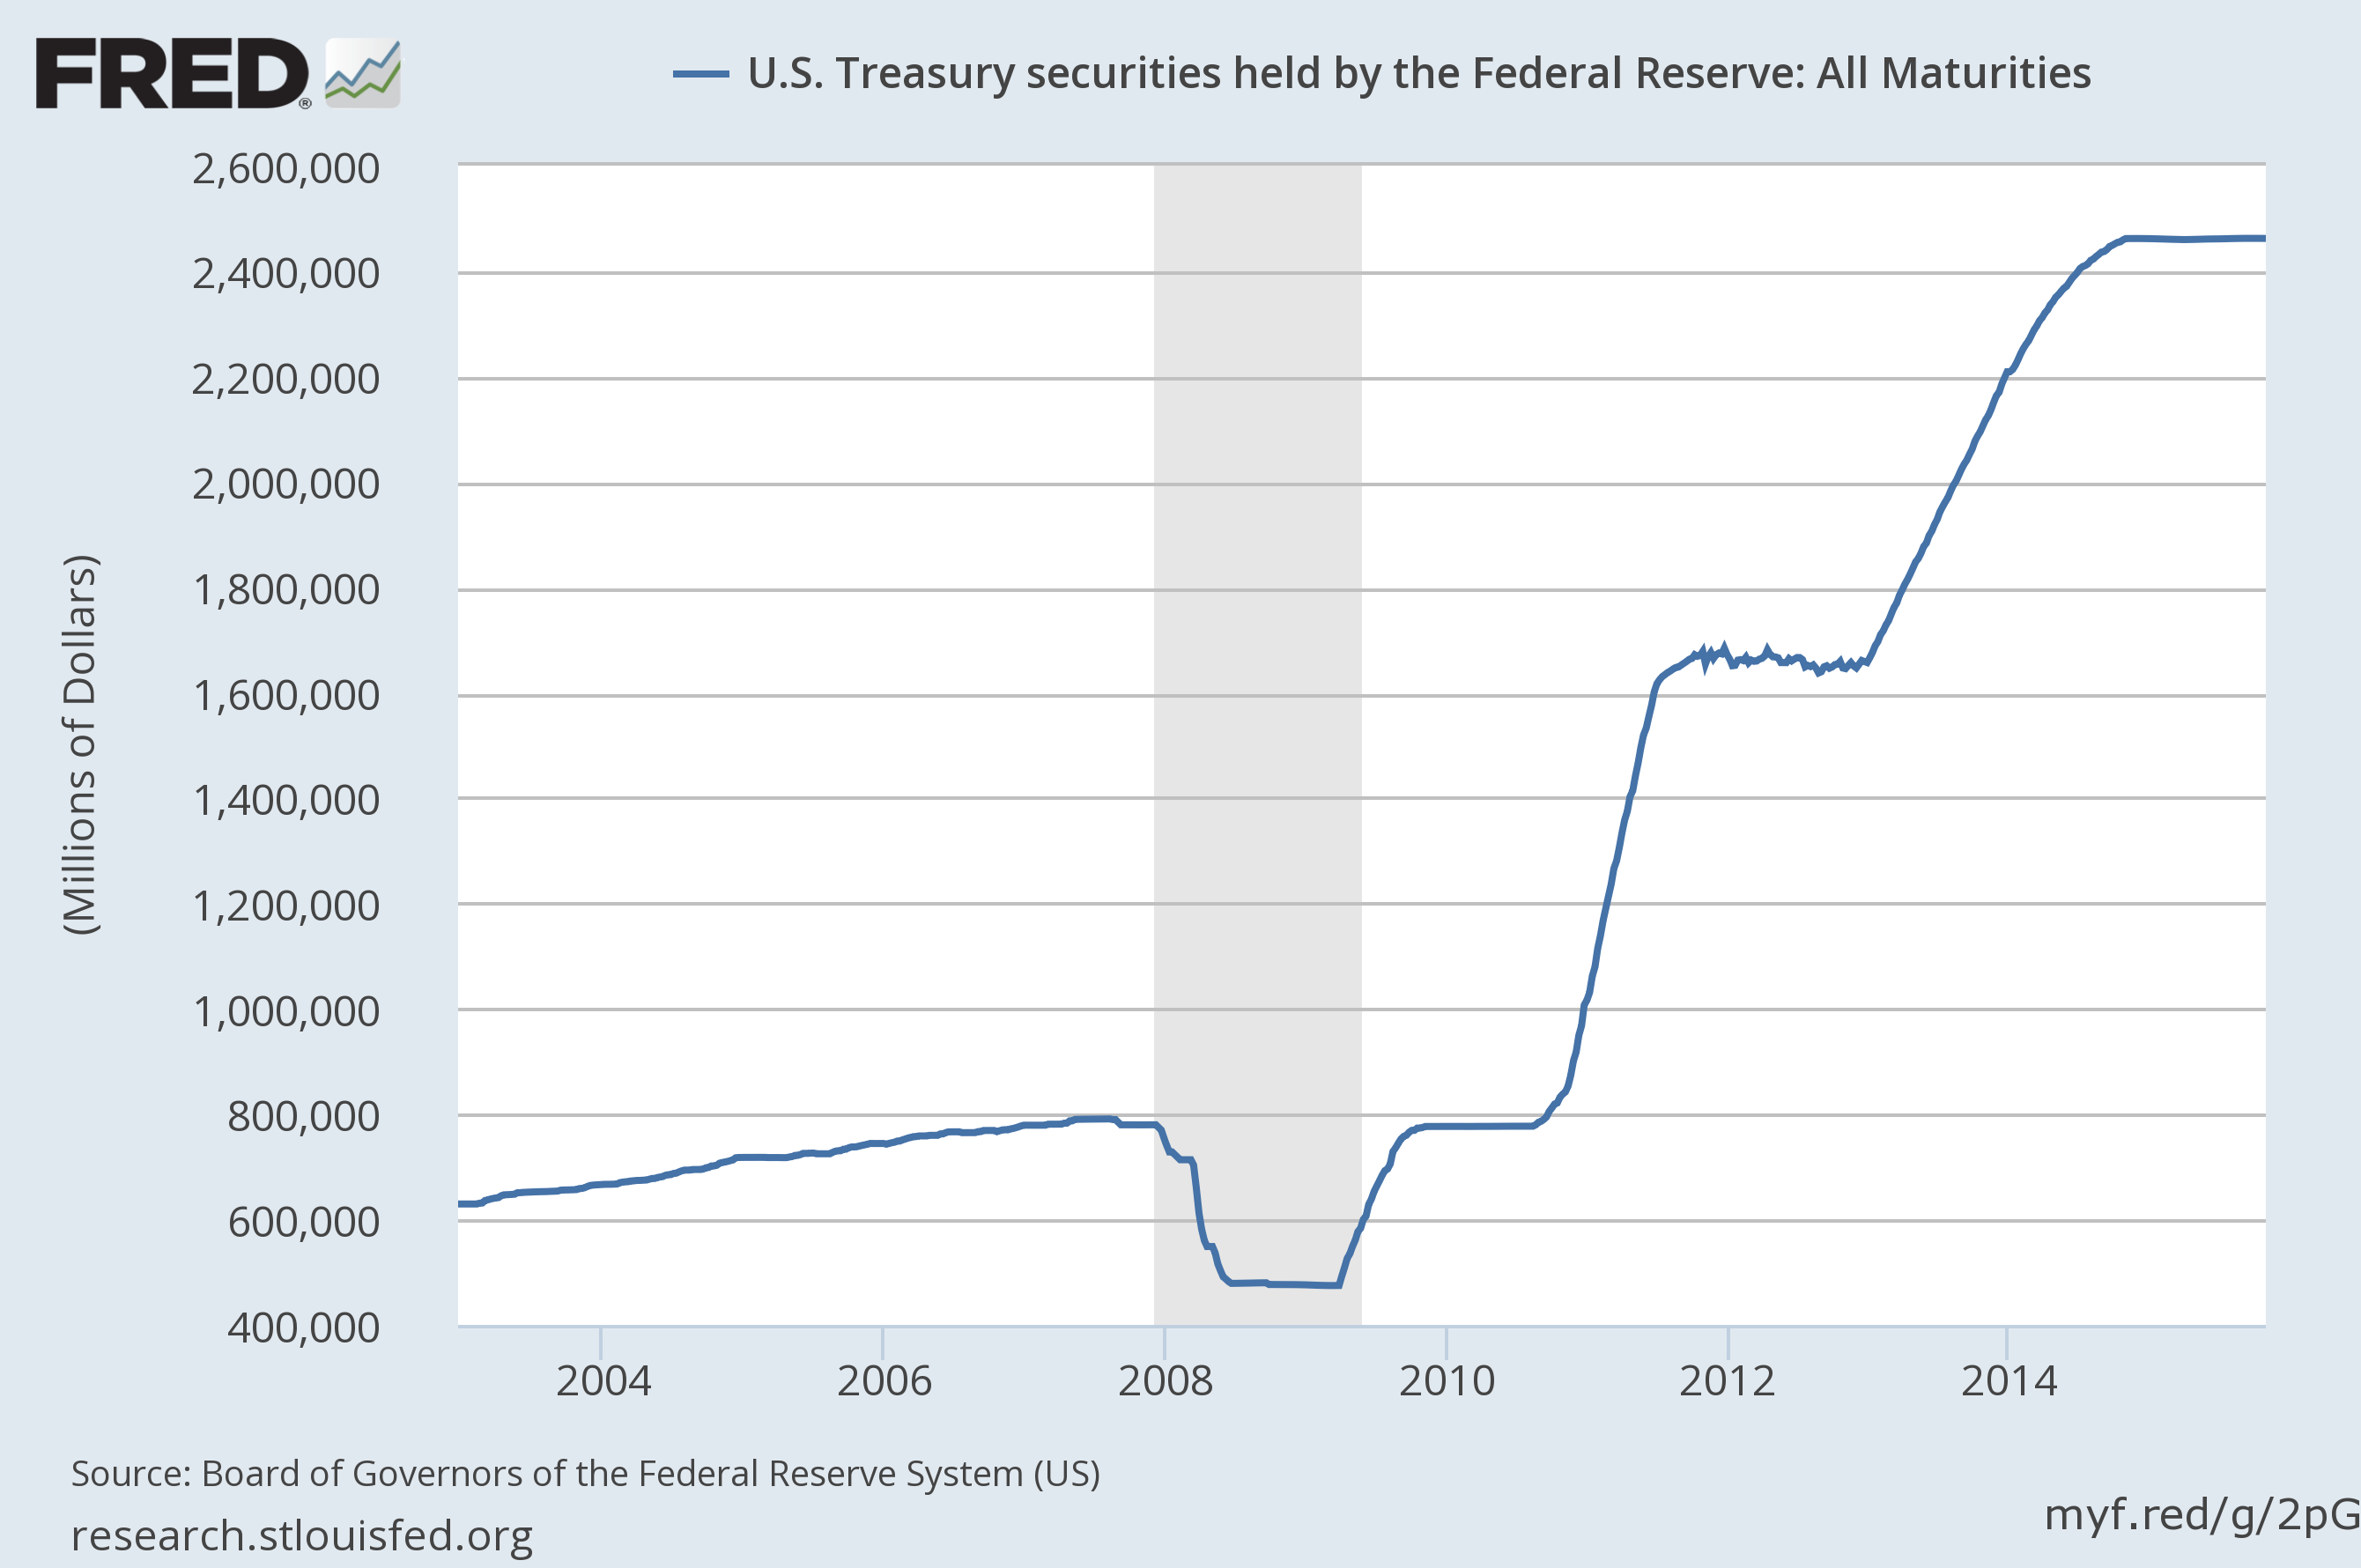
During the early part of the last decade the growth in valuation of the technology sector returned to its long-term trend. Since 2008, however, central bank policies have changed the valuation paradigm for all stocks by reducing interest rates towards the zero-bound. Their quantitative easing policies (QE) have flattening government bond yield curves to unprecedented levels, especially given the absolute level of rates. Nonetheless, many of the signs of a bubble have begun to emerge as this December 2014 article from the Economist – Frothy.com – explains:-

In December 15 years ago the dotcom crash was a few weeks away. Veterans of that fiasco may notice some familiar warning signs this festive season. Bankers and lawyers are being priced out of office space in downtown San Francisco; all of the space in eight tower blocks being built has been taken by technology firms. In 2013 around a fifth of graduates from America’s leading MBA schools joined tech firms, almost double the share that struck Faustian pacts with investment banks. Janet Yellen, the head of the Federal Reserve, has warned that social-media firms are overvalued—and has been largely ignored, just as her predecessor Alan Greenspan was when he urged caution in 1999.

Good corporate governance is, once again, for wimps. Shares in Alibaba, a Chinese internet giant that listed in New York in September using a Byzantine legal structure, have risen by 58%. Executives at startups, such as Uber, a taxi-hailing service, exhibit a mighty hubris.

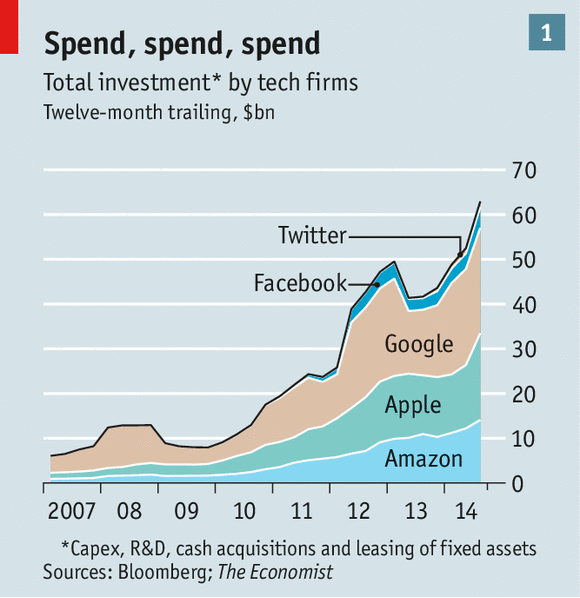
…Instead, today’s financial excess is hidden partly out of sight in two areas: inside big tech firms such as Amazon and Google, which are spending epic sums on warehouses, offices, people, machinery and buying other firms; and on the booming private markets where venture capital (VC) outfits and others trade stakes in young technology firms.

Take the spending boom by the big, listed tech firms first. It is exemplified by Facebook, which said in October that its operating costs would rise in 2015 by 55-75%, far ahead of its expected sales growth. Forget lean outfits run by skinny entrepreneurs: Silicon Valley’s icons are now among the world’s biggest, flabbiest investors. Together, Apple, Amazon, Facebook, Google and Twitter invested $66 billion in the past 12 months. This figure includes capital spending, research and development, fixed assets acquired with leases and cash used for acquisitions (see chart 1).

Tech spend - Economist

Source: The Economist, Bloomberg

That is eight times what they invested in 2009. It is double the amount invested by the VC industry. If you exclude Apple, investments ate up most of the cashflow the firms generated. Together these five tech firms now invest more than any single company in the world: more than such energy Leviathans as Gazprom, PetroChina and Exxon, which each invest about $40 billion-50 billion a year. The five firms together own $60 billion of property and equipment, almost as much as General Electric. They employ just over 300,000 people. Google says it is determined to keep “investing ahead of the curve”.

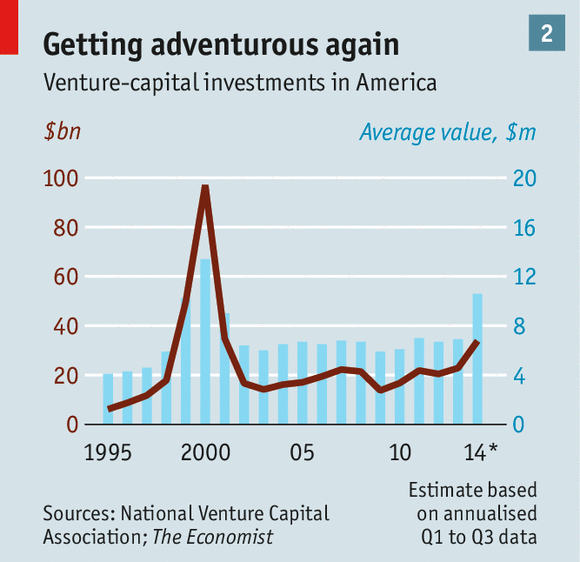
…The second area of technology froth is in private markets. Their exuberance was demonstrated on December 4th when Uber closed a $1.2 billion private funding round that valued the five-year old firm at $40 billion. Baidu, China’s biggest search engine, is set to buy a stake, too (see page 101). There are 48 American VC-backed firms worth $1 billion or more, compared with ten at the height of the dotcom bubble, according to VentureSource, a research outfit. In October a software firm called Slack was valued at $1.1 billion, a year after being founded. 2014 looks set to be the biggest year for VC investments since 2000 (see chart 2).

VC in US - Economist

Source: The Economist

Whilst this investment boom has centred around the giants of the technology industry and venture capitalists in the private sector, few large scale scientific research facilities have been developed without government grants or subsidies as this December 2014 FRBSF Economic Letter – Innovation and Incentives: Evidence from Biotech – makes abundantly clear:-

The adoption of biotech subsidies raises the number of star scientists in a state by 15% relative to that state’s pre-adoption number of stars. We find a similar effect from the adoption of R&D credits. These findings are important because of the role star scientists play on the local development and survival of U.S. biotech clusters. In addition, we find that most of the increase in the number of stars is due to their relocation to states that adopt incentives. Meanwhile, subsidies have only a limited effect on the productivity, measured by patenting, of incumbent scientists already in the state. We also find that the increase in star scientists happening after a state adopts a biotech incentive is entirely due to an increase in private/for-profit sector scientists, with no detectable increase in academic scientists.

The authors’ conclusions, however, are qualified:-

We found that, after states adopted incentives, they experienced significant increases in the number of star scientists, the total number of biotech workers, and the number of establishments, but limited effects on salaries and patents. We also uncovered significant spillover effects from biotech incentives to employment in other sectors that provide services in the local economy such as retail and construction.

In terms of policy implications, it is important to keep in mind that our finding that biotech subsidies are successful at attracting star scientists and at raising local biotech employment do not necessarily imply that the subsidies are economically justified. The economic benefits to a state of providing these incentives must be weighed against their fiscal costs—for instance, the loss of tax revenues and resulting loss of public services. Our research suggests that state incentives are successful at increasing the number of jobs inside the state. Nevertheless, our results do not suggest that the social benefit—either for that state or for the nation as a whole—is larger than the cost to taxpayers, nor that incentives for innovation are the most effective way to increase jobs in a state.

Government incentives may appear benign, but, as Michael Dell put it, in a November 2014 Op Ed for the Wall Street Journal – Going Private Is Paying Off for Dell:-

Yet we find ourselves in a world increasingly afflicted with myopia-governments that can’t see beyond the next election, an education system that can’t see beyond the next round of standardized tests, and public financial markets that can’t see beyond the next trade. This was what Dell faced as a public company. Shareholders increasingly demanded short-term results to drive returns; innovation and investment too often suffered as a result. Shareholder and customer interests decoupled.

My personal preference is for a free-market approach, despite the risk of underinvestment in the most capital intensive areas of research.

Valuation?

The valuation of growth stocks has always been fraught with uncertainty, especially when future cashflows are often deferred by several years and earnings forecasts, subject to significant variance. An even greater difficulty, as the chart above makes clear, is to assess, and hopefully anticipate, the herd behaviour of technology investors.

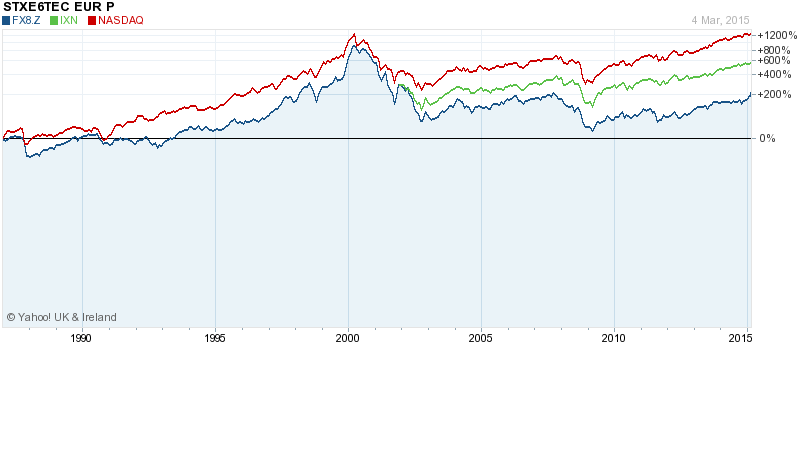
The chart below shows the differential performance of the STOXX Europe 600 Technology Index (FX8.Z) the global IXN Technology ETF and the Nasdaq Composite:-

Stox Tech Euro 600 Nasdaq IXN Global Tech ETF

Source: Yahoo Finance

The European dalliance with technology investment was shorter lived than in the US. So was the violence of the subsequent bust. The market had still not cleared by 2008 and achieved new lows for the decade. The subsequent recovery has been muted. The IXN appears to be roughly halfway between the two extremes. US investor perception of technology seems to be substantially rosier than that of the European investor.

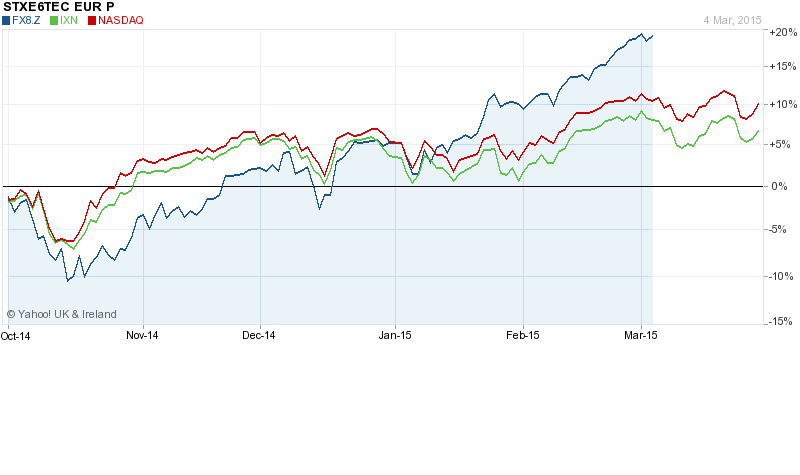
The six month chart reveals a rather different picture. Since the equity market correction last November, European technology has out-performed both the US and other technology stocks globally:-

Tech stocks 6 months

Source: Yahoo Finance

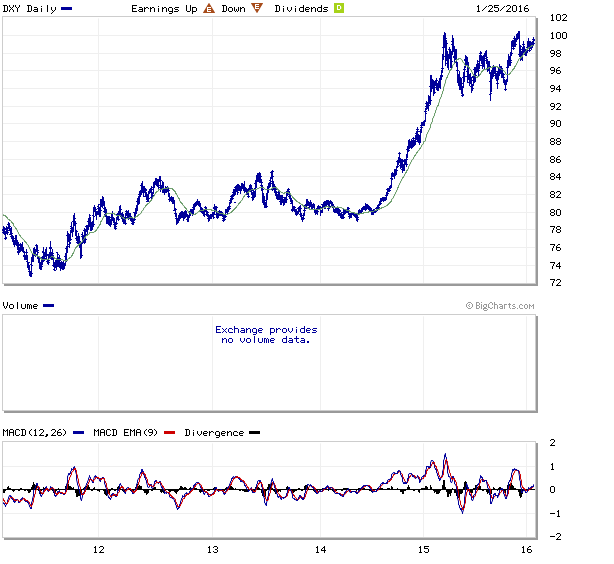
Looks can be deceptive. This move has been broader based than simply the European technology sector. Led by Germany, most Eurozone stock markets have traded higher. This has largely coincided with the QE actions of the ECB and the steady weakening in the value of the Euro that this policy has abetted. The Euro Effective Exchange Rate has fallen from 100 to 90 over the same period.

Research carried out by LinkedIn sheds a unique perspective on global trends in technology industries. Their analysis focussed on migrating workers, identifying which countries and cities were net beneficiaries. This July 2014 article from Bruegal – Fact of the week: Not one European city in the top 10 for tech talenttakes up the story:-

In terms of skills uniquely identified in movers, Math, Science, Technology and Engineering seem to play a particularly important role. In terms of industries, movers are found to work mostly in media and entertainment; professional services; oil and energy; government, education and non-profit but most importantly, technology-software.

…Five out of ten cities attracting people with tech skills (especially IT infrastructure and system managements; Java development and web programming) are located in India, including the first four of the list. San Francisco only comes fifth, followed by two other US cities and two Australian.

No European city at all makes it to the list. For the 52 cities looked at in the study, the median percentage of new residents with tech skills was 16%, or just under 1 in 6; in many of the Indian cities, its more than double that figure. European cities are the real laggards: the percentage of new residents with tech skills was 18% in Berlin, 15% in Paris, 13% in Madrid and 11% in Paris.

The trend obviously mirror the Indian ongoing technology boom, in a still rather “virgin” environment. Kunal Bahl – founder of Snapdeal, a wannabe Indian Amazon – told USA Today in 2011 that India offers huge opportunity “because there are no mature companies, like Google and Microsoft, over there. The feeling is like in the U.S. in 1999.”

But there may be more to that.. Research by Vivek Wadhwa (Stanford) revealed that half of Silicon Valley start-ups were launched by immigrants, many of them educated in US top universities. But he also noticed that “for the first time, immigrants have better opportunities outside the U.S.” because, among other things, of rather strict immigration laws and California’s steep cost of living. Bahl himself, who studied in the US and spent some time working at Microsoft, reportedly wanted to initiate his company in the US but eventually went back to India because of visa problems.

And this is also why the tech industry – at the (by now almost) desperate search for engineers – is supporting the introduction of specific “start-up visa” for high-skilled workers in the US. The insights provided by this data is particularly important in the context of the recent discussions on the US immigration reform, but it is not without implications for Europe, which is at the bottom of the ranking as far as attracting tech talent is concerned.

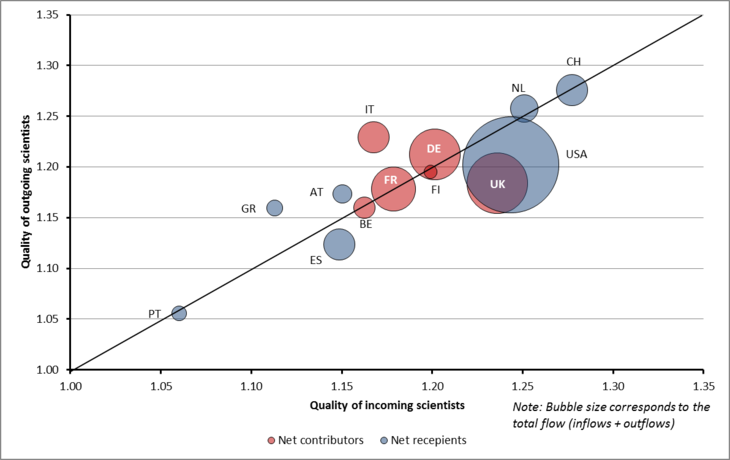
This research suggests that the recent outperformance of the European technology sector may be short lived, yet, another article from November of last year by Bruegal – Brain drain, gain, or circulation? – indicates a somewhat more optimistic outcome for parts of Europe, specifically the UK and Spain:-

Quality of Scientists - OECD

Source: Bruegal, OECD

This chart benchmarks the median quality of scientists leaving or moving (for the first time) to a country between 1996-2011. The size of the bubble corresponds to total flows (inflows plus outflows). Countries in red are net contributors to the international market for scientists, those in blue net recipients.

Ideally, a country should want to be below or on the 45-degree line, indicating that the quality of the newcomers is just as high (or higher) as that of the leavers. Conditional on this, a country should also prefer a larger rather than smaller bubble, representing a sizeable flow of scientists and indicating a full exploitation of synergies gained from international cooperation. Finally, countries should aim to land in the top-right quadrant, indicating higher quality of both incoming and outgoing researchers. 

Over the long-term (pre-crisis) period analysed, Spain and the UK seemed the best placed at attracting high-quality scientists. France and Germany were broadly breaking even in terms of quality, although we note that they were facing significant net outflows of scientists, as was the UK.

All in all, in the sample here presented, while the US (unsurprisingly) comes out as the top performer in terms of net inflow of quality researchers, Italy ranks quite poorly. Not only the country is a net contributor of scientists, it also trades high quality researchers for lower quality ones. Time for a reform of the university system?

The EU Commission is seeking to address the deficiencies of innovation policy within its borders. At a Bruegal event last January in a speech entitled – The New European Research Agenda – Commissioner Moedas – outlined plans to improve the environment for innovation:-

First, create the framework conditions for a more productive exchange of research results, fundamental science and innovation. Things like:

Screen the regulatory framework in key sectors in order to remove bottlenecks

Accelerate the implementation of standardisation

Promote the public procurement of innovation and innovation in the public sector

Promote a venture capital culture

Reduce bureaucracy in science and innovation systems

Second, is to consolidate fundamental research as the flagship for Europe. As the essential foundation for a knowledge-based society. Working towards a single, open market for knowledge though open science.

Third: implement Horizon 2020 and the new Investment Plan to leverage the Europe economy towards a higher plane as a research and innovation-based area. Working towards a single, open market for knowledge though open science. It is better to focus on our potential than to dwell on illusions. We will always be different from other parts of the world. But that difference has many benefits!

These are stirring words, but in the EU turning words into deeds takes time. In unfettered, free-markets, resources are allocated more efficiently. Nonetheless, hope remains.

In terms of absolute valuation, US technology bulls point to the relatively undemanding PE ratio of the Nasdaq – around 24 times, vs 175 times during the zenith of the Dotcom frenzy. On the other hand, commentators such as Dent Research point to a flat-lining phase of the 45 year innovation cycle – this phase commenced around 2010 and will last until around 2032:-

It shows how clusters of powerful technologies increase productivity and move mainstream for about 22.5 years, like what we saw from 1988 into 2010.

Now we’re in the doldrums of this cycle and won’t move into the next upward swing again until after 2032. In short, the productivity revolution is over for the next two decades or so. That means less earnings and wage gains, regardless of demographic trends.

Interestingly, Dent then go on to wax lyrical about the potential for Bio-tech. In technology even the bears tend to be bullish about something.

We need to read Robert Gordon – Is US economic growth over? Faltering innovation confronts the six headwinds, to find a real bear. His CEPR paper was published in 2012 but these are ideas he has been developing for more than a decade. The premise is that the economic growth of the last 250 years is the exception rather than the rule:-

The ideas developed here are unorthodox yet worth pondering. They are applied only in the context of the US, because the worldwide frontier of productivity and the standard of living have been carved out by the US since the late 19th century. If growth of the US productivity frontier slows down, other nations may move ahead, or the slowing frontier could reduce the opportunities for future growth by all nations as the pace of productivity growth in the US fades out…

… The paper suggests that it is useful to think of the innovative process as a series of discrete inventions followed by incremental improvements which ultimately tap the full potential of the initial invention. For the first two industrial revolutions, the incremental follow-up process lasted at least 100 years. For the more recent IR3, the follow-up process was much faster. Taking the inventions and their follow up improvements together, many of these processes could happen only once. Notable examples are speed of travel, temperature of interior space, and urbanisation itself.

The benefits of ongoing innovation on the standard of living will not stop and will continue, albeit at a slower pace than in the past. But future growth will be held back from the potential fruits of innovation by six “headwinds” buffeting the US economy, some of which are shared in common with other countries and others are uniquely American. Future growth in real GDP per capita will be slower than in any extended period since the late 19th century, and growth in real consumption per capita for the bottom 99% of the income distribution will be even slower than that.

Gordon goes on to identify six headwinds buffeting the US economy – slowing the pace of GDP growth:-

  1. The disappearance of the demographic dividend
  2. Educational attainment
  3. Rising income inequality
  4. Outsourcing (especially due to technological development)
  5. Environmental constraints on energy pollution
  6. Combined household and government debt

These are important impediments to growth but I believe not all of them are as clear cut as Gordon suggests.

Firstly, the demographic dividend may be in decline but technology has made it easier for people to work until much later in life. Added to which, a more flexible labour market encourages greater participation. I wonder whether the decline in labour force participation is to some extent due to the improvement in welfare provision and not just a deficit of permanent “quality” jobs?

Despite the concerns of Gordon and Bruegal, education is in the process of being revolutionised by new technologies. Mass Open Online Courses (MOOCs) are but one aspect of this sea-change. The cost of providing education – which has risen inexorably over the last 50 years – could be reversed. Of course Gordon has cause for concern about educational achievement. Whilst technology will allow “the horse to be led to water” it is another matter “making it drink”. The Economist – Wealth without workers, workers without wealth – from October 2014, discusses this issue in the broader context of new technologies disruption of labour markets globally:-

The modern digital revolution—with its hallmarks of computer power, connectivity and data ubiquity—has brought iPhones and the internet, not crowded tenements and cholera. But, as our special report explains, it is disrupting and dividing the world of work on a scale not seen for more than a century. Vast wealth is being created without many workers; and for all but an elite few, work no longer guarantees a rising income.

Income inequality is a popular economic theme and Gordon pays tribute to Emmanuel Saez – though not Thomas Piketty who has become its popular champion. From my interpretation of Piketty’s book, I believe that income inequality is a natural outcome of the long term benefits of peace. Reducing government intervention in the functioning of free markets is a better solution to this structural problem. Smaller government will not remove inequality but it will increase economic mobility, and, in the process, create faster economic prosperity – thereby more rapidly improving the standard of living for the greatest number of people. In freer markets, the technology entrepreneur, and creative risk takers in general, have a greater incentive to embrace opportunities.

Outsourcing is not new, David Riccardo observed its effects long ago. As rich countries adapt to concentrate on their comparative advantages – hopefully undistorted by government subsidy and protective tariff – the short-term headwind of lost domestic labour will be offset by the lower cost to the consumer of outsourced services. A greater proportion of a consumer’s income will then become available for investment. Once the investment has been allocated, the increased pool of available labour can then be retrained for employment in more productive enterprises. Frederic Bastiat – That Which is Seen and That Which is Not Seen makes this point much more eloquently than I could hope to do.

At the global level, man’s capacity to pollute his environment has not diminished but developing countries are less able to afford the luxury of conscience. Our best hope is technology. Yet technological discovery occurs by evolutionary leaps rather than steady increment. The lag between discovery and commercial application can also be long and variable. The collapse in the price of photovoltaic cells, making solar power dramatically more viable as an alternative to fossil fuel, is but one example. The tantalising potential of the development of tidal energy generation is another – especially given man’s predilection to inhabit the margins of the sea. Carbon sequestration technology – at present uneconomic – might be the next technological “leap”. I remain an optimist about man’s ingenuity. Since the Economist first published its Commodity Index in 1864 the price of commodities has been falling by roughly 1% per annum in inflation adjusted terms – punctuated by sharp price increases normally associated with war. Peace leads to investment and, as new technologies are adopted, prices begin to march lower once more.

This leaves Gordon’s concern about debt. Now, debt is a problem. It can be overcome, but the solution to excessive debt is not more debt. Deleveraging can be achieved by steady reduction or sudden default. Sadly, history favours the latter approach – I wonder whether Polonius’s advice to Laertes today would have been:-

Always a borrower never a lender be,

For loan oft loses both itself and bank,

And borrowing sure as hell beats husbandry.

Last September – Deleveraging, What Deleveraging? The 16th Geneva Report on the World Economy – discussed this global issue in detail:-

Contrary to widely held beliefs, the world has not yet begun to delever. Global debt-to-GDP is still growing, breaking new highs. Figure 1 shows the evolution of total debt (excluding the financial sector) for our global sample (advanced economies plus major emerging market economies). While there was a pause during 2008-09, the rise of the global debt-GDP ratio recommenced in 2010-2011.  Data in the report also show that debt-type external financing (leverage) continues to dominate equity-type financing (stock market capitalisation)

Global Debt to GDP

Source: CEPR

Perhaps surprisingly, the authors advise central banks to be cautious about interest rate increases in this environment:-

In such a context, and with still very high leverage, allowing the real rate to rise above its natural level would risk killing the recovery. Beyond pushing the economy into a prolonged period of stagnation, this would also put at risk the deleveraging process which is already very challenging.

Although there is a lot of uncertainty about such predictions, our call is for caution on interest rate rises. The case for caution in pre-emptively raising interest rates is reinforced by the weakness of inflationary pressures.

…The policy requirements for successful exit from a leverage trap are much broader than the appropriate conduct of monetary policy. The report addresses the fiscal challenges, the scope for macro-prudential policies and the restructuring of private-sector (bank, household, corporate) debt and sovereign debt.

The report also argues that – given the risks and costs associated with excessive leverage – more needs to be done to improve the resilience of macro-financial frameworks to debt shocks and to discourage excessive debt accumulation. Finally, we advocate enhanced international policy cooperation in addressing excessive global leverage.

I keep hearing the immortal words of Stan Laurel:-

Well, here’s another nice mess you’ve gotten me into.

Signs of fatigue

With all markets, I begin my analysis with technical patterns. This is a form of self-preservation; to paraphrase Keynes, I may be right in my fundamental analysis but the market is never wrong. On this basis I see no compelling reason to exit the technology sector, although there is a case to be made for rotation out of the Nasdaq and into technology stocks in Europe. I make the caveat, however, that European stocks have inherently less liquidity than US stocks and are therefore likely to exhibit greater volatility, especially on the downside.

The second stage of my analysis is to look at the change in the makeup of tech indexes. The constituents of the Nasdaq are a case in point. The table below shows the top 10 stocks by market capitalisation in 2000 and 2015:-

2000 2015
Microsoft MSFT Apple AAPL
Cisco CSCO Google GOOG
Intel INTC Microsoft MSFT
Oracle ORCL Facebook FB
Sun Microsystems JAVA Amazon.com AMZN
Dell Computer DELL Intel INTC
MCI WorldCom MCWEQ Gilead Sciences GILD
Chartered Semiconductor CHRT Cisco CSCO
Qualcomm QCOM Comcast CMCSA
Yahoo! YHOO Amgen AMGN

Source: Nasdaq

Several of the names have changed, added to which, many of today’s valuations, as measured by P/E ratios, are far less demanding – although Amazon (AMZN) at more than 700 times earnings, remains a notable exception. Looked at from another perspective, the technology promise of 2000 has delivered – today’s top tech companies are delivering real earnings. To understand whether the undemanding multiples are a harbinger of a period of “ex-growth” to come or represent an undervalued opportunity, we need to examine each individual stock in detail. This is beyond the macroeconomic analysis of this report, but one “macro” factor worth considering is the question of debt versus equity finance.

Equity versus Debt

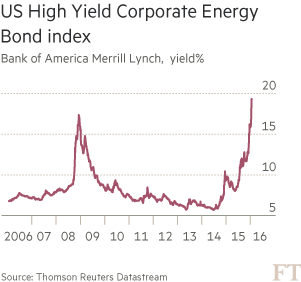
At the risk of making a sweeping generalisation, technology companies are more likely to finance their projects via equity than debt – although established, large cap, technology companies make ample use of the capital markets. Technology projects often require long-lead times to deliver positive cashflows and the value created is invariably intellectual rather than physical. An Oil company with proven reserves may have to wrestle with the volatility in the price of crude oil, but it can mortgage those “reserves” – they have a fairly predictable future demand. Technology companies must endure the vicissitudes of disruptive innovation. Todays “must have” products can rapidly become tomorrow’s museum “curiosities”. To this extent, technology firms are better placed to weather a cycle of increasing interest rates because they carry less debt.

Here lies a dilemma. In the absence of the interest rate on debt to signal the riskiness of an investment, the availability of equity finance becomes critical. As the IPO market has become more active, venture capitalists have been pouring money into earlier and earlier investment opportunities to avoid having to pay too high a price for private equity – I’ve heard the phase “pre,pre-seed” which smacks of a lack of discrimination. Access to equity investment should be a signal about the validity of a project – in the current “overinvestment” environment, the informational value of this “signal” is dramatically diminishing.

Conclusions and Investment Opportunities

The current technology boom is very different from the dotcom bubble of 2000. The top companies in the sector have real earnings and trade at less demanding PE multiples. There are still early stage companies which have no cashflows but these are the much less prevalent today. At the risk of stating the obvious, look for companies with low debt to equity ratios, since these will weather the storm of rising interest rates more comfortably. Look for companies with growing earnings and, where possible, growing dividends. Keep a close watch on the price trend of the stock and have a stop-loss level in mind at which you will exit to preserve capital, regardless of your own opinions. Set a price target if you wish but remember that markets are prone to irrationality – I tend to let the “trend be my friend”.

For the present, technology stocks look set to continue rising, but it is important to remember that the correlation between equity indices tend to be high – The Nasdaq and the S&P500 have a one month correlation of more than 90%. Interest Rates may stay low for a protracted period, but the risk is asymmetric – not far to fall, a long way to rise – and conventional wisdom, which advocates investment in stocks because they are negatively correlated to bonds, may be severely tested as central bank interest rates normalise globally. For more on this topic the November 2013 paper from Pimco – The Stock-Bond Correlation is well worth investigation.

A final caveat concerning technology stocks. Most of the constituents of tech indices are growth stocks and therefore tend to have higher betas than the underlying index. This is a simple measure of their volatility – replete with Gaussian assumptions of “normality”. When constructing your investment strategy, keep the absolute level of volatility in mind, albeit is a measure of variance rather than risk. If this is a technology bubble, make allowance for it and you will weather its tempests, underestimate it and you will be forced to capitulate; the bull market isn’t over yet and the broader market will determine the timing of its demise.