Macro Letter – No 138 – 21-05-2021
First In, First Out – China as a Leading Indicator
- China was the first country to recover from the Covid-19 pandemic
- The PBoC began tightening monetary conditions in May 2020
- Chinese housing and stocks remain strong despite official policy
- Chinese contagion remains a risk to the global recovery
Whilst there are many aspects of the Chinese command economy which differ radically from that of the US, it is worth examining the performance of China’s economy, fiscal and monetary policy, and its financial markets. They may afford some insight into the future direction of other developed and developing markets as we gradually emerge from the Covid crisis: –
Source: Trading Economics
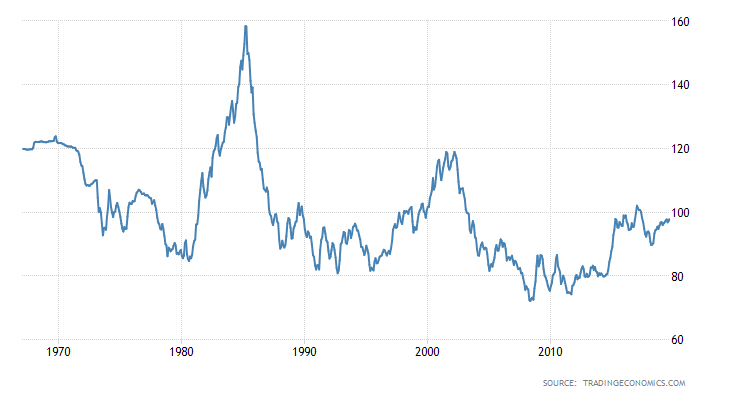
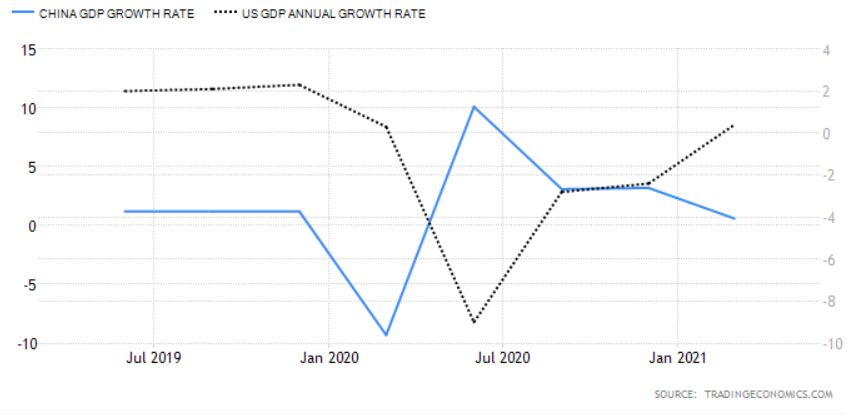
As can be seen from the chart above, whilst China was the first country to be struck by the Covid-19 pandemic it was also the first country to recover, however, a comparison of the Chinese and US bond markets provides a rather different picture: –

Source: Trading Economics
Chinese bond yields reached their lows at roughly the same time as those of the US, since when they have returned more rapidly to their pre-pandemic levels. If the US follows a similar trajectory the yield on US Treasuries is set to rise further.
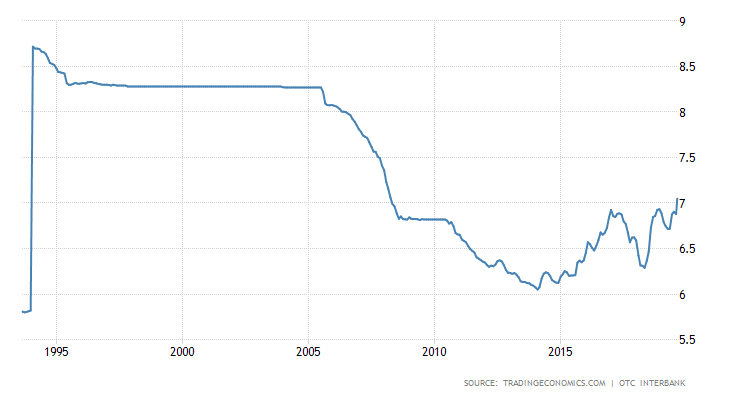
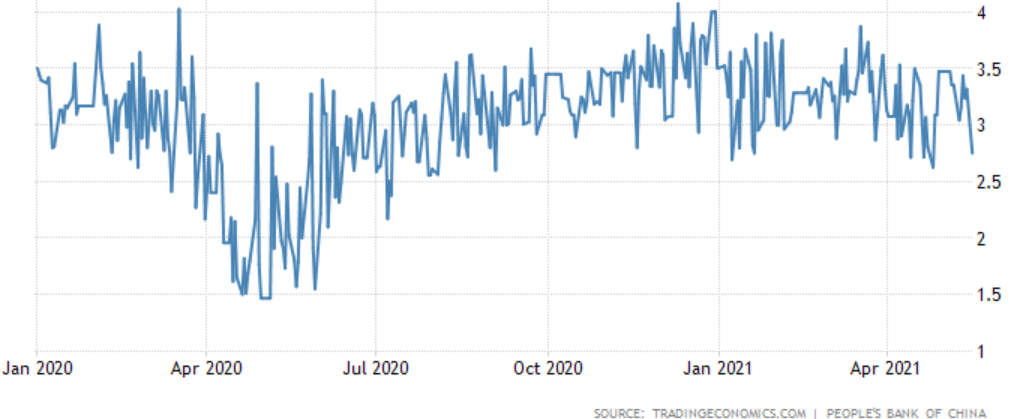
It can be argued, however, that the plight of the Chinese bond market is a function of the monetary stance of the People’s Bank of China (PBoC). When the crisis first erupted the PBoC cut its interest rate corridor by 0.3% and also drove down Chinese interbank rates by around 1.2% through its open market operations. By May 2020 that policy had changed, accommodation was replaced by a steady drain of liquidity.
The chart below shows the, rather volatile, 3 month Shibor rate, this is in marked contrast to the ‘lower for longer’ approach taken after the 2008 crisis. The Covid accommodation has been remarkably short-lived: –
Source: Trading Economics, PBoC
This PBoC tightening, which began in May 2020 and has been accompanied by official talk of the need for stability and the desire to avoid creating asset bubbles, is finally becoming evident in the money supply data: –

Source: Trading Economics
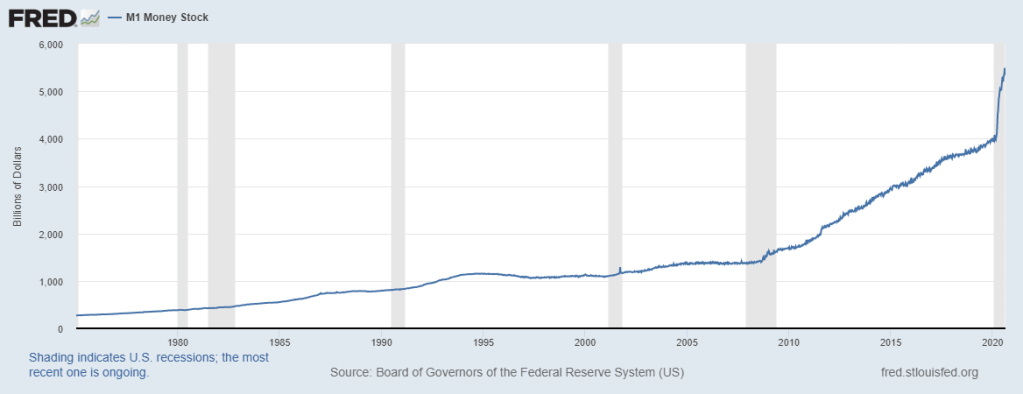
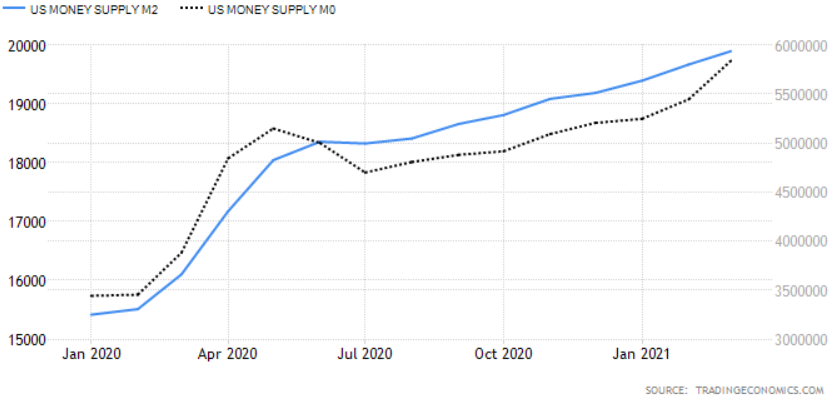
This contrasts with the continued expansion of US monetary aggregates: –
Source: Trading Economics
One of the challenges facing all central bankers is that interest rates are a blunt tool. Not all China’s asset markets have heeded the PBoC advice. The residential property market, for example, remains red hot despite the introduction of the three red lines policy – which aims to limit their liability-to-asset ratio (excluding advance receipts) to less than 70%, or their net gearing ratio to less than 100%, or their cash-to-short-term debt ratio to less than 1x, or a combination of all three. New home prices surged on regardless, gaining 4.8% in April, led by luxury real estate in Shenzhen, Shanghai and Guangzhou which is up 16% to 19% over the last year – a further tightening of regulation seems inevitable.
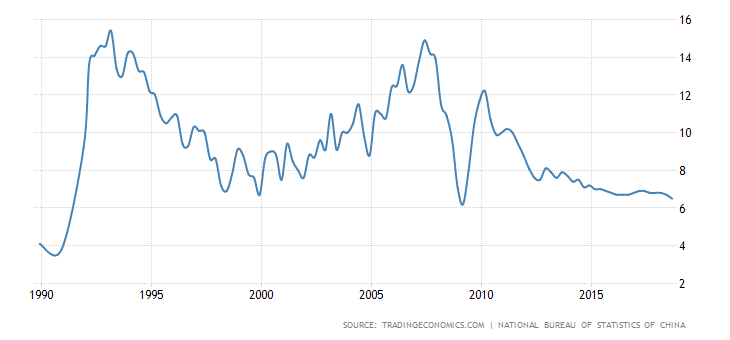
The PBoC has had greater influence elsewhere, Total Social Financing, their favoured measure of lending across the entire domestic financial system, rose by 12% in March, its slowest pace since April 2020:-

Source: Financial Times, CEIC
Another sign that official policy measures may be biting was seen in April’s retail sales which, whilst they rose by 17.7%, were down from a 34.2% in March, and came in well below the consensus forecast of 24.9%. Here again, China appears to be a leading indicator of the direction that the US economy might take: –

Source: Trading Economics
Interestingly, unlike 2015, the Chinese stock market has, thus far, reacted in a more measured way to the general tightening of monetary conditions. The next chart shows the relative performance of the Shanghai Composite versus the S&P 500 Index: –
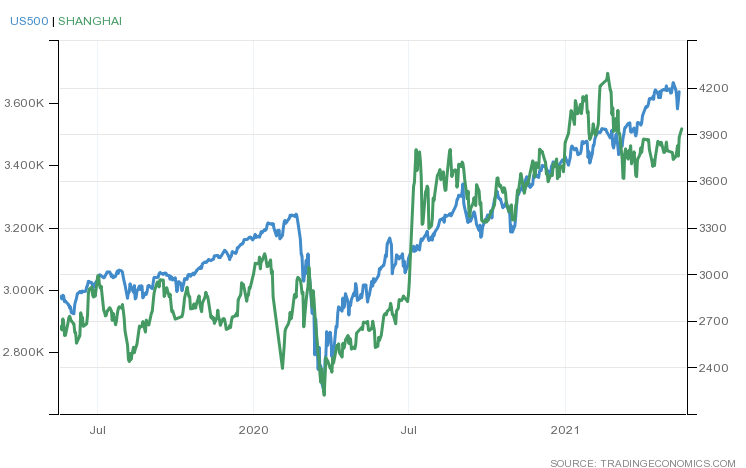
Source: Trading Economics
As mentioned above, money supply data points to a slowing of the Chinese economy but, like so many other countries, China saw a sharp rise in its, already high, household saving rate. The Paulson Institute estimates that Chinese households saved 3% more of their income than prior to Covid; Pantheon Macroeconomics equate this pool of savings to roughly 3% of GDP. While many commentators suggest that in China’s case this is a pool of precautionary saving, consumption will likely resume its long-term growth, now that employment prospects have begun to improve. The chart below shows the lagged trajectory of unemployment in US compared to China: –
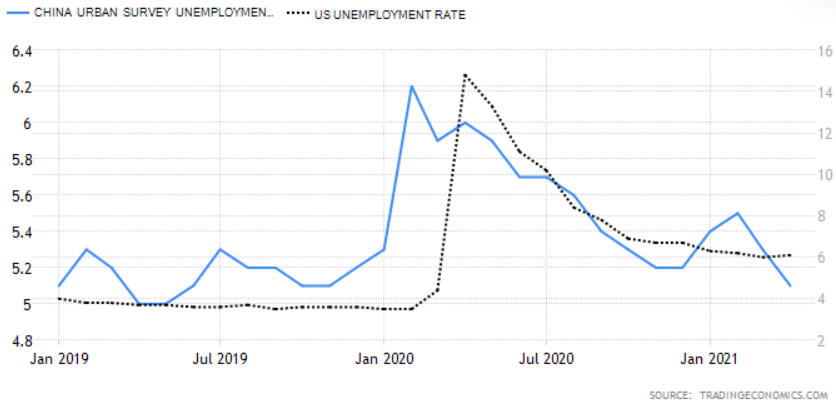
Source: Trading Economics
US unemployment remains elevated relative to its pre-Covid rate but the economic recovery continues to gather momentum.
In China, as elsewhere, that portion of excess savings not consumed will either be left on deposit, used to reduce debt or invested. Even though interest rates have risen, the liquidity of Chinese capital markets should remain plentiful for the next six months to a year, sufficient to cushion any sudden downturns in the post-Covid recovery.
Conclusions and Investment Opportunities
In the analysis above, I have produced a strew of charts suggesting that the US may follow the trajectory of China as the post-Covid recovery unfolds. This is almost certainly too simplistic. Above all else Beijing craves stability, it knows its pace of economic growth is slowing, this is structural. The investment-led growth model which has transformed the economy over the last four decades, requires the methadone of more credit to sustain even these lower rates of return. The policy of rebalancing towards domestic consumption offers longer-term hope, but China’s recovery from the Covid crisis was driven principally by investment and, to a much lesser extent, exports. The chart below, from George Friedman of Geopolitical Futures, shows the damage done to Chinese consumption by the pandemic and the subsequent rebound: –

Source: Geopolitical Futures, IMF, CEIC
The new(ish) US administration is also different from any we have seen for several decades. Markets believe in the arrival of a New New Deal fuelled by a gargantuan monetary and fiscal tonic which will heal-all. Asset prices continue to rise as The Everything Bubble inflates further.
We are still in the early stages of the economic recovery. Supply-chain constraints and labour shortages, even whilst under-employment remains elevated, have driven inflation expectations higher in the near-term, yet asset markets look beyond these shorter-term factors to the productivity gains, which have, in many cases, been a long overdue response to the crisis itself.
A few brave central bankers are seeking to temper the speculative frenzy. The majority, however, will place their emphasis on outcomes rather than the outlookas Federal Reserve Governor Lael Brainard recently stated. This politically expedient approach means fiat currencies will continue their race to the bottom, bond markets will remain neutered by the policy of QE; that leaves assets as the solitary safety-valve, somewhere between a store of wealth and thar she blows. They afford some protection against debasement and, with the advent of Decentralised Finance, there is a non-zero possibility that some of these assets might even become a means of exchange.
In the near-term we have seen the Norges Bank indicate that it may raise rates in H2 2021. The Bank of Canada has announced a tapering of government bond purchases, inking in a potential rate increase for late 2022, meanwhile the Bank of Japan, whilst it has made no bald statements, has moderated its ETF purchases and stands accused of taper by stealth because the scale of its bond-buying has actually slowed since it adopted yield curve control in 2016. These isolated actions are but clouds in a blue sky of endless liquidity but financial markets prefer to travel rather than to arrive. Choppier markets are likely over the next few months, there may be some excellent asset buying opportunities on sharp corrections.