
The Giant Debt-for-Equity Swap
I wrote this article in December 2019. Much has changed but with bond yields heading lower on the back of more QE, it still seems surprisingly valid.


The Giant Debt-for-Equity Swap
I wrote this article in December 2019. Much has changed but with bond yields heading lower on the back of more QE, it still seems surprisingly valid.

![]()
Macro Letter – No 125 – 17-01-2020
US Bonds – 2030 Vision – A decade in the doldrums
Having reached their yield low at 1.32% in July 2016, US 10yr bond yields have been locked in, just shy of, a 2% range for the last two and half years (subsequent high 3.25% and low 1.43%). For yields to fall again, supply must fall, demand rise or central banks, recommence their experimental monetary policies of negative interest rates and quantitative easing. For yields to rise, supply must rise, demand fall or central banks, reverse their multi-year largesse. Besides supply, demand and monetary policy there are, however, other factors to consider.
Demographics
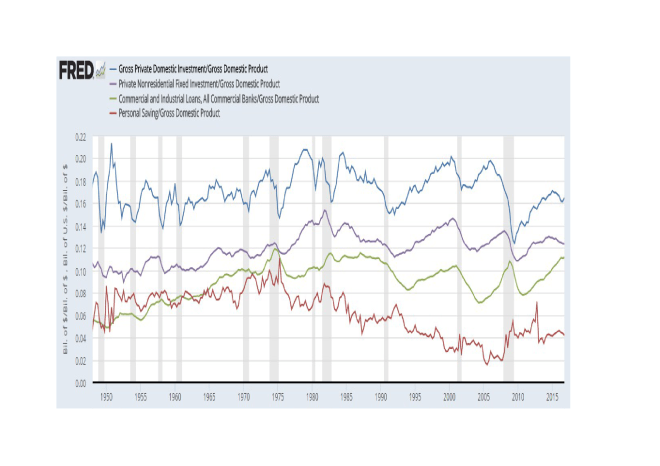
One justification for a rise in US bond yields would be an uptick in inflationary pressure. Aging demographic have been the principal driver of the downward trajectory of secular inflation. During the next decade, however, Generation Y borrowing will accelerate whilst Generation X has yet to begin their aggressive saving spree. The table below looks at the borrowing and saving patterns of the demographic cohorts in the US: –
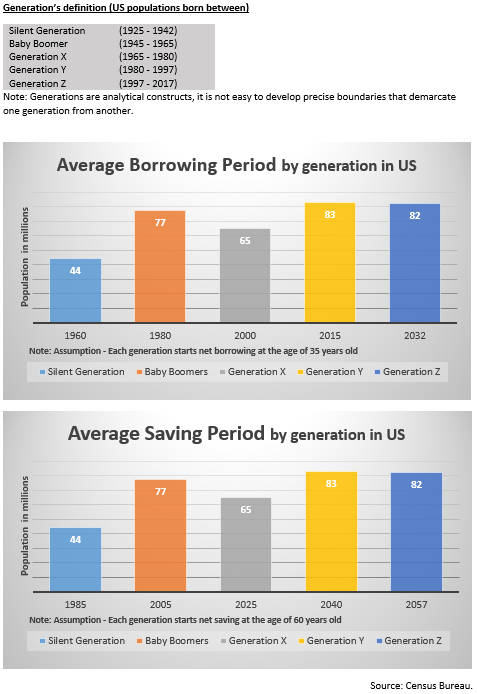
Source: US Census Bureau
Excepting the obesity and opioid epidemics, life expectancy will, nonetheless, continue to extend. The Gen Y borrowing binge will not override the aging demographic effect. It’s influence on the inflation of the next decade is likely to be modest (on these grounds alone we will not see the return of double-digit inflation) and the longer term aging trend, bolstered by improvements in healthcare, will return with a vengeance during the 2030’s, undermining the last vestiges of current welfare provisions. Much more saving will be required to pay for the increasing cost of healthcare and pensions. With bond yields of less than 4%, an aging (and hopefully healthier) population will need to continue working well beyond current retirement age in order to cover the shortfall in income.
Technology
Another secular factor which has traditionally kept a lid on inflation has been technology. As Robert Solo famously observed back in 1987, ‘You can see the computer age everywhere but in the productivity statistics.’ Part of the issue is that productivity is measured in currency terms. If the price of a computer remains unchanged for a decade but its capacity to compute increases 10-fold over the same period, absent new buyers of computers, new sales are replacements. In this scenario, the improvement in productivity does not lead to an uptick in economic growth, but it does demonstrably improve our standard of living.
Looking ahead the impact of machine learning and artificial intelligence is just beginning to be felt. Meanwhile, advances in robotics, always a target of the Luddite fringe, have been significant during the last decade, spurred on by the truncation of global supply chains in the wake of the great financial crisis. This may be to the detriment of frontier economies but the developed world will reap the benefit of cheaper goods.
Central Bank Omnipotence
When Paul Volcker assumed the helm of the Federal Reserve in the late 1970’s, inflation was eroding any gains from investment in government bonds. Armed with Friedman’s monetary theories, the man who really did remove the punch-bowl, raised short-term rates to above the level of CPI and gradually forced the inflation genie back into its bottle.
After monetary aggregate targets were abandoned, inflation targeting was widely adopted by many central banks, but, as China joined the WTO (2001) and exported their comparative advantage in labour costs to the rest of the world, those same central bankers’, with Chairman Bernanke in the vanguard, became increasingly petrified by the prospect of price deflation. Memories of the great depression and the monetary constraints of the gold exchange standard were still fresh in their minds. For an economy to expand, it was argued, the supply of money must expand in order to maintain the smooth functioning of markets: a lack of cash would stifle economic growth. Inflation targets of around 2% were deemed appropriate, even as technological and productivity related improvements insured that the prices of many consumer goods actually declined in price.
Inflation and deflation can be benign or malign. Who does not favour a stock market rally? Yet, who cares to witness their grocery bill spiral into the stratosphere? Who cheers when the latest mobile device is discounted again? But does not panic when the value of their property (on which the loan-to-value is already a consumption-sapping 90%) falls, wiping out all their equity? Blunt inflation targeting is frankly obtuse, but it remains the mandate of, perhaps, the most powerful unelected institutions on the planet.
When economic historians look back on the period since the collapse of the Bretton Woods agreement, they will almost certainly conclude that the greatest policy mistake, made by central banks, was to disregard asset price inflation in their attempts to stabilise prices. Meanwhile, in the decade ahead, upside breaches of inflation targets will be largely ignored, especially if growth remains anaemic. Central bankers’, it seems, are determined to get behind the curve, they fear the severity of a recession triggered by their own actions. In the new era of open communications and forward guidance they are reticent to increase interest rates, too quickly or by too great a degree, in such a heavily indebted environment. I wrote more about this in November 2018 in The Self-righting Ship – Debt, Inflation and the Credit Cycle: –
The current level of debt, especially in the developed economies, seems to be acting rather like the self-righting ship. As economic growth accelerates and labour markets tighten, central banks gradually tighten monetary conditions in expectation of inflation. As short-term rates increase, bond yields follow, but, unlike the pattern seen in the higher interest rate era of the 1970’s and 1980’s, the effect of higher bond yields quickly leads to a tempering of credit demand.
Some commentators will rightly observe that this phenomenon has always existed, but, at the risk of saying ‘this time it’s different,’ the level at which higher bond yields act as a break on credit expansion are much lower today in most developed markets.
Conclusions and Investment Opportunities
There have been several drivers of disinflation over the past decade including a tightening of bank regulation, increases in capital requirements and relative fiscal austerity. With short-term interest rates near to zero in many countries, governments will find themselves compelled to relax regulatory impediments to credit creation and open the fiscal spigot, at any sign of a recession, after all, central bank QE appears to have reached the limits of its effectiveness. The table below shows the diminishing returns of QE over time: –
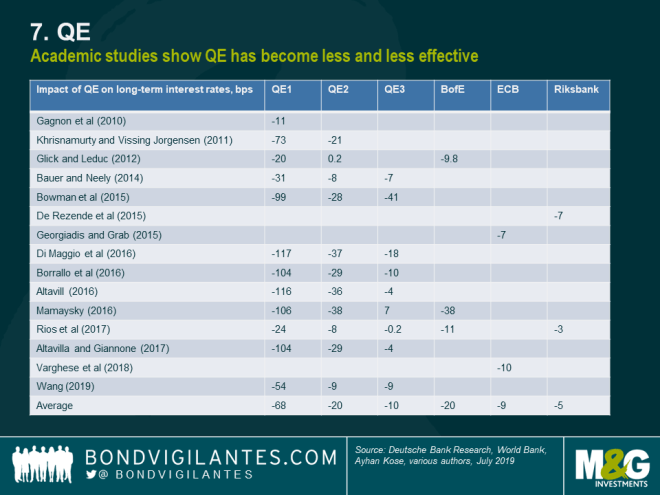
Source: M&G, Deutsche Bank, World Bank
Of course the central banks are not out of ammunition just yet, the Bank of Japan experiment with qualitative easing (they currently purchase ETFs, common stock may be next on their agenda) has yet to be adopted elsewhere and the Federal Reserve has so far resisted the temptation to follow the ECB into corporate bond acquisition.
For the US bond market the next decade may well see yields range within a relatively narrow band. There is the possibility of new record lows, but the upside is likely to be constrained by the overall indebtedness of both the private and public sector.

![]()
Macro Letter – No 111 – 15-03-2019
Capital Flows – is a reckoning nigh?
In Macro Letter – No 108 – 18-01-2019 – A world of debt – where are the risks? I looked at the increase in debt globally, however, there has been another trend, since 2009, which is worth investigating as we consider from whence the greatest risk to global growth may hail. The BIS global liquidity indicators at end-September 2018 – released at the end of January, provides an insight: –
The annual growth rate of US dollar credit to non-bank borrowers outside the United States slowed down to 3%, compared with its most recent peak of 7% at end-2017. The outstanding stock stood at $11.5 trillion.
In contrast, euro-denominated credit to non-bank borrowers outside the euro area rose by 9% year on year, taking the outstanding stock to €3.2 trillion (equivalent to $3.7 trillion). Euro-denominated credit to non-bank borrowers located in emerging market and developing economies (EMDEs) grew even more strongly, up by 13%.
The chart below shows the slowing rate of US$ credit growth, while euro credit accelerates: –
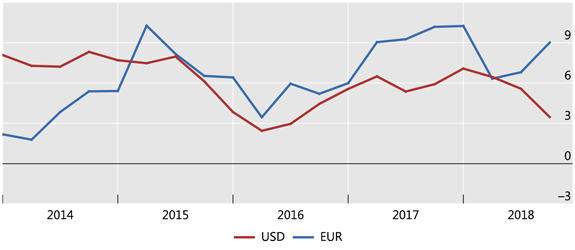
Source: BIS global liquidity indicators
The rising demand for Euro denominated borrowing has been in train since the end of the Great Financial Recession in 2009. Lower interest rates in the Eurozone have been a part of this process; a tendency for the Japanese Yen to rise in times of economic and geopolitical concern has no doubt helped European lenders to gain market share. This trend, however, remains over-shadowed by the sheer size of the US credit markets. The US$ has remained preeminent due to structurally higher interest rates and bond yields than Europe or Japan: investors, rather than borrowers, dictate capital flows.
The EC – Analysis of developments in EU capital flows in the global context from November 2018 concurs: –
The euro area (excluding intra-euro area flows) has been since 2013 the world’s leading net exporter of capital. Capital from the euro area has been invested heavily abroad in debt securities, especially in the US, taking advantage of the interest differential between the two jurisdictions. At the same time, foreign holdings of euro-area bonds fell as a result of the European Central Bank’s Asset Purchase Programme.
This bring us to another issue; a country’s ability to service its debt is linked to its GDP growth rate. Since 2009 the US economy has expanded by 34%, over the same period, Europe has shrunk by 2%. Putting these rates of expansion into a global perspective, the last decade has seen China’s economy grow by 139%, whilst India has gained 96%. Recent analysis suggests that Chinese growth may have been overstated by 2% per annum over the past decade, but the pace is still far in excess of developed economy rates. Concern about Chinese debt is not unwarranted, but with GDP rising by 6% per annum, its economy will be 80% larger in a decade, whilst India’s, growing at 7%, will have doubled.
Another excellent research paper from the BIS – The expansionary lower bound: contractionary monetary easing and the trilemma – investigates the problem of monetary tightening of developed economies on emerging markets. Here is part of the introduction, the emphasis is mine: –
…policy makers in EMs are often reluctant to lower interest rates during an economic downturn because they fear that, by spurring capital outflows, monetary easing may end up weakening, rather than boosting, aggregate demand.
An empirical analysis of the determinants of policy rates in EMs provides suggestive evidence about the tensions faced by monetary authorities, even in countries with flexible exchange rates.
…The results reveal that, even after controlling for expected inflation and the output gap, monetary authorities in EMs tend to hike policy rates when the VIX or US policy rates increase. This is arguably driven by the desire to limit capital outflows and the depreciation of the exchange rate.
…our theory predicts the existence of an “Expansionary Lower Bound” (ELB) which is an interest rate threshold below which monetary easing becomes contractionary. The ELB constrains the ability of monetary policy to stimulate aggregate demand, placing an upper bound on the level of output achievable through monetary stimulus.
The ELB can occur at positive interest rates and is therefore a potentially tighter constraint for monetary policy than the Zero Lower Bound (ZLB). Furthermore, global monetary and financial conditions affect the ELB and thus the ability of central banks to support the economy through monetary accommodation. A tightening in global monetary and financial conditions leads to an increase in the ELB which in turn can force domestic monetary authorities to increase policy rates in line with the empirical evidence presented…
The BIS research is focussed on emerging economies, but aspects of the ELB are evident elsewhere. The limits of monetary policy are clearly observable in Japan: the Eurozone may be entering a similar twilight zone.
The difference between emerging and developed economies response to a tightening in global monetary conditions is seen in capital flows and exchange rates. Whilst emerging market currencies tend to fall, prompting their central banks to tighten monetary conditions in defence, in developed economies the flow of returning capital from emerging market investments may actually lead to a strengthening of the exchange rate. The persistent strength of the Japanese Yen, despite moribund economic growth over the past two decades, is an example of this phenomenon.
Part of the driving force behind developed market currency strength in response to a tightening of global monetary conditions is demographic, a younger working age population borrows more, an ageing populous borrows less.
At the risk of oversimplification, lower bond yields in developing (and even developed) economies accelerate the process of capital repatriation. Japanese pensioners can hardly rely on JGBs to deliver their retirement income when yields are at the zero bound, they must accept higher risk to achieve a living income, but this makes them more likely to drawdown on investments made elsewhere when uncertainty rises. A 2% rise in US interest rates only helps the eponymous Mrs Watanabe if the Yen appreciates by less than 2% in times of stress. Japan’s pensioners face a dilemma, a fall in US rates, in response to weaker global growth, also creates an income shortfall; capital is still repatriated, simply with less vehemence than during an emerging market crisis. As I said, this is an oversimplification of a vastly more complex system, but the importance of capital flows, in a more polarised ‘risk-on, risk-off’ world, is not to be underestimated.
Returning to the BIS working paper, the authors conclude: –
The models highlight a novel inter-temporal trade-off for monetary policy since the level of the ELB is affected by the past monetary stance. Tighter ex-ante monetary conditions tend to lower the ELB and thus create more monetary space to offset possible shocks. This observation has important normative implications since it calls for keeping a somewhat tighter monetary stance when global conditions are supportive to lower the ELB in the future.
Finally, the models have rich implications for the use of alternative policy tools that can be deployed to overcome the ELB and restore monetary transmission. In particular, the presence of the ELB calls for an active use of the central bank’s balance sheet, for example through quantitative easing and foreign exchange intervention. Furthermore, the ELB provides a new rationale for capital controls and macro-prudential policies, as they can be successfully used to relax the tensions between domestic collateral constraints and capital flows. Fiscal policy can also help to overcome the ELB, while forward guidance is ineffective since the ELB increases with the expectation of looser future monetary conditions.
Conclusions and investment opportunities
The concept of the ELB is new, the focus of the BIS working paper is on its impact on emerging markets. I believe the same forces are evident in developed economies too, but the capital flows are reversed. For investors, the greatest risk of emerging market investment is posed by currency, however, each devaluation by an emerging economy inexorably weakens the position of developed economies, since the devaluation makes that country’s exports immediately more competitive.
At present the demographic forces favour repatriation during times of crisis and repatriation, at a slower rate, during times of EM currency appreciation. This is because the ageing economies of the developed world continue to drawdown on their investments. At some point this demographic effect will reverse, however, for Japan and the Eurozone this will not be before 2100. For more on the demographic deficit the 2018 Ageing Report: Europe’s population is getting older – is worth reviewing. Until demographic trends reverse, international demand to borrow in US$, Euros and Yen will remain popular. Emerging market countries will pay the occasional price for borrowing cheaply, in the form of currency depreciations.
For Europe and Japan a reckoning may be nigh, but it seems more likely that their economic importance will gradually diminish as emerging economies, with a younger working age population and higher structural growth rates, eclipse them.

![]()
Macro Letter – No 109 – 01-02-2019
Sustainable government debt – an old idea refreshed
The Peterson Institute has long been one of my favourite sources of original research in the field of economics. They generally support free-market ideas, although they are less than classically liberal in their approach. I was, nonetheless, surprised by the Presidential Lecture given at the annual gathering of the American Economic Association (AEA) by Olivier Blanchard, ex-IMF Chief Economist, now at the Peterson Institute – Public Debt and Low Interest Rates. The title is quite anodyne, the content may come to be regarded as incendiary. Here is part of his introduction: –
Since 1980, interest rates on U.S. government bonds have steadily decreased. They are now lower than the nominal growth rate, and according to current forecasts, this is expected to remain the case for the foreseeable future. 10-year U.S. nominal rates hover around 3%, while forecasts of nominal growth are around 4% (2% real growth, 2% inflation). The inequality holds even more strongly in the other major advanced economies: The 10-year UK nominal rate is 1.3%, compared to forecasts of 10-year nominal growth around 3.6% (1.6% real, 2% inflation). The 10-year Euro nominal rate is 1.2%, compared to forecasts of 10-year nominal growth around 3.2% (1.5% real, 2% inflation). The 10-year Japanese nominal rate is 0.1%, compared to forecasts of 10-year nominal growth around 1.4% (1.0% real, 0.4% inflation).
The question this paper asks is what the implications of such low rates should be for government debt policy. It is an important question for at least two reasons. From a policy viewpoint, whether or not countries should reduce their debt, and by how much, is a central policy issue. From a theory viewpoint, one of pillars of macroeconomics is the assumption that people, firms, and governments are subject to intertemporal budget constraints. If the interest rate paid by the government is less the growth rate, then the intertemporal budget constraint facing the government no longer binds. What the government can and should do in this case is definitely worth exploring.
The paper reaches strong, and, I expect, surprising, conclusions. Put (too) simply, the signal sent by low rates is that not only debt may not have a substantial fiscal cost, but also that it may have limited welfare costs.
Blanchard’s conclusions may appear radical, yet, in my title, I refer to this as an old idea, allow me to explain. In business it makes sense, all else equal, to borrow if the rate of interest paid on your loan is lower than the return from your project. At the national level, if the government can borrow at below the rate of GDP growth it should be sustainable, since, over time (assuming, of course, that it is not added to) the ratio of debt to GDP will naturally diminish.
There are plenty of reasons why such borrowing may have limitations, but what really interests me, in this thought provoking lecture, is the reason governments can borrow at such low rates in the first instance. One argument is that as GDP grows, so does the size of the tax base, in other words, future taxation should be capable of covering the on-going interest on today’s government borrowing: the market should do the rest. Put another way, if a government become overly profligate, yields will rise. If borrowing costs exceed the expected rate of GDP there may be a panicked liquidation by investors. A government’s ability to borrow will be severely curtailed in this scenario, hence the healthy obsession, of many finance ministers, with debt to GDP ratios.
There are three factors which distort the cosy relationship between the lower yield of ‘risk-free’ government bonds and the higher percentage levels of GDP growth seen in most developed countries; investment regulations, unfunded liabilities and fractional reserve bank lending.
Let us begin with investment regulations, specifically in relation to the constraints imposed on pension funds and insurance companies. These institutions are hampered by prudential measures intended to guarantee that they are capable of meeting payment obligations to their customers in a timely manner. Mandated investment in liquid assets are a key construct: government bonds form a large percentage of their investments. As if this was not sufficient incentive, institutions are also encouraged to purchase government bonds as a result of the zero capital requirements for holding these assets under Basel rules.
A second factor is the uncounted, unfunded, liabilities of state pension funds and public healthcare spending. I defer to John Mauldin on this subject. The 8th of his Train-Wreck series is entitled Unfunded Promises – the author begins his calculation of total US debt with the face amount of all outstanding Treasury paper, at $21.2trln it amounts to approximately 105% of GDP. This is where the calculations become disturbing: –
If you add in state and local debt, that adds another $3.1 trillion to bring total government debt in the US to $24.3 trillion or more than 120% of GDP.
Mauldin goes on to suggest that this still underestimates the true cost. He turns to the Congressional Budget Office 2018 Long-Term Budget Outlook – which assumes that federal spending will grow significantly faster than federal revenue. On the basis of their assumptions, all federal tax revenues will be consumed in meeting social security, health care and interest expenditures by 2041.
Extrapolate this logic to other developed economies, especially those with more generous welfare commitments than the US, and the outlook for rapidly aging, welfare addicted developed countries is bleak. In a 2017 white paper by Mercer for World Economic Forum – We Will Live to 100 – the author estimates that the unfunded liabilities of US, UK, Netherlands, Japan, Australia, Canada, China and India will rise from $70trln in 2015 to $400trln in 2050. These countries represent roughly 60% of global GDP. I extrapolate global unfunded liabilities of around $120trln today rising to nearer $650trln within 20 years: –
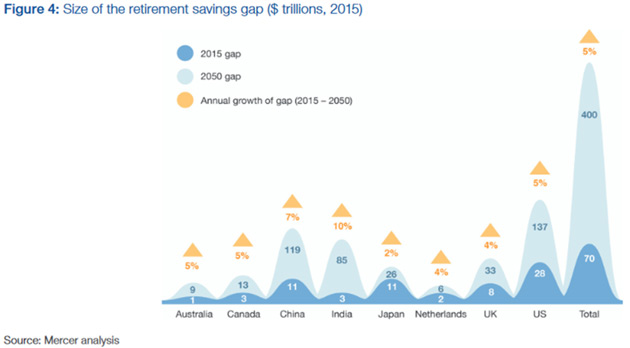
Source: Mercer analysis
For an in depth analysis of the global pension crisis this 2016 research paper from Citi GPS – The Coming Pensions Crisis – is a mine of information.
In case you are still wondering how, on earth, we got here? This chart from Money Week shows how a combination of increased fiscal spending (to offset the effect of the bursting of the tech bubble in 2000) combined with the dramatic fall in interest rates (since the great financial recession of 2008/2009) has damaged the US state pension system: –
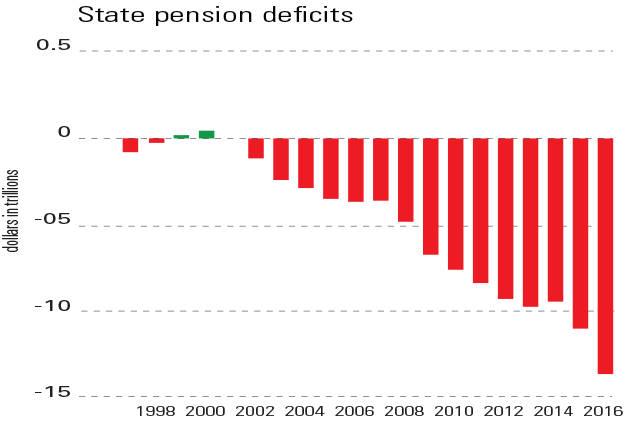
Source: Moneyweek
The yield on US Treasury bonds has remained structurally higher than most of the bonds of Europe and any of Japan, for at least a decade.
The third factor is the fractional reserve banking system. Banks serve a useful purpose intermediating between borrowers and lenders. They are the levers of the credit cycle, but their very existence is testament to their usefulness to their governments, by whom they are esteemed for their ability to purchase government debt. I discuss – A history of Fractional Reserve Banking – or why interest rates are the most important influence on stock market valuations? in a two part essay I wrote for the Cobden Centre in October 2016. In it I suggest that the UK banking system, led by the Bank of England, has enabled the UK government to borrow at around 3% below the ‘natural rate’ of interest for more than 300 years. The recent introduction of quantitative easing has only exaggerated the artificial suppression of government borrowing costs.
Before you conclude that I am on a mission to change the world financial system, I wish to point out that if this suppression of borrowing costs has been the case for more than 300 years, there is no reason why it should not continue.
Which brings us back to Blanchard’s lecture at the AEA. Given the magnitude of unfunded liabilities, the low yield on government bonds is, perhaps, even more remarkable. More alarmingly, it reinforces Blanchard’s observation about the greater scope for government borrowing: although the author is at pains to advocate fiscal rectitude. If economic growth in developed economies stalls, as it has for much of the past two decades in Japan, then a Japanese redux will occur in other developed countries. The ‘risk-free’ rate across all developed countries will gravitate towards the zero bound with a commensurate flattening in yield curves. Over the medium term (the next decade or two) an increasing burden of government debt can probably be managed. Some of the new borrowing may even be diverted to investments which support higher economic growth. The end-game, however, will be a monumental reckoning, involving wholesale debt forgiveness. The challenge, as always, will be to anticipate the inflection point.
Conclusion and Investment Opportunities
Since the early-1990’s analysts have been predicting the end of the bond bull market. Until quite recently it was assumed that negative government bond yields were a temporary aberration reflecting stressed market conditions. When German schuldscheine (the promissory notes of the German banking system) traded briefly below the yield of German Bunds, during the reunification in 1989, the ‘liquidity anomaly’ was soon rectified. There has been a sea-change, for a decade since 2008, US 30yr interest rate swaps traded at a yield discount to US Treasuries – for more on this subject please see – Macro Letter – No 74 – 07-04-2017 – US 30yr Swaps have yielded less than Treasuries since 2008 – does it matter?
With the collapse in interest rates and bond yields, the unfunded liabilities of governments in developed economies has ballooned. A solution to the ‘pension crisis,’ higher bond yields, would sow the seeds of a wider economic crisis. Whilst governments still control their fiat currencies and their central banks dictate the rate of interest, there is still time – though, I doubt, the political will – to make the gradual adjustments necessary to right the ship.
I have been waiting for US 10yr yields to reach 4.5%, I may be disappointed. For investors in fixed income securities, the bond bull market has yet to run its course. Negative inflation adjusted returns will become the norm for risk-free assets. Stock markets may be range-bound for a protracted period as return expectations adjust to a structurally weaker economic growth environment.
![]()
Macro Letter – No 103 – 26-10-2018
Not waving but drowning – Stocks, debt and inflation?
The recent decline in the US stock market, after the longest bull-market in history, has prompted many commentators to focus on the negative factors which could sow the seeds of the next recession. Among the main concerns is the inexorable rise in debt since the great financial recession (GFR) of 2008. According to May 2018 data from the IMF, global debt now stands at $63trln, with emerging economy debt expansion, over the last decade, more than offsetting the marking time among developed nations. The IMF – Global Debt Database: Methodology and Sources WP/18/111 – looks at the topic in more detail.
The title of this week’s Macro letter comes from the poet Stevie Smith: –
I was much further out than you thought
And not waving but drowning.
It seems an appropriate metaphor for valuation and leverage in asset markets. In 2013 Thomas Pickety published ‘Capital in the 21st Century’ in which he observed that income inequality was rising due to the higher return on unearned income relative to labour. He and his co-authors gathering together one of the longest historical data-set on interest rates and wages – an incredible achievement. Their conclusion was that the average return on capital had been roughly 5% over the very long run.
This is not the place to argue about the pros and cons of Pickety’s conclusions, suffice to say that, during the last 50 years, inflation indices have tended to understate what most of us regard as our own personal inflation rate, whilst the yield offered by government bonds has been insufficient to match the increase in our cost of living. The real rate of return on capital has diminished in the inflationary, modern era. Looked at from another perspective, our current fiat money and taxation system encourages borrowing rather than lending, both by households, corporates, for whom repayment is still an objective: and governments, for whom it is not.
Financial innovation and deregulation has helped to oil the wheels of industry, making it easier to service or reschedule debt today than in the past. The depth of secondary capital markets has made it easier to raise debt (and indeed equity) capital than at any time in history. These financial markets are underpinned by central banks which control interest rates. Since the GFR interest rates have been held at exceptionally low levels, helping to stimulate credit growth, however, that which is not seen, as Bastiat might have put it, is the effect that this credit expansion has had on the global economy. It has led to a vast misallocation of capital. Companies which would, in an unencumbered interest rate environment, have been forced into liquidation, are still able to borrow and continue operating; their inferior products flood the market place crowding out the market for new innovative products. New companies are confronted by unfair competition from incumbent firms. Where there should be a gap in the market, it simply does not exist. At a national and international level, productivity slows and the trend rate of GDP growth declines.
We are too far out at sea and have been for decades. Markets are never permitted to clear, during economic downturns, because the short-term pain of recessions is alleviated by the rapid lowering of official interest rates, prolonging the misallocation of capital and encouraging new borrowing via debt – often simply to retire equity capital and increase leverage. The price of money should be a determinant of the value of an investment, but when interest rates are held at an artificially low rate for a protracted period, the outcome is massively sub-optimal. Equity is replaced by debt, leverage increases, zombie companies limp on and, notwithstanding the number of technology start-ups seen during the past decade, innovation is crushed before it has even begun.
In an unencumbered market with near price stability, as was the case prior to the recent inflationary, fiat currency era, I suspect, the rate of return on capital would be approximately 5%. On that point, Pickety and I are in general agreement. Today, markets are as far from unencumbered as they have been at any time since the breakdown of the Bretton Woods agreement in 1971.
Wither the stock market?
With US 10yr bond yields now above 3%, stocks are becoming less attractive, but until real-yields on bonds reach at least 3% they still offer little value – US CPI was at 2.9% as recently as August. Meanwhile higher oil prices, import tariffs and wage inflation all bode ill for US inflation. Nonetheless, demand for US Treasuries remains robust while real-yields, even using the 2.3% CPI data for September, are still exceptionally low by historic standards. See the chart below which traces the US CPI (LHS) and US 10yr yields (RHS) since 1971. Equities remain a better bet from a total return perspective: –
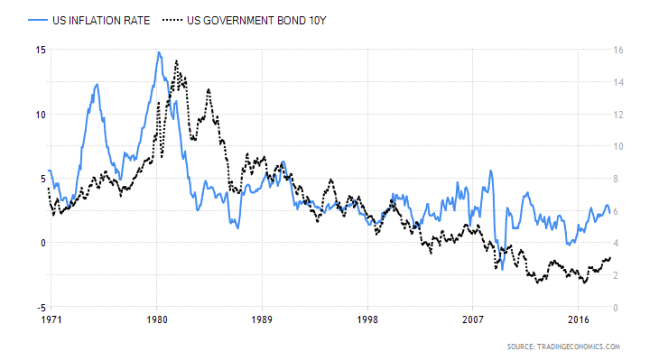
Source: Trading Economics
What could change sentiment, among other factors, is a dramatic rise in the US$, an escalation in the trade-war with China, or a further increase in the price of oil. From a technical perspective the recent weakness in stocks looks likely to continue. A test of the February lows may be seen before the year has run its course. Already around ¾ of the stocks in the S&P 500 have suffered a 10% plus correction – this decline is broad-based.
Many international markets have already moved into bear territory (declining more than 20% from their highs) but the expression, ‘when the US sneezes the world catches a cold,’ implies that these markets may fall less steeply, in a US stock downturn, but they will be hard-pressed to ignore the direction of the US equity market.
Conclusions and investment opportunities
Rumours abound of another US tax cut. Federal Reserve Chairman, Powell, has been openly criticised by President Trump; whilst this may not cause the FOMC to reverse their tightening, they will want to avoid going down in history as the committee that precipitated an end to Federal Reserve independence.
There is a greater than 50% chance that the S&P 500 will decline further. Wednesday’s low was 2652. The largest one month correction this year is still that which occurred in February (303 points). We are not far away, however, a move below 2637 will fuel fears. I believe it is a breakdown through the February low, of 2533, which will prompt a more aggressive global move out of risk assets. The narrower Dow Jones Industrials has actually broken to new lows for the year and the NASDAQ suffered its largest one day decline in seven years this week.
A close below 2352 for the S&P 500 would constitute a 20% correction – a technical bear-market. If the market retraces to the 2016 low (1810) the correction will be 38% – did someone say, ‘Fibonacci’ – if we reach that point the US Treasury yield curve will probably be close to an inversion: and from a very low level of absolute rates. Last week the FRBSF – The Slope of the Yield Curve and the Near-Term Outlook – analysed the recession predicting power of the shape of the yield curve, they appear unconcerned at present, but then the current slope is more than 80bp positive.
If the stock correction reaches the 2016 lows, a rapid reversal of Federal Reserve policy will be required to avoid accusations that the Fed deliberately engineered the disaster. I envisage the Fed calling upon other central banks to render assistance via another concert party of quantitative, perhaps backed up by qualitative, easing.
At this point, I believe the US stock market is consolidating, an immanent crash is not on the horizon. The GFR is still too fresh in our collective minds for history to repeat. Longer term, however, the situation looks dire – history may not repeat but it tends to rhyme. Among the principal problems back in 2008 was an excess of debt, today the level of indebtedness is even greater…
We are much further out than we thought,
And not waving but drowning.
Inflated Opinions author Paul Wynn discusses the current plight of Active Investment
Video – Paul discusses the current plight of Active Investment


Macro Letter – No 70 – 10-02-2017
The impact of household debt and saving on long run GDP growth
Neither a borrower nor a lender be;
For loan oft loses both itself and friend,
And borrowing dulls the edge of husbandry.
Hamlet I, iii – Shakespeare
Last week saw the publication of a fascinating working paper by the BIS – The real effects of household debt in the short and long run –the conclusions of the authors were most illuminating, here is the abstract:-
Household debt levels relative to GDP have risen rapidly in many countries over the past decade. We investigate the macroeconomic impact of such increases by employing a novel estimation technique proposed by Chudik et al (2016), which tackles the problem of endogeneity present in traditional regressions. Using data on 54 economies over 1990‒2015, we show that household debt boosts consumption and GDP growth in the short run, mostly within one year. By contrast, a 1 percentage point increase in the household debt-to-GDP ratio tends to lower growth in the long run by 0.1 percentage point. Our results suggest that the negative long-run effects on consumption tend to intensify as the household debt-to-GDP ratio exceeds 60%. For GDP growth, that intensification seems to occur when the ratio exceeds 80%. Finally, we find that the degree of legal protection of creditors is able to account for the cross-country variation in the long-run impact.
The chart below shows the growing divergence between the household debt of developed and emerging market economies:-
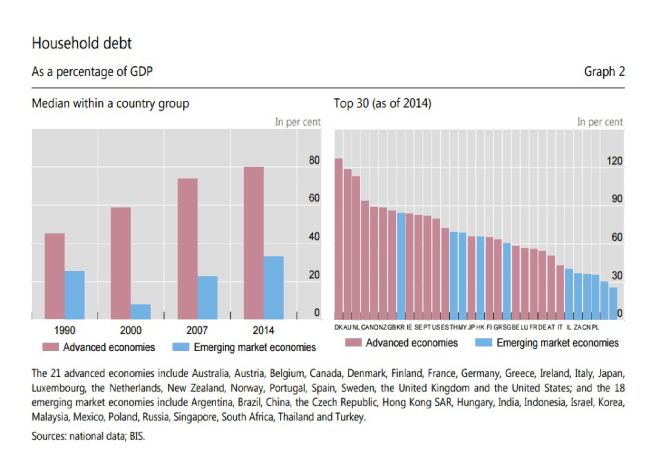
Source: BIS
Of the emerging markets, South Korea has the highest household debt ratio, followed by Thailand, Malaysia and Hong Kong: all have ratios above 60%. Singapore is on the cusp of this watershed, whilst all the remaining emerging economies boast lower ratios.
Part of the reason for lower household debt in emerging economies is the collective market memory of the Asian financial crisis of 1997. Another factor is the higher savings rate among many emerging economies. The table below is incomplete, the data has been gathered from multiple sources and over differing time periods, but it is still quite instructive. It is ranked by highest household savings rate as a percentage of GDP. On this basis, I remain bullish on the prospects for growth in the Philippines and Indonesia, but also in India and Vietnam, notwithstanding the Indian Government debt to GDP ratio of 69% and Vietnam’s budget deficit of -5.4% of GDP:-
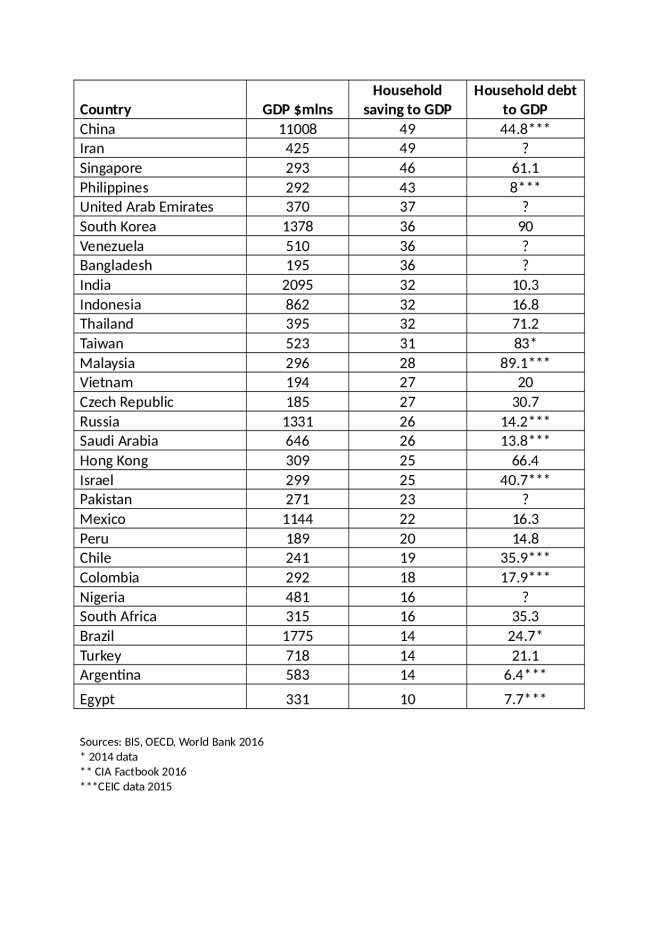
There are other countries who household sector also looks robust: China and Russia, are of note.
Last month I wrote about The Risks and Rewards of Asian Real Estate. This BIS report offers an additional guide to valuation. It helps in the assessment of which emerging markets are more likely to weather the impact of de-globalising headwinds. Policy reversals, such as the scrapping of the TPP trade deal, and other developments connected to Trump’s “America First” initiative, spring to mind.
Savings and Investment
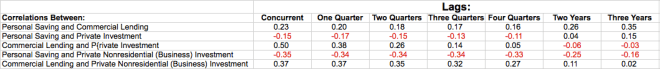
When attempting to forecast economic growth, household debt is one factor, but, according to the economics textbooks, household savings are another. Intuitively savings should support investment, however, in a recent article for Evonomics – Does Saving Cause Lending Cause Investment? (No.) – Steve Roth shows clear empirical evidence that a higher savings rate does not lead to a higher rate of investment. Here is a chart from the St Louis Federal Reserve which supports Roth’s assertions:-
Source: St Louis Federal Reserve Bank
Personal savings represents a small fraction of GDP especially when compared to lending and investment. Roth goes on to analyse the correlations:-
His assessment is as follows:-
Of course, correlation doesn’t demonstrate causation. But lack of correlation, and especially negative correlation, does much to disprove causation. What kind of disproofs do we see here?
Personal saving and commercial lending seem to be lightly correlated. The correlation declines over the course of a year, but then increases two or three years out. It’s an odd pattern, with a lot of possible causal stories that might explain it.
Personal saving and private investment (including both residential and business investment) are very weakly correlated, and what correlation there is is mostly negative. More saving correlates with less investment.
Commercial lending has medium-strong correlation with private investment in the short term, declining rapidly over time. This is not terribly surprising. But it has nothing to do with private saving.
Perhaps the most telling result here: Personal saving has a significant and quite consistent negative correlation with business investment. Again: more saving, less investment. This directly contradicts what you learned in Econ 101.
The last line — commercial lending versus business investment — is most interesting compared to line 3 (CommLending vs PrivInv). Changes in commercial lending seem to have their strongest short-term effects on residential investment, not business investment. But its effect on business investment seems more consistent and longer-term.
This is a fascinating insight, however, there are international factors at work here. This data looks at the US, but the US is a far from closed economy; the current account deficit tells you that. Setting aside cross border capital flows there are even larger forces to consider.
Firstly, in general, when an economy slows, its government increases fiscal spending and its central bank reduces interest rates. Secondly, when short term interest rates fall, banks are incentivised to borrow short and lend long. They achieve this using a fraction of their own capital, lending depositors’ money at longer maturity and profiting from the interest rate differential.
Once fiscal stimulus has run its course and banks have leveraged their reserves to the maximum, the importance of household savings should, in theory, become more pronounced, but if interest rates are low investors are likely to defer investment. If government fiscal pump-priming has failed to deliver an economic recovery, investors are likely to be dissuaded from investing. Despite Roth’s empirical evidence to the contrary, I do not believe that the household savings rate is an unimportant measure to consider when forecasting economic growth, merely that it is overshadowed by other factors.
Conclusion
Household savings may have little impact on GDP growth but Household debt does. In the UK the savings Ratio was 6.6%, whilst the Household debt to income ratio was 152% at the end of 2015. By comparison, at the end of 2014 the US the savings ratio was 5% and household debt to income a more modest 113%. The ratio of the ratios is broadly similar at around 23 times.
With interest rates still close to the lowest levels in centuries and real interest rates, even lower, debt, rather than savings, is likely to be the principal driver of investment. That investment is likely to be channelled towards assets which can be collateralised, real estate being an obvious candidate.
I began this letter with a quote from Hamlet. I wonder what advice Polonius would give his son today? The incentive to borrow has seldom been more pronounced.

Macro letter – No 61 – 16-09-2016
Is the “flight to quality” effect breaking down?
Back in 2010 I switched out of fixed income securities. I was much too early! Fortunately I had other investments which allowed me to benefit from the extraordinary rally in government bonds, driven by the central bank quantitative easing (QE) policies.
In the aftermath of Brexit the total outstanding amount of bonds with negative yields hit $13trln – that still leaves $32trln which offer a positive return. This is alarming nonetheless, according to this 10th July article from ZeroHedge, a 1% rise in yields would equate to a mark-to-market loss of $2.4trln. The chart below shows the capital impact of a 1% yield change for different categories of bonds:-

Source: ZeroHedge
Looked at another way, the table above suggests that the downside risk of holding US Treasuries, in the event of a 1% rise in yields, is 2.8 times greater than holding Investment Grade corporate bonds.
Corporate bonds, even of investment grade, traditionally exhibit less liquidity and greater credit risk, but, in the current, ultra-low interest rate, environment, the “capital” risk associated with government bonds is substantially higher. It can be argued that the “free-float” of government bonds has been reduced by central bank buying. A paper from the IMF – Government Bonds and Their Investors: What Are the Facts and Do They Matter? provides a fascinating insight into government bond holdings by investor type. The central bank with the largest percentage holding is the Bank of England (BoE) 19.7% followed by the Federal Reserve (Fed) 11.5% and the Bank of Japan (BoJ) 8.3% – although the Japanese Post Office, with 29%, must be taken into account as well. The impact of central bank buying on secondary market liquidity may be greater, however, since the central banks have principally been accumulating “on the run” issues.
Since 2008, financial markets in general, and government bond markets in particular, have been driven by central bank policy. Fear about tightening of monetary conditions, therefore, has more impact than ever before. Traditionally, when the stock market falls suddenly, the price of government bonds rises – this is the “flight to quality” effect. It also leads to a widening of the spread between “risk-free” assets and those carrying greater credit and liquidity risk. As the table above indicates, however, today the “capital” risk associated with holding government securities, relative to higher yielding bonds has increased substantially. This is both as a result of low, or negative, yields and reduced liquidity resulting from central bank asset purchases. These factors are offsetting the traditional “flight to quality” effect.
Last Friday, government bond yields increased around the world amid concerns about Fed tightening later this month – or later this year. The table below shows the change in 10yr to 30yrs Gilt yields together with a selection of Sterling denominated corporate bonds. I have chosen to focus on the UK because the BoE announced on August 4th that they intend to purchase £10bln of Investment Grade corporate bonds as part of their Asset Purchase Programme. Spreads between Corporates and Gilts narrowed since early August, although shorter maturities benefitted most.
| Issuer | Maturity | Yield | Gilt yield | Spread over Gilts | Corporate Change 7th to 12th | Gilts change 7th to 12th |
| Barclays Bank Plc | 2026 | 3.52 | 0.865 | 2.655 | 0.19 | 0.18 |
| A2Dominion | 2026 | 2.938 | 0.865 | 2.073 | 0.03 | 0.18 |
| Sncf | 2027 | 1.652 | 0.865 | 0.787 | 0.18 | 0.18 |
| EDF | 2027 | 1.9 | 0.865 | 1.035 | 0.19 | 0.18 |
| National Grid Co Plc | 2028 | 1.523 | 0.865 | 0.658 | 0.19 | 0.18 |
| Italy (Republic of) | 2028 | 2.891 | 0.865 | 2.026 | 0.17 | 0.18 |
| Kreditanstalt fuer Wiederaufbau | 2028 | 1.187 | 0.865 | 0.322 | 0.18 | 0.18 |
| EIB | 2028 | 1.347 | 0.865 | 0.482 | 0.18 | 0.18 |
| BT | 2028 | 1.976 | 0.865 | 1.111 | 0.2 | 0.18 |
| General Elec Cap Corp | 2028 | 1.674 | 0.865 | 0.809 | 0.2 | 0.18 |
| Severn Trent | 2029 | 1.869 | 1.248 | 0.621 | 0.19 | 0.18 |
| Tesco Plc | 2029 | 4.476 | 1.248 | 3.228 | 0.2 | 0.18 |
| Procter & Gamble Co | 2030 | 1.683 | 1.248 | 0.435 | 0.2 | 0.18 |
| RWE Finance Bv | 2030 | 3.046 | 1.248 | 1.798 | 0.17 | 0.22 |
| Citigroup Inc | 2030 | 2.367 | 1.248 | 1.119 | 0.2 | 0.22 |
| Wal-mart Stores | 2030 | 1.825 | 1.248 | 0.577 | 0.2 | 0.22 |
| EDF | 2031 | 2.459 | 1.248 | 1.211 | 0.22 | 0.22 |
| GE | 2031 | 1.778 | 1.248 | 0.53 | 0.21 | 0.22 |
| Enterprise Inns plc | 2031 | 6.382 | 1.248 | 5.134 | 0.03 | 0.22 |
| Prudential Finance Bv | 2031 | 3.574 | 1.248 | 2.326 | 0.19 | 0.22 |
| EIB | 2032 | 1.407 | 1.248 | 0.159 | 0.2 | 0.22 |
| Kreditanstalt fuer Wiederaufbau | 2032 | 1.311 | 1.248 | 0.063 | 0.19 | 0.22 |
| Vodafone Group PLC | 2032 | 2.887 | 1.248 | 1.639 | 0.24 | 0.22 |
| Tesco Plc | 2033 | 4.824 | 1.248 | 3.576 | 0.21 | 0.22 |
| GE | 2033 | 1.88 | 1.248 | 0.632 | 0.21 | 0.22 |
| Proctor & Gamble | 2033 | 1.786 | 1.248 | 0.538 | 0.2 | 0.22 |
| HSBC Bank Plc | 2033 | 3.485 | 1.248 | 2.237 | 0.21 | 0.22 |
| Wessex Water | 2033 | 2.114 | 1.248 | 0.866 | 0.19 | 0.22 |
| Nestle | 2033 | 0.899 | 1.248 | -0.349 | 0.16 | 0.22 |
| Glaxo | 2033 | 1.927 | 1.248 | 0.679 | 0.2 | 0.22 |
| Segro PLC | 2035 | 2.512 | 1.401 | 1.111 | 0.19 | 0.22 |
| Walmart | 2035 | 2.028 | 1.401 | 0.627 | 0.2 | 0.22 |
| Aviva Plc | 2036 | 3.979 | 1.401 | 2.578 | 0.18 | 0.22 |
| General Electric | 2037 | 2.325 | 1.401 | 0.924 | 0.23 | 0.22 |
| Lcr Financial Plc | 2038 | 1.762 | 1.401 | 0.361 | 0.2 | 0.22 |
| EIB | 2039 | 1.64 | 1.401 | 0.239 | 0.2 | 0.22 |
| Lloyds TSB | 2040 | 2.693 | 1.495 | 1.198 | 0.2 | 0.22 |
| GE | 2040 | 2.114 | 1.495 | 0.619 | 0.2 | 0.22 |
| Direct Line | 2042 | 6.738 | 1.495 | 5.243 | 0.06 | 0.22 |
| Barclays Bank Plc | 2049 | 3.706 | 1.4 | 2.306 | 0.1 | 0.22 |
Source: Fixed Income Investor, Investing.com
The spread between international issuers such as Nestle – which, being Swiss, trades at a discount to Gilts – narrowed, however, higher yielding names, such as Direct Line, did likewise.
For comparison the table below – using the issues in bold from the table above – shows the change between the 22nd and 23rd June – pre and post-Brexit:-
| Maturity | Gilts 22-6 | Corporate 22-6 | Gilts 23-6 | Corporate 23-6 | Issuer | Spread 22-6 | Spread 23-6 | Spread change |
| 10y | 1.314 | 4.18 | 1.396 | 4.68 | Barclays | 2.866 | 3.284 | 0.418 |
| 15y | 1.879 | 3.86 | 1.96 | 3.88 | Vodafone | 1.981 | 1.92 | -0.061 |
| 20y | 2.065 | 4.76 | 2.124 | 4.78 | Aviva | 2.695 | 2.656 | -0.039 |
| 25y | 2.137 | 3.42 | 2.195 | 3.43 | Lloyds | 1.283 | 1.235 | -0.048 |
| 30y | 2.149 | 4.21 | 2.229 | 4.23 | Barclays | 2.061 | 2.001 | -0.06 |
Source: Fixed Income Investor, Investing.com
Apart from a sharp increase in the yield on the 10yr Barclays issue (the 30yr did not react in the same manner) the spread between Gilts and corporates narrowed over the Brexit debacle too. This might be because bid/offer spreads in the corporate market became excessively wide – Gilts would have become the only realistic means of hedging – but the closing prices of the corporate names should have reflected mid-market yields.
If the “safe-haven” of Gilts has lost its lustre where should one invest? With patience and in higher yielding bonds – is one answer. Here is another from Ben Lord of M&G’s Bond Vigilantes – The BoE and ECB render the US bond market the only game in town:-
…The ultra-long conventional gilt has returned a staggering 52% this year. Since the result of the referendum became clear, the bond’s price has increased by 20%, and in the couple of weeks since Mark Carney announced the Bank of England’s stimulus package, the bond’s price has risen by a further 13%.
…the 2068 index-linked gilt, which has seen its price rise by 57% year-to-date, by 35% since the vote to exit Europe, and by 18% since further quantitative easing was announced by the central bank. Interestingly, too, the superior price action of the index-linked bond has occurred not as a result of rising inflation or expectations of inflation; instead it has been in spite of significantly falling inflation expectations so far this year. The driver of the outperformance is solely due to the much longer duration of the linker. Its duration is 19 years longer than the nominal 2068 gilt, by virtue of its much lower coupon!
When you buy a corporate bond you don’t just buy exposure to government bond yields, you also buy exposure to credit risk, reflected in the credit spread. The sterling investment grade sector has a duration of almost 10 years, so you are taking exposure to the 10 year gilt, which has a yield today of circa 0.5%. If we divide the yield by the bond’s duration, we get a breakeven yield number, or the yield rise that an investor can tolerate before they would be better off in cash. At the moment, as set out above, the yield rise that an investor in a 10 year gilt (with 9 year’s duration) can tolerate is around 6 basis points (0.5% / 9 years duration). Given that gilt yields are at all-time lows, so is the yield rise an investor can take before they would be better off in cash.
We can perform the same analysis on credit spreads: if the average credit spread for sterling investment grade credit is 200 basis points and the average duration of the market is 10 years, then an investor can tolerate spread widening of 20 basis points before they would be better off in cash. When we combine both of these breakeven figures, we have the yield rise, in basis points, that an investor in the average corporate bond or index can take before they should have been in cash.
With very low gilt yields and credit spreads that are being supported by coming central bank buying, accommodative policy and low defaults, and a benign consumption environment, it is no surprise that corporate bond yield breakevens are at the lowest level we have gathered data for. It is for these same reasons that the typical in-built hedge characteristic of a corporate bond or fund is at such low levels. Traditionally, if the economy is strong then credit spreads tighten whilst government bond yields sell off, such as in 2006 and 2007. And if the economy enters recession, then credit spreads widen and risk free government bond yields rally, such as seen in 2008 and 2009.
With the Bank of England buying gilts and soon to start buying corporate bonds, with the aim of loosening financial conditions and providing a stimulus to the economy as we work through the uncertain Brexit process and outcome, low corporate bond breakevens are to be expected. But with Treasury yields at extreme high levels out of gilts, and with the Fed not buying government bonds or corporate bonds at the moment, my focus is firmly on the attractive relative valuation of the US corporate bond market.
The table below shows a small subset of liquid US corporate bonds, showing the yield change between the 7th and 12th September:-
| Issuer | Issue | Yield | Maturity | Change 7th to 12th | Spread | Rating |
| Home Depot | HD 2.125 9/15/26 c26 | 2.388 | 10y | 0.17 | 0.72 | A2 |
| Toronto Dominion | TD 3.625 9/15/31 c | 3.605 | 15y | 0.04 | 1.93 | A3 |
| Oracle | ORCL 4.000 7/15/46 c46 | 3.927 | 20y | 0.14 | 1.54 | A1 |
| Microsoft | MSFT 3.700 8/8/46 c46 | 3.712 | 20y | 0.13 | 1.32 | Aaa |
| Southern Company | SO 3.950 10/1/46 c46 | 3.973 | 20y | 0.18 | 1.58 | Baa2 |
| Home Depot | HD 3.500 9/15/56 c56 | 3.705 | 20y | 0.19 | 1.31 | A2 |
| US Treasury | US10yr | 1.67 | 10y | 0.13 | N/A | AAA |
| US Treasury | US30y | 2.39 | 30y | 0.16 | N/A | AAA |
Source: Market Axess, Investing.com
Except for Canadian issuer Toronto Dominion, yields moved broadly in tandem with the T-Bond market. The spread between US corporates and T-Bonds may well narrow once the Fed gains a mandate to buy corporate securities, but, should Fed negotiations with Congress prove protracted, the cost of FX hedging may negate much of the benefit for UK or European investors.
What is apparent, is that the “flight to quality” effect is diminished even in the more liquid and higher yielding US market.
The total market capitalisation of the UK corporate bond market is relatively small at £285bln, the US market is around $4.5trln and Europe is between the two at Eur1.5trln. The European Central Bank (ECB) began its Corporate Sector Purchase Programme (CSPP) earlier this summer but delegated the responsibility to the individual National Banks.
Between 8th June and 15th July Europe’s central banks purchased Eur10.43bln across 458 issues. The average position was Eur22.8mln but details of actual holdings are undisclosed. They bought 12 issues of Deutsche Bahn (DBHN) 11 of Telefonica (TEF) and 10 issues of BMW (BMW) but total exposures are unknown. However, as the Bond Vigilantes -Which corporate bonds has the ECB been buying? point out, around 36% of all bonds eligible for the CSPP were trading with negative yields. This was in mid-July, since then 10y Bunds have fallen from -012% to, a stellar, +0.3%, whilst Europe’s central banks have acquired a further Eur6.71bln of corporates in August, taking the mark-to-market total to Eur19.92bln. The chart below shows the breakdown of purchases by country and industry sector at the 18th July:-

Source: M&G Investments, ECB, Bloomberg
Here is the BIS data for total outstanding financial and non-financial debt as at the end of 2015:-
| Country | US$ Blns |
| France | 2053 |
| Spain | 1822 |
| Netherlands | 1635 |
| Germany | 1541 |
| Italy | 1023 |
| Luxembourg | 858 |
| Denmark | 586 |
Source: BIS
In terms of CSPP holdings, Germany appears over-represented, Spain and the Netherlands under-represented. The “devil”, as they say, is in the “detail” – and a detailed breakdown by issuer, issue and size of holding, has not been published. The limited information is certainly insufficient for traders to draw any clear conclusions about which issues to buy or sell. As Wolfgang Bauer, the author of the M&G article, concludes:-
But as tempting as it may be to draw conclusions regarding over- and underweights and thus to anticipate the ECB’s future buying activity, we have to acknowledge that we are simply lacking data. Trying to “front run” the ECB is therefore a highly difficult, if not impossible task.
Conclusions and investment opportunities
Back in May the Wall Street Journal published the table below, showing the change in the portfolio mix required to maintain a 7.5% return between 1995 and 2015:-
Source: Wall Street Journal, Callan Associates
The risk metric they employ is volatility, which in turn is derived from the daily mark-to-market price. Private Equity and Real-Estate come out well on this measure but are demonstrably less liquid. However, this table also misses the point made at the beginning of this letter – that “risk-free” assets are encumbered with much higher “capital” risk in a ZIRP to NIRP world. The lower level of volatility associated with bond markets disguises an asymmetric downside risk in the event of yield “normalisation”.
Dividends
Corporates with strong cash flows and rising earnings are incentivised to issue debt either for investment or to buy back their own stock; thankfully, not all corporates and leveraging their balance sheets. Dividend yields are around the highest they have been this century:-
Source: Multpl.com
Meanwhile US Treasury Bond yields hit their lowest ever in July. Below is a sample of just a few higher yielding S&P500 stocks:-
| Stock | Ticker | Price | P/E | Beta | EPS | DPS | Payout Ratio | Yield |
| At&t | T | 39.97 | 17.3 | 0.56 | 2.3 | 1.92 | 83 | 4.72 |
| Target | TGT | 68.94 | 12.8 | 0.35 | 5.4 | 2.4 | 44 | 3.46 |
| Coca-cola | KO | 42.28 | 24.3 | 0.73 | 1.7 | 1.4 | 80 | 3.24 |
| Mcdonalds | MCD | 114.73 | 22.1 | 0.61 | 5.2 | 3.56 | 69 | 3.07 |
| Procter & Gamble | PG | 87.05 | 23.6 | 0.66 | 3.7 | 2.68 | 73 | 3.03 |
| Kimberly-clark | KMB | 122.39 | 22.8 | 0.61 | 5.4 | 3.68 | 68 | 2.98 |
| Pepsico | PEP | 104.59 | 29.5 | 0.61 | 3.6 | 3.01 | 85 | 2.84 |
| Wal-mart Stores | WMT | 71.46 | 15.4 | 0.4 | 4.6 | 2 | 43 | 2.78 |
| Johnson & Johnson | JNJ | 117.61 | 22.1 | 0.43 | 5.3 | 3.2 | 60 | 2.69 |
Source: TopYield.nl
The average beta of the names above is 0.55 – given that the S&P500 has an historic volatility of around 15%, this portfolio would have a volatility of 8.25% and an average dividend yield of 3.2%. This is not a recommendation to buy an equally weighted portfolio of these stocks, merely an observation about the attractiveness of returns from dividends.
Government bonds offer little or no return if held to maturity – it is a traders market. For as long as central banks keep buying, bond prices will be supported, but, since the velocity of the circulation of money keeps falling, central banks are likely to adopt more unconventional policies in an attempt to transmit stimulus to the real economy. If the BoJ, BoE and ECB are any guide, this will lead them (Fed included) to increase purchases of corporate bonds and even common stock.
Bond bear-market?
Predicting the end of the bond bull-market is not my intention, but if central banks should fail in their unconventional attempts at stimulus, or if their mandates are withdrawn, what has gone up the most (government bonds) is likely to fall farthest. At some point, the value of owning “risk-free” assets will reassert itself, but I do not think a 1% rise in yields will be sufficient. High yielding stocks from companies with good dividend cover, low betas and solid cash flows, will weather the coming storm. These stocks may suffer substantial corrections, but their businesses will remain intact. When the bond bubble finally bursts “risky” assets may be safer than conventional wisdom suggests. The breakdown in the “flight to quality” effect is just one more indicator that the rules of engagement are changing.

Macro Letter – No 55 – 20-05-2016
The levee gonna break – Debt, demographics, productivity and financialization
If it keep on rainin’ the levee gonna break
If it keep on rainin’ the levee gonna break
Some people still sleepin’, some people are wide awake
Bob Dylan
In a March paper from the Kansas City Federal Reserve Bank – The Lasting Damage from the Financial Crisis to U.S. Productivity – the authors observe that total factor productivity in the US has not returned to its pre-financial crisis trajectory. They ascribe this to the tightness of credit conditions:-
Our empirical analysis shows the crisis indeed altered this relationship. During normal times, total factor productivity growth fluctuates over the business cycle along with changes in the intensity with which available labor and capital are used; credit conditions are unimportant.
During the crisis, however, distressed credit markets and tighter lending conditions were significant drags on total factor productivity growth. Because productivity’s sensitivity to credit conditions once again diminished after the crisis, the post-crisis easing of credit conditions did not boost productivity growth. As a result, the financial crisis left productivity, and therefore output, on a lower trajectory. Adverse credit conditions appear to have dampened total factor productivity growth by curtailing productivity-boosting innovation during the crisis rather than by hampering the efficient allocation of the economy’s productive resources through reduced creation and destruction of firms and jobs.
The conclusion is a telling indictment on the ability of the mainstream economics profession to unravel the conundrum total factor productivity:-
Our analysis does not explain the slow pace of productivity growth since the crisis, which has been a source of great concern among economists and policymakers. From 2010 to 2014, TFP growth averaged just 0.6 percent per year, well below its average growth rate of 1 percent from 1970 to 2010.
An attempt to counter this deficiency was undertaken by Mauldin Economics – Delta Force and summed up by this simple equation:-
The Greek letter delta (Δ) is the symbol for change. So the change in GDP is written as:-
ΔGDP = ΔPopulation + ΔProductivity
In other words, GDP growth can be achieved by an increase in the working age population or an increase in productivity. They go on to state that the problem of reduced investment is being exacerbated by low interest rates:-
Rather than encouraging businesses to compete by investing in productive assets and trying to take market share, excessive central bank stimulus encourages businesses to buy their competition and consolidate – which typically results in a reduction in the labor force. When the Federal Reserve makes it cheaper to buy your competition than to compete and cheaper to buy back your shares than to invest in new productivity, is it any wonder that productivity drops?
Mauldin go on to discuss demographics and labour force participation, they conclude:-
This demographic cast iron lid on growth helps explain why the Federal Reserve, ECB, and other central banks seem so powerless. Can they create more workers? Not really.
…What Fed policy is clearly not doing is to encourage businesses to invest in growth. Business loan availability is still a problem in many sectors
…Buyouts help shareholders but not workers, as they typically entail a consolidation of company workforces and a reduction in the number of “duplicated” workers. While this culling may be good for the individual businesses, it is not so good for the overall economy. It circumvents Joseph Schumpeter’s law of creative destruction.
…unless something happens to boost worker productivity dramatically, we’re facing lower world GDP growth for a very long time. Could we act to change that? Yes, but as I look at the political scene today, I wonder where the impetus for change is going to come from, absent a serious crisis.
…Given what we did in the last crisis, it is not clear that we still have that capacity.
For investors, this is reality: developed-world economies are going to grow slower. And companies, whose revenue is essentially a function of the growth of the overall economy, are going to grow slower, too…
The absolute level of debt is another factor which is impeding economic potential. Whilst credit creation in the private sector has been choked by continuous regulatory tightening of leverage rules for financial institutions, the capital requirements for investing in “risk-free” assets – ie. Bankrolling the state – has remained unchanged. Meanwhile the reduction of official interest rates to below the level of inflation has enabled governments around the world to dramatically expand deficit financing.
In September 2014 – Buttiglione, Lane, Reichlin and Reinhart produced the 16th Geneva Report on the World Economy – Deleveraging, What Deleveraging? Here is the chart of the growth of world debt to GDP – it caused something of a sensation:-
Source: voxeu.com, CEPR
Contrary to widely held beliefs, the world has not yet begun to delever and the global debt-to-GDP is still growing, breaking new highs. At the same time, in a poisonous combination, world growth and inflation are also lower than previously expected, also – though not only – as a legacy of the past crisis. Deleveraging and slower nominal growth are in many cases interacting in a vicious loop, with the latter making the deleveraging process harder and the former exacerbating the economic slowdown. Moreover, the global capacity to take on debt has been reduced through the combination of slower expansion in real output and lower inflation.
McKinsey Global Institute – Debt and (not much) deleveraging February 2015 picked up the gauntlet:-
Global debt has grown by $57 trillion and no major economy has decreased its debt-to-GDP ratio since 2007. High government debt in advanced economies, mounting household debt, and the rapid rise of China’s debt are areas of potential concern.
They go on to highlight three areas of risk:- rise of government debt – which increased by $25trln between 2007 and 2015 – the continued rise in household debt (especially mortgages in Australia, Canada, Denmark, Sweden, the Netherlands, Malaysia, South Korea, and Thailand ) and the quadrupling of China’s debt to $28trln or 282% of GDP.
China has been attempting its own brand of regulatory tightening of late alongside the great rebalancing towards consumption, but even official measures of GDP suggest that the economy has stalled and stimulus has resumed during the last few months.
Global real-estate continues to benefit from the low interest rate environment, although planning restrictions in many prime locations is the principle driver of price appreciation, notwithstanding Chinese anti-corruption measures which have tempered demand recently.
The rise in government debt continues to crowd out the opportunities for private sector investment, whilst central bank quantitative easing (QE) programmes act as a natural buyer of these securities.
The BIS Working Papers No 559 A comparative analysis of developments in central bank balance sheet composition – provides an insight into the changing structure of the balance sheets of a variety of central banks. For a snapshot of the quantum, Yardeni Research – Global Economic Briefing: Central Bank Balance Sheets published on Monday, is more instructive. At end April Fed, ECB, BoJ and PBoC had a combined record total of $16.7trln, up from around $9trln at the beginning of 2010. The ECB and the BoJ have been the main drivers of growth this year, whilst the Fed and the PBoC balance sheets have marked time.
To summarise: the factors stifling economic growth are demographics, public sector crowding out of private investment, regulatory tightening of credit conditions and artificially low interest rates, however, I believe there is another factor to consider – the Financialization and the World Economy. As far as I can discern, the first academic work on this subject was published by Prof. Gerald Epstein in October 2005. Here is an extract from the introduction:-
Using the case of the US economy, Crotty argues that financialization has had a profound and largely negative impact on the operations of US nonfinancial corporations. This is partly reflected in the increasing incomes extracted by financial markets from these corporations.
…the payments US NFCs paid out to financial markets more than doubled as a share of their cash flow between the 1960s and the 1970s, on one hand, and the 1980s and 1990s on the other. As NFCs came under increasing pressure to make payments, they also came under increasing pressure to increase the value of their stock prices.
…Financial markets’ demands for more income and more rapidly growing stock prices occurred at the same time as stagnant economic growth and increased product market competition made it increasingly difficult to earn profits.
The authors conclude that the solution is redistributive taxation, I would counter that a better solution would be to reduce the tax and regulatory privileges associated with government debt, thus freeing the private sector from the yoke of unfair public sector competition. But this is a polemic for another time and place. What is clear is that the availability of credit and leverage amplifies business cycles in both directions.
Conclusions
Increasing debt and leverage for an economy with a diminishing working age population is not sustainable. Without the demographic windfall of immigration or procreation, increasing productivity is the only way to sustain real economic growth. The short term financial wizardry of the share buy-back is a function of the artificially low price of credit. The longer central bank sponsored largesse continues, the lower the trend rate of GDP growth will become. A combination of fiscal reform and gradual normalisation of monetary policy could redress the situation but I believe it is politically unachievable. Markets climb a wall of fear, even at these exalted levels, it still makes sense to be long bonds, stocks and real-estate but, once the limit of government intervention has been reached, the “levee gonna break”.

Macro Letter – No 53 – 22-04-2016
US growth – has the windfall of cheap oil arrived or is there a spectre at the feast?
In this letter I want to revisit a topic I last discussed back in June 2015 – Can the boon of cheap energy eclipse the collapse of energy investment? In this article I wrote:-
The impact of the oil price collapse is still feeding through the US economy but, since the most vulnerable states have learnt the lessons of the 1980’s and diversified away from an excessive reliance of on the energy sector, the short-run downturn will be muted whilst the long-run benefits of new technology will be transformative. US oil production at $10/barrel would have sounded ludicrous less than five years ago: today it seems almost plausible.
This week the San Francisco Fed picked up the theme in their FRBSF Economic Letter – The Elusive Boost from Cheap Oil:-
The plunge in oil prices since the middle of 2014 has not translated into a dramatic boost for consumer spending, which has continued to grow moderately. This has been particularly surprising since the sharp drop should free up income for households to use toward other purchases. Lessons from an empirical model of learning suggest that the weak response may reflect that consumers initially viewed cheaper oil as a temporary condition. If oil prices remain low, consumer perceptions could change, which would boost spending.
Given the perceived wisdom of the majority of central banks – that deflation is evil and must be punished – the lack of consumer spending is a perfect example of the validity of the Fed’s inflation targeting policy; except that, as this article suggests, deflations effect on spending is transitory. I could go on to discuss the danger of inflation targeting, arguing that the policy is at odds with millennia of data showing that technology is deflationary, enabling the consumer to pay less and get more. But I’ll save this for another day.
The FRBSF paper looks at the WTI spot and futures price. They suggest that market participants gradually revise their price assumptions in response to new information, concluding:-
The steep decline in oil prices since June 2014 did not translate into a strong boost to consumer spending. While other factors like weak foreign growth and strong dollar appreciation have contributed to this weaker-than-expected response, part of the muted boost from cheaper oil appears to stem from the fact that consumers expected this decline to be temporary. Because of this, households saved rather than spent the gains from lower prices at the pump. However, continued low oil prices could change consumer perceptions, leading them to increase spending as they learn about this greater degree of persistence.
In a related article the Kansas City Fed – Macro Bulletin – The Drag of Energy and Manufacturing on Productivity Growth observes that the changing industry mix away from energy and manufacturing, towards the production of services, has subtracted 0.75% from productivity growth. They attribute this to the strength of the US$ and a decline in manufacturing and mining.
…even if the industry mix stabilizes, the relative rise in services and relative declines in manufacturing and mining are likely to have a persistent negative effect on productivity growth going forward.
The service and finance sector of the economy has a lower economic multiplier than the manufacturing sector, a trend which has been accelerating since 1980. A by-product of the growth in the financial sector has been a massive increase in debt relative to GDP. By some estimates it now requires $3.30 of debt to create $1 of GDP growth. A reduction of $35trln would be needed to get debt to GDP back to 150% – a level considered to be structurally sustainable.
Meanwhile, US corporate profits remain a concern as this chart from PFS group indicates:-
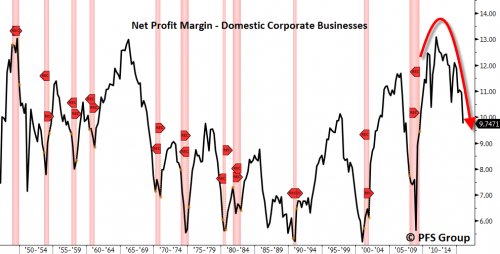
Source: PFS Group, Bloomberg
The chart below from Peter Tenebrarum – Acting Man looks at whole economy profits – it is perhaps more alarming still:-
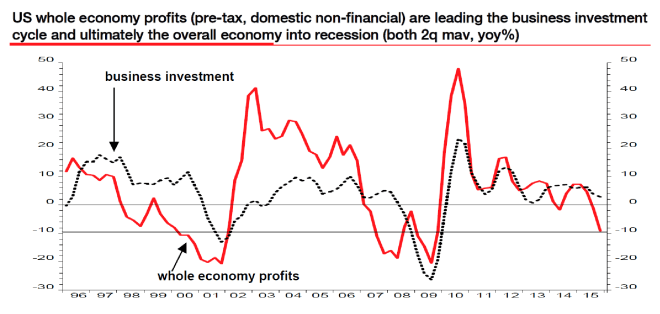
Source: Acting Man
With energy input costs falling, the beneficiaries should be non-energy corporates or consumers. Yet wholesale inventories are rising, total business sales seem to have lost momentum and, whilst TMS-2 Money Supply growth remains solid at 8%, it is principally due to commercial and industrial lending.
US oil production has fallen below 9mln bpd versus a peak of 9.6mln. Rig count last week was 351 down three from the previous week but down 383 from the same time last year. Meanwhile the failure of Saudi Arabia to curtail production, limits the potential for the oil market to rally.
From a global perspective, cheap fuel appears to be cushioning the US from economic headwinds in other parts of the world. Employment outside mining and manufacturing is steady, and wages are finally starting to rise. However, the overhang of debt and muted level of house price appreciation has dampened the animal spirits of the US consumer:-
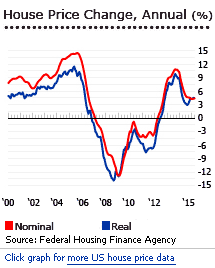
Source: Global Property Guide, Federal Housing Finance Agency
According to the Dallas Fed – Increased Credit Availability, Rising Asset Prices Help Boost Consumer Spending – the consumer is beginning to emerge:-
A combination of much less household debt, revived access to consumer credit and recovering asset prices have bolstered U.S. consumer spending. This trend will likely continue despite an estimated 50 percent reduction since the mid-2000s of the housing wealth effect— an important amplifier during the boom years.
…Since the Great Recession, the ratio of household debt-to-income has fallen back to about 107 percent, a more sustainable—albeit relatively high—level.
…The wealth-to-income ratio rose from about 530 percent in fourth quarter 2003 to 650 percent in mid-2007 as equity and house prices surged. Not surprisingly, consumer spending also jumped.
The conventional estimate of the wealth effect—the impact of higher household wealth on aggregate consumption—is 3 percent, or $3 in additional spending every year for each $100 increase in wealth.
…Recent research suggests that the spendability, or wealth effect, of liquid financial assets—almost $9 for every $100—is far greater than the effect for illiquid financial assets, which explains why falling equity prices do not generate larger cutbacks in aggregate consumer spending. Other things equal, higher mortgage and consumer debt significantly depress consumer spending.
…The estimated housing wealth effect varies over time and captures the ability of consumers to tap into their housing wealth. It rose steadily from about 1.3 percent in the early 1990s to a peak of about 3.5 percent in the mid- 2000s. It has since halved, to about the same level as that of the mid-1990s. During the subprime and housing booms, rising house prices and housing wealth effects propagated and amplified expansion of consumption and GDP.
During the bust, this mechanism went into reverse. High levels of mortgage debt, falling house prices and a reduced ability to tap housing equity generated greater savings and reduced consumer spending. Fortunately, house prices have recovered, deleveraging has slowed or stopped, and consumer spending is strong, even though the housing wealth effect is only half as large as it was in the mid-2000s.
Countering the positive spin placed on the consumer credit data by the Dallas Fed is a recent interview with Odysseas Papadimitriou, CEO of CardHub by Financial Sense – Credit Card Debt Levels Reaching Unsustainable Levels:-
In 2015, we accumulated almost $71 billion in new credit card debt. And for the first time since the Great Recession, we broke the $900 billion level in total credit card debt so we are back on track in getting to $1 trillion.
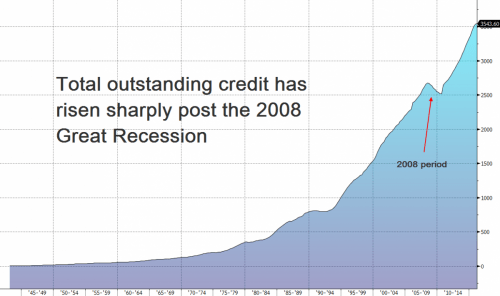
Source: Bloomberg, Financial Sense
Another factor which has been holding back the US economy has been the change in the nature of employment. Full-time jobs have been replaced by lower paying part-time roles and the participation rate has been in decline. This may also be changing, but is likely to be limited, as the Kansas City Fed – Flowing into Employment: Implications for the Participation Rate reports:-
After a long stretch of declines, the labor force participation rate has risen in recent months, driven in part by an increase in the share of prime-age people flowing into employment from outside the labor force. So far, this flow has remained largely confined to those with higher educational attainment, suggesting further increases in labor force participation rate could be relatively limited.
…Overall, the scenarios show that while more prime-age people could enter the labor force in the coming years, the cyclical improvement in the overall participation rate may be limited to the extent only those with higher educational attainment flow into employment. In addition, the potential increase in the participation rate could be constrained by other factors such as an increase in the share of prime-age population that reports they are either retired or disabled and a limited pool of people saying they want a job, even if they have not looked recently. Thus, while higher NE flow indicates the prime-age participation rate could increase further, it will likely remain lower than its pre-recession rate.
Conclusion
At the 2015 EIA conference Adrian Cooper of Oxford Economics gave a presentation – The Macroeconomic Impact of Lower Oil Prices – in which he estimated that a $30pb decline in the oil price would add 0.9% to US GDP between 2015 and 2017. If this estimate is correct, lower oil is responsible for more than a quarter of the current US GDP growth. It has softened the decline from 2.9% to 2% seen over the last year.
I would argue that the windfall of lower oil prices has already arrived, it has shown up in the deterioration of the trade balance, the increase in wages versus consumer prices and the nascent rebound in the participation rate. That the impact has not been more dramatic is due to the headwinds on excessive debt and the strength of the US$ TWI – it rose from 103 in September 2014 to a high of 125 in January 2016. After the G20 meeting Shanghai it has retreated to 120.
According to the March 2015 BIS – Oil and debt report, total debt in the Oil and Gas sector increased from $1trln in 2006 to $2.5trln by 2015. The chart below looks at the sectoral breakdown of US Capex up to the end of 2013:-
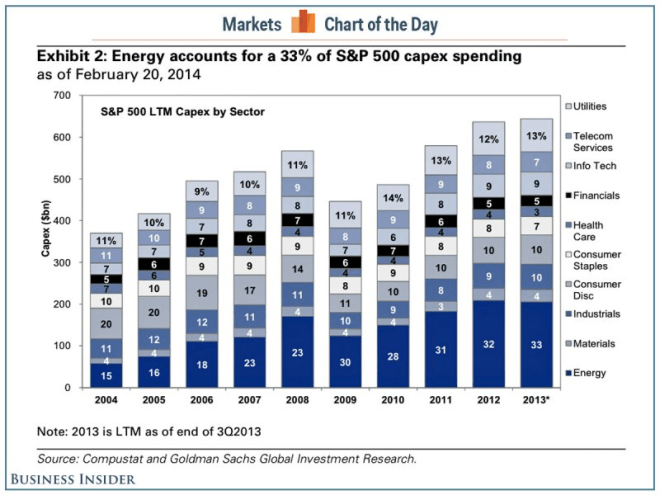
Source: Business Insider, Compustat, Goldman Sachs
With 37% allocated to Energy and Materials by 2013 it is likely that the fall in oil prices will act as a drag on a large part of the stock market. Energy and Materials may represent less than 10% of the total but they impact substantially in the financial sector (15.75%).
Notwithstanding the fact that corporate defaults are at the highest level for seven years, financial institutions and their central bank masters will prefer to reschedule. This will act as a drag on new lending and on the profitability of the banking sector.
The table below from McGraw Hill shows the year to date performance of the S&P Spider and the sectoral ETFs. This year Financials are taking the strain whilst Energy has been the top performer – over one year, however, Energy is still the nemesis of the index.
| Sector SPDR Fund | % Change YTD | % Change 1 year |
| S&P 500 Index | 2.86% | 0.10% |
| Consumer Discretionary (XLY) | 2.23% | 5.05% |
| Consumer Staples (XLP) | 4.16% | 6.83% |
| Energy (XLE) | 10.20% | -19.16% |
| Financial Services (XLFS) | -2.49% | 0.00% |
| Financials (XLF) | -1.22% | -2.85% |
| Health Care (XLV) | -1.01% | -3.31% |
| Industrials (XLI) | 6.41% | -0.07% |
| Materials (XLB) | 8.45% | -5.78% |
| Real Estate (XLRE) | 1.98% | 0.00% |
| Technology (XLK) | 3.60% | 5.19% |
| Utilities (XLU) | 10.74% | 7.08% |
Source: McGraw Hill
The benefit of lower oil and gas prices will continue, but, until debt levels are reduced, anaemic GDP growth is likely to remain the pattern for the foreseeable future. In Hoisington Investment Management – Economic Review – Q1 2016 – Lacy Hunt makes the following observation:-
The Federal Reserve, the European Central Bank, the Bank of Japan and the People’s Bank of China have been unable to gain traction with their monetary policies…. Excluding off balance sheet liabilities, at year-end the ratio of total public and private debt relative to GDP stood at 350%, 370%, 457% and 615%, for China, the United States, the Eurocurrency zone, and Japan, respectively…
The windfall of cheap oil has arrived, but cheap oil has been eclipsed by the beguiling spectre of cheap debt.
