US Bonds – 2030 Vision – A decade in the doldrums

US Bonds – 2030 Vision – A decade in the doldrums

In the Long Run - small colour logo

Macro Letter – No 125 – 17-01-2020

US Bonds – 2030 Vision – A decade in the doldrums

  • US bond yields have been in secular decline since 1981
  • Predictions of a bond bear-market have been premature for three decades
  • High indebtedness will see any inflationary yield surges quickly subdued

Having reached their yield low at 1.32% in July 2016, US 10yr bond yields have been locked in, just shy of, a 2% range for the last two and half years (subsequent high 3.25% and low 1.43%). For yields to fall again, supply must fall, demand rise or central banks, recommence their experimental monetary policies of negative interest rates and quantitative easing. For yields to rise, supply must rise, demand fall or central banks, reverse their multi-year largesse. Besides supply, demand and monetary policy there are, however, other factors to consider.

Demographics

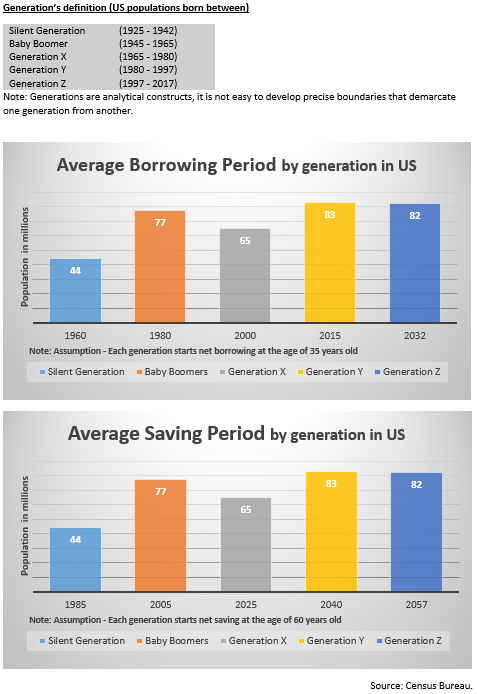
One justification for a rise in US bond yields would be an uptick in inflationary pressure. Aging demographic have been the principal driver of the downward trajectory of secular inflation. During the next decade, however, Generation Y borrowing will accelerate whilst Generation X has yet to begin their aggressive saving spree. The table below looks at the borrowing and saving patterns of the demographic cohorts in the US: –

Demographics

Source: US Census Bureau

Excepting the obesity and opioid epidemics, life expectancy will, nonetheless, continue to extend. The Gen Y borrowing binge will not override the aging demographic effect. It’s influence on the inflation of the next decade is likely to be modest (on these grounds alone we will not see the return of double-digit inflation) and the longer term aging trend, bolstered by improvements in healthcare, will return with a vengeance during the 2030’s, undermining the last vestiges of current welfare provisions. Much more saving will be required to pay for the increasing cost of healthcare and pensions. With bond yields of less than 4%, an aging (and hopefully healthier) population will need to continue working well beyond current retirement age in order to cover the shortfall in income.

Technology

Another secular factor which has traditionally kept a lid on inflation has been technology. As Robert Solo famously observed back in 1987, ‘You can see the computer age everywhere but in the productivity statistics.’ Part of the issue is that productivity is measured in currency terms. If the price of a computer remains unchanged for a decade but its capacity to compute increases 10-fold over the same period, absent new buyers of computers, new sales are replacements. In this scenario, the improvement in productivity does not lead to an uptick in economic growth, but it does demonstrably improve our standard of living.

Looking ahead the impact of machine learning and artificial intelligence is just beginning to be felt. Meanwhile, advances in robotics, always a target of the Luddite fringe, have been significant during the last decade, spurred on by the truncation of global supply chains in the wake of the great financial crisis. This may be to the detriment of frontier economies but the developed world will reap the benefit of cheaper goods.

Central Bank Omnipotence

When Paul Volcker assumed the helm of the Federal Reserve in the late 1970’s, inflation was eroding any gains from investment in government bonds. Armed with Friedman’s monetary theories, the man who really did remove the punch-bowl, raised short-term rates to above the level of CPI and gradually forced the inflation genie back into its bottle.

After monetary aggregate targets were abandoned, inflation targeting was widely adopted by many central banks, but, as China joined the WTO (2001) and exported their comparative advantage in labour costs to the rest of the world, those same central bankers’, with Chairman Bernanke in the vanguard, became increasingly petrified by the prospect of price deflation. Memories of the great depression and the monetary constraints of the gold exchange standard were still fresh in their minds. For an economy to expand, it was argued, the supply of money must expand in order to maintain the smooth functioning of markets: a lack of cash would stifle economic growth. Inflation targets of around 2% were deemed appropriate, even as technological and productivity related improvements insured that the prices of many consumer goods actually declined in price.

Inflation and deflation can be benign or malign. Who does not favour a stock market rally? Yet, who cares to witness their grocery bill spiral into the stratosphere? Who cheers when the latest mobile device is discounted again? But does not panic when the value of their property (on which the loan-to-value is already a consumption-sapping 90%) falls, wiping out all their equity? Blunt inflation targeting is frankly obtuse, but it remains the mandate of, perhaps, the most powerful unelected institutions on the planet.

When economic historians look back on the period since the collapse of the Bretton Woods agreement, they will almost certainly conclude that the greatest policy mistake, made by central banks, was to disregard asset price inflation in their attempts to stabilise prices. Meanwhile, in the decade ahead, upside breaches of inflation targets will be largely ignored, especially if growth remains anaemic. Central bankers’, it seems, are determined to get behind the curve, they fear the severity of a recession triggered by their own actions. In the new era of open communications and forward guidance they are reticent to increase interest rates, too quickly or by too great a degree, in such a heavily indebted environment. I wrote more about this in November 2018 in The Self-righting Ship – Debt, Inflation and the Credit Cycle: –

The current level of debt, especially in the developed economies, seems to be acting rather like the self-righting ship. As economic growth accelerates and labour markets tighten, central banks gradually tighten monetary conditions in expectation of inflation. As short-term rates increase, bond yields follow, but, unlike the pattern seen in the higher interest rate era of the 1970’s and 1980’s, the effect of higher bond yields quickly leads to a tempering of credit demand.

Some commentators will rightly observe that this phenomenon has always existed, but, at the risk of saying ‘this time it’s different,’ the level at which higher bond yields act as a break on credit expansion are much lower today in most developed markets.

Conclusions and Investment Opportunities

There have been several drivers of disinflation over the past decade including a tightening of bank regulation, increases in capital requirements and relative fiscal austerity. With short-term interest rates near to zero in many countries, governments will find themselves compelled to relax regulatory impediments to credit creation and open the fiscal spigot, at any sign of a recession, after all, central bank QE appears to have reached the limits of its effectiveness. The table below shows the diminishing returns of QE over time: –

QE effect

Source: M&G, Deutsche Bank, World Bank

Of course the central banks are not out of ammunition just yet, the Bank of Japan experiment with qualitative easing (they currently purchase ETFs, common stock may be next on their agenda) has yet to be adopted elsewhere and the Federal Reserve has so far resisted the temptation to follow the ECB into corporate bond acquisition.

For the US bond market the next decade may well see yields range within a relatively narrow band. There is the possibility of new record lows, but the upside is likely to be constrained by the overall indebtedness of both the private and public sector.

Capital Flows – is a reckoning nigh?

Capital Flows – is a reckoning nigh?

In the Long Run - small colour logo

Macro Letter – No 111 – 15-03-2019

Capital Flows – is a reckoning nigh?

  • Borrowing in Euros continues to rise even as the rate of US borrowing slows
  • The BIS has identified an Expansionary Lower Bound for interest rates
  • Developed economies might not be immune to the ELB
  • Demographic deflation will thwart growth for decades to come

In Macro Letter – No 108 – 18-01-2019 – A world of debt – where are the risks? I looked at the increase in debt globally, however, there has been another trend, since 2009, which is worth investigating as we consider from whence the greatest risk to global growth may hail. The BIS global liquidity indicators at end-September 2018 – released at the end of January, provides an insight: –

The annual growth rate of US dollar credit to non-bank borrowers outside the United States slowed down to 3%, compared with its most recent peak of 7% at end-2017. The outstanding stock stood at $11.5 trillion.

In contrast, euro-denominated credit to non-bank borrowers outside the euro area rose by 9% year on year, taking the outstanding stock to €3.2 trillion (equivalent to $3.7 trillion). Euro-denominated credit to non-bank borrowers located in emerging market and developing economies (EMDEs) grew even more strongly, up by 13%.

The chart below shows the slowing rate of US$ credit growth, while euro credit accelerates: –

gli1901_graph1

Source: BIS global liquidity indicators

The rising demand for Euro denominated borrowing has been in train since the end of the Great Financial Recession in 2009. Lower interest rates in the Eurozone have been a part of this process; a tendency for the Japanese Yen to rise in times of economic and geopolitical concern has no doubt helped European lenders to gain market share. This trend, however, remains over-shadowed by the sheer size of the US credit markets. The US$ has remained preeminent due to structurally higher interest rates and bond yields than Europe or Japan: investors, rather than borrowers, dictate capital flows.

The EC – Analysis of developments in EU capital flows in the global context from November 2018 concurs: –

The euro area (excluding intra-euro area flows) has been since 2013 the world’s leading net exporter of capital. Capital from the euro area has been invested heavily abroad in debt securities, especially in the US, taking advantage of the interest differential between the two jurisdictions. At the same time, foreign holdings of euro-area bonds fell as a result of the European Central Bank’s Asset Purchase Programme.

This bring us to another issue; a country’s ability to service its debt is linked to its GDP growth rate. Since 2009 the US economy has expanded by 34%, over the same period, Europe has shrunk by 2%. Putting these rates of expansion into a global perspective, the last decade has seen China’s economy grow by 139%, whilst India has gained 96%. Recent analysis suggests that Chinese growth may have been overstated by 2% per annum over the past decade, but the pace is still far in excess of developed economy rates. Concern about Chinese debt is not unwarranted, but with GDP rising by 6% per annum, its economy will be 80% larger in a decade, whilst India’s, growing at 7%, will have doubled.

Another excellent research paper from the BIS – The expansionary lower bound: contractionary monetary easing and the trilemma – investigates the problem of monetary tightening of developed economies on emerging markets. Here is part of the introduction, the emphasis is mine: –

…policy makers in EMs are often reluctant to lower interest rates during an economic downturn because they fear that, by spurring capital outflows, monetary easing may end up weakening, rather than boosting, aggregate demand.

An empirical analysis of the determinants of policy rates in EMs provides suggestive evidence about the tensions faced by monetary authorities, even in countries with flexible exchange rates.

…The results reveal that, even after controlling for expected inflation and the output gap, monetary authorities in EMs tend to hike policy rates when the VIX or US policy rates increase. This is arguably driven by the desire to limit capital outflows and the depreciation of the exchange rate.

…our theory predicts the existence of an “Expansionary Lower Bound” (ELB) which is an interest rate threshold below which monetary easing becomes contractionary. The ELB constrains the ability of monetary policy to stimulate aggregate demand, placing an upper bound on the level of output achievable through monetary stimulus.

The ELB can occur at positive interest rates and is therefore a potentially tighter constraint for monetary policy than the Zero Lower Bound (ZLB). Furthermore, global monetary and financial conditions affect the ELB and thus the ability of central banks to support the economy through monetary accommodation. A tightening in global monetary and financial conditions leads to an increase in the ELB which in turn can force domestic monetary authorities to increase policy rates in line with the empirical evidence presented…

The BIS research is focussed on emerging economies, but aspects of the ELB are evident elsewhere. The limits of monetary policy are clearly observable in Japan: the Eurozone may be entering a similar twilight zone.

The difference between emerging and developed economies response to a tightening in global monetary conditions is seen in capital flows and exchange rates. Whilst emerging market currencies tend to fall, prompting their central banks to tighten monetary conditions in defence, in developed economies the flow of returning capital from emerging market investments may actually lead to a strengthening of the exchange rate. The persistent strength of the Japanese Yen, despite moribund economic growth over the past two decades, is an example of this phenomenon.

Part of the driving force behind developed market currency strength in response to a tightening of global monetary conditions is demographic, a younger working age population borrows more, an ageing populous borrows less.

At the risk of oversimplification, lower bond yields in developing (and even developed) economies accelerate the process of capital repatriation. Japanese pensioners can hardly rely on JGBs to deliver their retirement income when yields are at the zero bound, they must accept higher risk to achieve a living income, but this makes them more likely to drawdown on investments made elsewhere when uncertainty rises. A 2% rise in US interest rates only helps the eponymous Mrs Watanabe if the Yen appreciates by less than 2% in times of stress. Japan’s pensioners face a dilemma, a fall in US rates, in response to weaker global growth, also creates an income shortfall; capital is still repatriated, simply with less vehemence than during an emerging market crisis. As I said, this is an oversimplification of a vastly more complex system, but the importance of capital flows, in a more polarised ‘risk-on, risk-off’ world, is not to be underestimated.

Returning to the BIS working paper, the authors conclude: –

The models highlight a novel inter-temporal trade-off for monetary policy since the level of the ELB is affected by the past monetary stance. Tighter ex-ante monetary conditions tend to lower the ELB and thus create more monetary space to offset possible shocks. This observation has important normative implications since it calls for keeping a somewhat tighter monetary stance when global conditions are supportive to lower the ELB in the future.

Finally, the models have rich implications for the use of alternative policy tools that can be deployed to overcome the ELB and restore monetary transmission. In particular, the presence of the ELB calls for an active use of the central bank’s balance sheet, for example through quantitative easing and foreign exchange intervention. Furthermore, the ELB provides a new rationale for capital controls and macro-prudential policies, as they can be successfully used to relax the tensions between domestic collateral constraints and capital flows. Fiscal policy can also help to overcome the ELB, while forward guidance is ineffective since the ELB increases with the expectation of looser future monetary conditions.

Conclusions and investment opportunities

The concept of the ELB is new, the focus of the BIS working paper is on its impact on emerging markets. I believe the same forces are evident in developed economies too, but the capital flows are reversed. For investors, the greatest risk of emerging market investment is posed by currency, however, each devaluation by an emerging economy inexorably weakens the position of developed economies, since the devaluation makes that country’s exports immediately more competitive.

At present the demographic forces favour repatriation during times of crisis and repatriation, at a slower rate, during times of EM currency appreciation. This is because the ageing economies of the developed world continue to drawdown on their investments. At some point this demographic effect will reverse, however, for Japan and the Eurozone this will not be before 2100. For more on the demographic deficit the 2018 Ageing Report: Europe’s population is getting older – is worth reviewing. Until demographic trends reverse, international demand to borrow in US$, Euros and Yen will remain popular. Emerging market countries will pay the occasional price for borrowing cheaply, in the form of currency depreciations.

For Europe and Japan a reckoning may be nigh, but it seems more likely that their economic importance will gradually diminish as emerging economies, with a younger working age population and higher structural growth rates, eclipse them.

The levee gonna break – Debt, demographics, productivity and financialization

400dpiLogo

Macro Letter – No 55 – 20-05-2016

The levee gonna break – Debt, demographics, productivity and financialization

  • Debt and leverage since the financial crisis has continued to rise
  • Demographics trends in developed countries are not supportive of economic growth
  • Productivity growth has been rising much slower since the Great Recession
  • Financialization of the global economy has amplified the business cycle

If it keep on rainin’ the levee gonna break
Some people still sleepin’, some people are wide awake

 Bob Dylan

 In a March paper from the Kansas City Federal Reserve Bank – The Lasting Damage from the Financial Crisis to U.S. Productivity – the authors observe that total factor productivity in the US has not returned to its pre-financial crisis trajectory. They ascribe this to the tightness of credit conditions:-

Our empirical analysis shows the crisis indeed altered this relationship. During normal times, total factor productivity growth fluctuates over the business cycle along with changes in the intensity with which available labor and capital are used; credit conditions are unimportant.

During the crisis, however, distressed credit markets and tighter lending conditions were significant drags on total factor productivity growth. Because productivity’s sensitivity to credit conditions once again diminished after the crisis, the post-crisis easing of credit conditions did not boost productivity growth. As a result, the financial crisis left productivity, and therefore output, on a lower trajectory. Adverse credit conditions appear to have dampened total factor productivity growth by curtailing productivity-boosting innovation during the crisis rather than by hampering the efficient allocation of the economy’s productive resources through reduced creation and destruction of firms and jobs.

The conclusion is a telling indictment on the ability of the mainstream economics profession to unravel the conundrum total factor productivity:-

Our analysis does not explain the slow pace of productivity growth since the crisis, which has been a source of great concern among economists and policymakers. From 2010 to 2014, TFP growth averaged just 0.6 percent per year, well below its average growth rate of 1 percent from 1970 to 2010.

An attempt to counter this deficiency was undertaken by Mauldin Economics – Delta Force and summed up by this simple equation:-

The Greek letter delta (Δ) is the symbol for change. So the change in GDP is written as:-

ΔGDP = ΔPopulation + ΔProductivity

In other words, GDP growth can be achieved by an increase in the working age population or an increase in productivity. They go on to state that the problem of reduced investment is being exacerbated by low interest rates:-

Rather than encouraging businesses to compete by investing in productive assets and trying to take market share, excessive central bank stimulus encourages businesses to buy their competition and consolidate – which typically results in a reduction in the labor force. When the Federal Reserve makes it cheaper to buy your competition than to compete and cheaper to buy back your shares than to invest in new productivity, is it any wonder that productivity drops?

Mauldin go on to discuss demographics and labour force participation, they conclude:-

This demographic cast iron lid on growth helps explain why the Federal Reserve, ECB, and other central banks seem so powerless. Can they create more workers? Not really.

…What Fed policy is clearly not doing is to encourage businesses to invest in growth. Business loan availability is still a problem in many sectors

…Buyouts help shareholders but not workers, as they typically entail a consolidation of company workforces and a reduction in the number of “duplicated” workers. While this culling may be good for the individual businesses, it is not so good for the overall economy. It circumvents Joseph Schumpeter’s law of creative destruction.

…unless something happens to boost worker productivity dramatically, we’re facing lower world GDP growth for a very long time. Could we act to change that? Yes, but as I look at the political scene today, I wonder where the impetus for change is going to come from, absent a serious crisis.

…Given what we did in the last crisis, it is not clear that we still have that capacity.

For investors, this is reality: developed-world economies are going to grow slower. And companies, whose revenue is essentially a function of the growth of the overall economy, are going to grow slower, too…

The absolute level of debt is another factor which is impeding economic potential. Whilst credit creation in the private sector has been choked by continuous regulatory tightening of leverage rules for financial institutions, the capital requirements for investing in “risk-free” assets – ie. Bankrolling the state – has remained unchanged. Meanwhile the reduction of official interest rates to below the level of inflation has enabled governments around the world to dramatically expand deficit financing.

In September 2014 – Buttiglione, Lane, Reichlin and Reinhart produced the 16th Geneva Report on the World Economy – Deleveraging, What Deleveraging? Here is the chart of the growth of world debt to GDP – it caused something of a sensation:-

World Debt growth

Source: voxeu.com, CEPR

Contrary to widely held beliefs, the world has not yet begun to delever and the global debt-to-GDP is still growing, breaking new highs. At the same time, in a poisonous combination, world growth and inflation are also lower than previously expected, also – though not only – as a legacy of the past crisis. Deleveraging and slower nominal growth are in many cases interacting in a vicious loop, with the latter making the deleveraging process harder and the former exacerbating the economic slowdown. Moreover, the global capacity to take on debt has been reduced through the combination of slower expansion in real output and lower inflation.

McKinsey Global Institute – Debt and (not much) deleveraging February 2015 picked up the gauntlet:-

Global debt has grown by $57 trillion and no major economy has decreased its debt-to-GDP ratio since 2007. High government debt in advanced economies, mounting household debt, and the rapid rise of China’s debt are areas of potential concern.

They go on to highlight three areas of risk:- rise of government debt – which increased by $25trln between 2007 and 2015 – the continued rise in household debt (especially mortgages in Australia, Canada, Denmark, Sweden, the Netherlands, Malaysia, South Korea, and Thailand ) and the quadrupling of China’s debt to $28trln or 282% of GDP.

China has been attempting its own brand of regulatory tightening of late alongside the great rebalancing towards consumption, but even official measures of GDP suggest that the economy has stalled and stimulus has resumed during the last few months.

Global real-estate continues to benefit from the low interest rate environment, although planning restrictions in many prime locations is the principle driver of price appreciation, notwithstanding Chinese anti-corruption measures which have tempered demand recently.

The rise in government debt continues to crowd out the opportunities for private sector investment, whilst central bank quantitative easing (QE) programmes act as a natural buyer of these securities.

The BIS Working Papers No 559 A comparative analysis of developments in central bank balance sheet composition – provides an insight into the changing structure of the balance sheets of a variety of central banks. For a snapshot of the quantum, Yardeni Research – Global Economic Briefing: Central Bank Balance Sheets published on Monday, is more instructive. At end April Fed, ECB, BoJ and PBoC had a combined record total of $16.7trln, up from around $9trln at the beginning of 2010. The ECB and the BoJ have been the main drivers of growth this year, whilst the Fed and the PBoC balance sheets have marked time.

To summarise: the factors stifling economic growth are demographics, public sector crowding out of private investment, regulatory tightening of credit conditions and artificially low interest rates, however, I believe there is another factor to consider – the Financialization and the World Economy. As far as I can discern, the first academic work on this subject was published by Prof. Gerald Epstein in October 2005. Here is an extract from the introduction:-

Using the case of the US economy, Crotty argues that financialization has had a profound and largely negative impact on the operations of US nonfinancial corporations. This is partly reflected in the increasing incomes extracted by financial markets from these corporations.

…the payments US NFCs paid out to financial markets more than doubled as a share of their cash flow between the 1960s and the 1970s, on one hand, and the 1980s and 1990s on the other. As NFCs came under increasing pressure to make payments, they also came under increasing pressure to increase the value of their stock prices.

…Financial markets’ demands for more income and more rapidly growing stock prices occurred at the same time as stagnant economic growth and increased product market competition made it increasingly difficult to earn profits.

The authors conclude that the solution is redistributive taxation, I would counter that a better solution would be to reduce the tax and regulatory privileges associated with government debt, thus freeing the private sector from the yoke of unfair public sector competition. But this is a polemic for another time and place. What is clear is that the availability of credit and leverage amplifies business cycles in both directions.

Conclusions

Increasing debt and leverage for an economy with a diminishing working age population is not sustainable. Without the demographic windfall of immigration or procreation, increasing productivity is the only way to sustain real economic growth. The short term financial wizardry of the share buy-back is a function of the artificially low price of credit. The longer central bank sponsored largesse continues, the lower the trend rate of GDP growth will become. A combination of fiscal reform and gradual normalisation of monetary policy could redress the situation but I believe it is politically unachievable. Markets climb a wall of fear, even at these exalted levels, it still makes sense to be long bonds, stocks and real-estate but, once the limit of government intervention has been reached, thelevee gonna break”.