![]()
Macro Letter – No 125 – 17-01-2020
US Bonds – 2030 Vision – A decade in the doldrums
- US bond yields have been in secular decline since 1981
- Predictions of a bond bear-market have been premature for three decades
- High indebtedness will see any inflationary yield surges quickly subdued
Having reached their yield low at 1.32% in July 2016, US 10yr bond yields have been locked in, just shy of, a 2% range for the last two and half years (subsequent high 3.25% and low 1.43%). For yields to fall again, supply must fall, demand rise or central banks, recommence their experimental monetary policies of negative interest rates and quantitative easing. For yields to rise, supply must rise, demand fall or central banks, reverse their multi-year largesse. Besides supply, demand and monetary policy there are, however, other factors to consider.
Demographics
One justification for a rise in US bond yields would be an uptick in inflationary pressure. Aging demographic have been the principal driver of the downward trajectory of secular inflation. During the next decade, however, Generation Y borrowing will accelerate whilst Generation X has yet to begin their aggressive saving spree. The table below looks at the borrowing and saving patterns of the demographic cohorts in the US: –
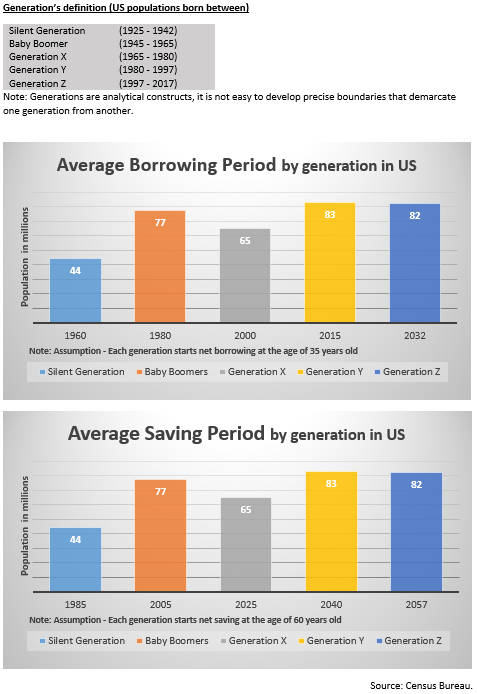
Source: US Census Bureau
Excepting the obesity and opioid epidemics, life expectancy will, nonetheless, continue to extend. The Gen Y borrowing binge will not override the aging demographic effect. It’s influence on the inflation of the next decade is likely to be modest (on these grounds alone we will not see the return of double-digit inflation) and the longer term aging trend, bolstered by improvements in healthcare, will return with a vengeance during the 2030’s, undermining the last vestiges of current welfare provisions. Much more saving will be required to pay for the increasing cost of healthcare and pensions. With bond yields of less than 4%, an aging (and hopefully healthier) population will need to continue working well beyond current retirement age in order to cover the shortfall in income.
Technology
Another secular factor which has traditionally kept a lid on inflation has been technology. As Robert Solo famously observed back in 1987, ‘You can see the computer age everywhere but in the productivity statistics.’ Part of the issue is that productivity is measured in currency terms. If the price of a computer remains unchanged for a decade but its capacity to compute increases 10-fold over the same period, absent new buyers of computers, new sales are replacements. In this scenario, the improvement in productivity does not lead to an uptick in economic growth, but it does demonstrably improve our standard of living.
Looking ahead the impact of machine learning and artificial intelligence is just beginning to be felt. Meanwhile, advances in robotics, always a target of the Luddite fringe, have been significant during the last decade, spurred on by the truncation of global supply chains in the wake of the great financial crisis. This may be to the detriment of frontier economies but the developed world will reap the benefit of cheaper goods.
Central Bank Omnipotence
When Paul Volcker assumed the helm of the Federal Reserve in the late 1970’s, inflation was eroding any gains from investment in government bonds. Armed with Friedman’s monetary theories, the man who really did remove the punch-bowl, raised short-term rates to above the level of CPI and gradually forced the inflation genie back into its bottle.
After monetary aggregate targets were abandoned, inflation targeting was widely adopted by many central banks, but, as China joined the WTO (2001) and exported their comparative advantage in labour costs to the rest of the world, those same central bankers’, with Chairman Bernanke in the vanguard, became increasingly petrified by the prospect of price deflation. Memories of the great depression and the monetary constraints of the gold exchange standard were still fresh in their minds. For an economy to expand, it was argued, the supply of money must expand in order to maintain the smooth functioning of markets: a lack of cash would stifle economic growth. Inflation targets of around 2% were deemed appropriate, even as technological and productivity related improvements insured that the prices of many consumer goods actually declined in price.
Inflation and deflation can be benign or malign. Who does not favour a stock market rally? Yet, who cares to witness their grocery bill spiral into the stratosphere? Who cheers when the latest mobile device is discounted again? But does not panic when the value of their property (on which the loan-to-value is already a consumption-sapping 90%) falls, wiping out all their equity? Blunt inflation targeting is frankly obtuse, but it remains the mandate of, perhaps, the most powerful unelected institutions on the planet.
When economic historians look back on the period since the collapse of the Bretton Woods agreement, they will almost certainly conclude that the greatest policy mistake, made by central banks, was to disregard asset price inflation in their attempts to stabilise prices. Meanwhile, in the decade ahead, upside breaches of inflation targets will be largely ignored, especially if growth remains anaemic. Central bankers’, it seems, are determined to get behind the curve, they fear the severity of a recession triggered by their own actions. In the new era of open communications and forward guidance they are reticent to increase interest rates, too quickly or by too great a degree, in such a heavily indebted environment. I wrote more about this in November 2018 in The Self-righting Ship – Debt, Inflation and the Credit Cycle: –
The current level of debt, especially in the developed economies, seems to be acting rather like the self-righting ship. As economic growth accelerates and labour markets tighten, central banks gradually tighten monetary conditions in expectation of inflation. As short-term rates increase, bond yields follow, but, unlike the pattern seen in the higher interest rate era of the 1970’s and 1980’s, the effect of higher bond yields quickly leads to a tempering of credit demand.
Some commentators will rightly observe that this phenomenon has always existed, but, at the risk of saying ‘this time it’s different,’ the level at which higher bond yields act as a break on credit expansion are much lower today in most developed markets.
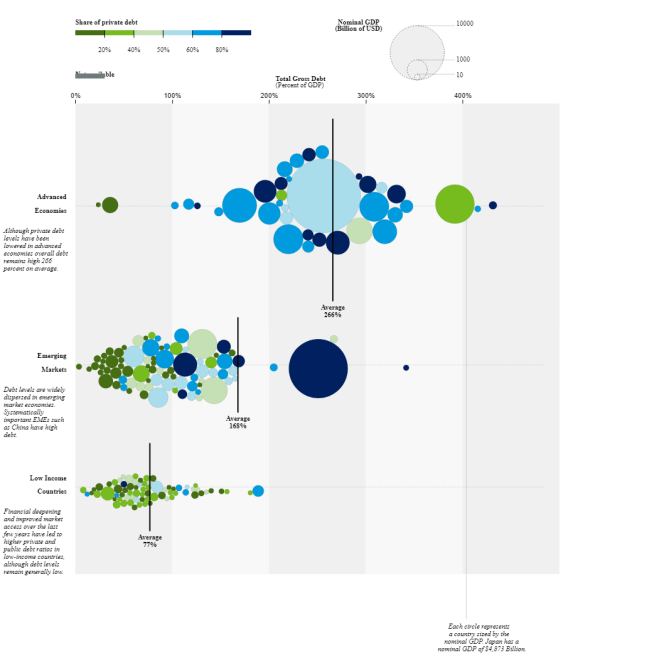
Conclusions and Investment Opportunities
There have been several drivers of disinflation over the past decade including a tightening of bank regulation, increases in capital requirements and relative fiscal austerity. With short-term interest rates near to zero in many countries, governments will find themselves compelled to relax regulatory impediments to credit creation and open the fiscal spigot, at any sign of a recession, after all, central bank QE appears to have reached the limits of its effectiveness. The table below shows the diminishing returns of QE over time: –
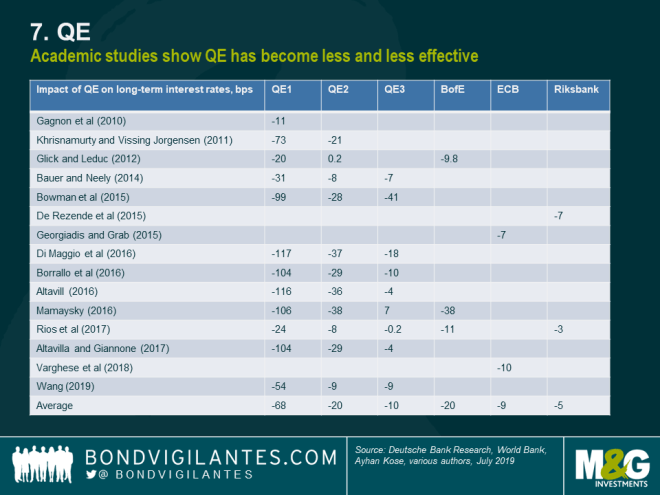
Source: M&G, Deutsche Bank, World Bank
Of course the central banks are not out of ammunition just yet, the Bank of Japan experiment with qualitative easing (they currently purchase ETFs, common stock may be next on their agenda) has yet to be adopted elsewhere and the Federal Reserve has so far resisted the temptation to follow the ECB into corporate bond acquisition.
For the US bond market the next decade may well see yields range within a relatively narrow band. There is the possibility of new record lows, but the upside is likely to be constrained by the overall indebtedness of both the private and public sector.