Macro Letter – No 137
A Review of Stock Market Valuations – Part 2
- As global stock markets continue to rise, commentators talk of a bubble
- Shorter-term indicators suggest the markets have run ahead of fundamentals
- Expectations about the speed of economic recovery from the pandemic remain key
- Even a slight moderation of fiscal and monetary expansion could precipitate a crash
Men, it has been well said, think in herds; it will be seen that they go mad in herds, while they only recover their senses slowly, and one by one.
Charles Mackay – Extraordinary Popular Delusions and the Madness of Crowds (1841)
Money is a public good; as such, it lends itself to private exploitation.
Charles Kindleberger – Manias, Panics, and Crashes: A History of Financial Crises (1978)
Contributing to euphoria are two further factors little noted in our time or in past times. The first is the extreme brevity of the financial memory. In consequence, financial disaster is quickly forgotten. In further consequence, when the same or closely similar circumstances occur again, they are hailed by a new, often youthful, and always supremely self-confident generation as a brilliantly innovative discovery. There can be few fields of human endeavor in which history counts for so little as in the world of finance. Past experience, to the extent that it is part of memory at all is dismissed as the primitive refuge of those who do not have the insight to appreciate the incredible wonders of the present.
JK Galbraith – A short history of financial euphoria (1990)
This is the second of a two part letter reviewing the current valuation of stocks. The focus is US-centric and looks at both long-run valuation (Part 1) and shorter term factors which may be warning signs of irrational exuberance (Part 2).
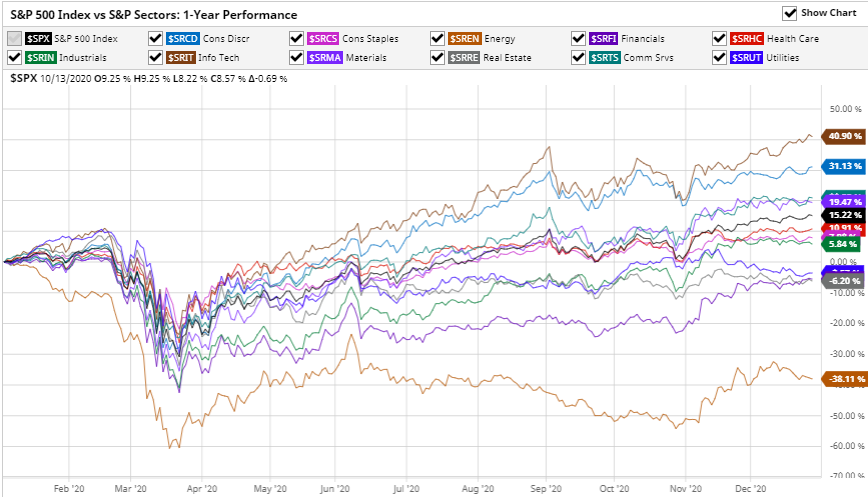
During the last year we have seen stock markets around the world, decline rapidly and then rebound. Technically the longest bull-market in history ended in March of 2020, but the recovery was so swift that many commentators are calling it merely a sharp correction, simply an aberration. Since March the US stock market, fuelled by aggressive monetary and fiscal easing, has shot to new all-time highs. 2020 ended with the approval of the first Covid-19 vaccines, sending markets higher still.
Equity markets are forward-looking, the economic woes of today are discounted, expectations of recovery, backed by further fiscal support, make the prospects for future earnings appear relatively rosy. In this, the second part of my letter, I want to examine some shorter-term indicators which may or may not be cause for concern that current valuations are a triumph of hope of reality.
I once gave a speech entitled The Trouble with Alpha the gist of which contained my observation that Alpha – that portion of an investment managers returns which are not the result of the performance of the underlying assets was, was simply timing. To arrive at this conclusion I looked at 24 definitions of Alpha, finding that – once I had accounted for factors such as leverage, the ability to be long or short and (of particular importance) the choice of the index which was supposed to represent Beta – all that remained was timing.Suffice to say the speech was not received with acclaim by the audience – who were primarily investment managers. I mention this because, for the majority of investors, the investment time-horizon is finite. It is all very well for me to write about the Long Run and for Warren Buffet to describe his favourite investment horizon being forever, but for most investors, volatility, liquidity and mortality are key.
The economic historian Charles Kindleberger published Manias, Panics and Crashes: A History of Financial Crises in 1978, in which he observed patterns of fear and greed stretching back centuries, however, personally, I think Jesse Livermore sums-up the behaviour of financial markets best in the opening pages of Reminiscences of a Stock Operator, published in 1923: –
There is nothing new in Wall Street. There can’t be because speculation is as old as the hills. Whatever happens in the stock market today has happened before and will happen again.
In trading especially, but in investment too, timing is (almost) everything.
Show me the signs
There are times when making money from the stock market is hard, and times when it is easy, the latter periods are few and far between, but one of the tell-tale signs that a market has become excessively speculative is when retail investors pile in.
Stock market folk-lore tells of how Joseph Kennedy (although others attribute it to James Pierpont Morgan) decided to sell his stock portfolio ahead of the market crash of 1929. Kennedy figured that when he found himself in receipt of stock tips from his shoeshine boy, the market bubble was very well advanced. The table below shows the uptick in retail stock broker accounts between Q1 2019 and Q1 2020: –

Source: Factset, CNBC
Robinhood is not on the list above, but more on that topic later.
In a recent post – A Visit from the Doom Squad – 10th Man, Jared Dillian quotes research from South Korea on the behaviour of retail stock traders in the aftermath of a bursting stock bubble: –
The researchers observed the behavior of a few thousand of them. After six months, 90% of them had given up. After a year, the 1% who were left barely had enough money to cover their daily expenses.
Dillian believes the biggest risk is of the Federal Reserve becoming more hawkish as the pandemic is brought to heel by the process of mass-vaccination. He concludes: –
That is a real risk. In fact, it is really the only risk, because people correctly point out that the economy will recover strongly in the second half, once most of the vaccines have been distributed.
Aside from the proliferation of retail stock-trading accounts, there are several indicators of excessive speculative activity in the US stock market. Firstly, record OTC/Pink Sheet trading volume – these are stocks not listed on the main exchanges: –
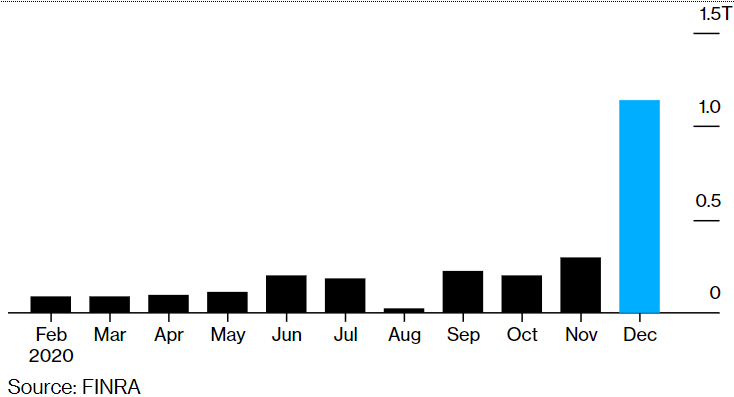
Source: Finra, Bloomberg
Another bubble warning sign is the record high levels of equity margin trading. The chart below shows the evolution of margin balances and the direction of the S&P 500 index up to December 2020: –
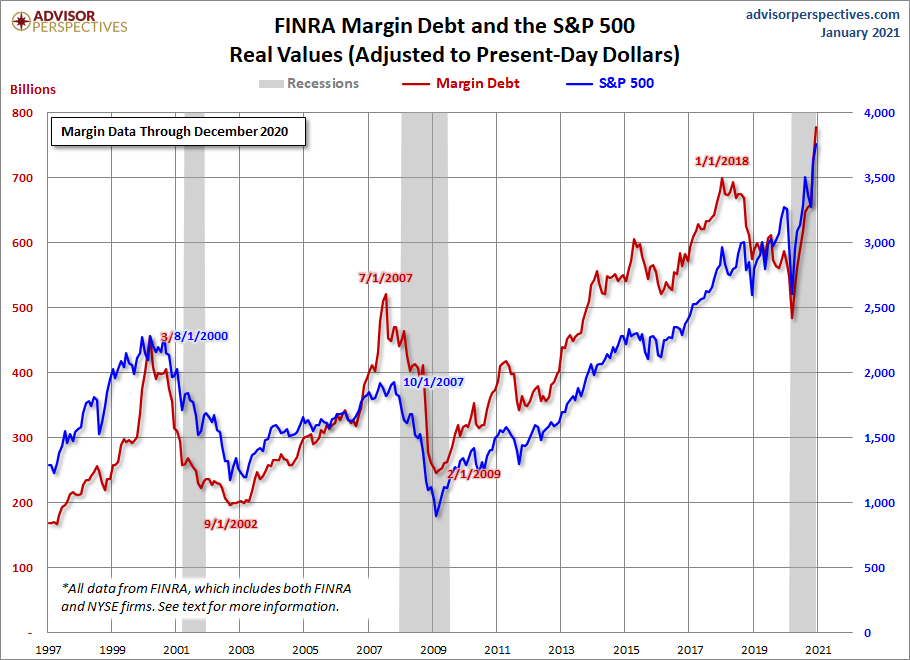
Source: Advisor Perspectives
A further worrying sign of excess is the rise of the SPAC – Special Purpose Acquisition Company. This is a blank cheque shell corporation designed to take a company public without going through the traditional IPO process. SPACs allow retail investors to gain access to private equity type opportunities, particularly leveraged buyouts. A slightly tongue-in-cheek description of the difference between a SPAC and a traditional IPO is that, an IPO is a company in search of capital, whilst a SPAC is capital in search of an investment.
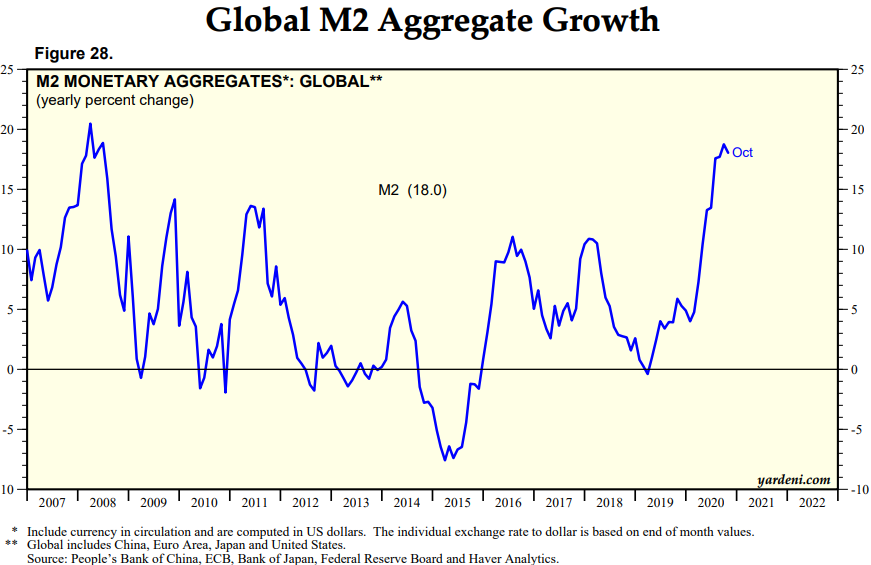
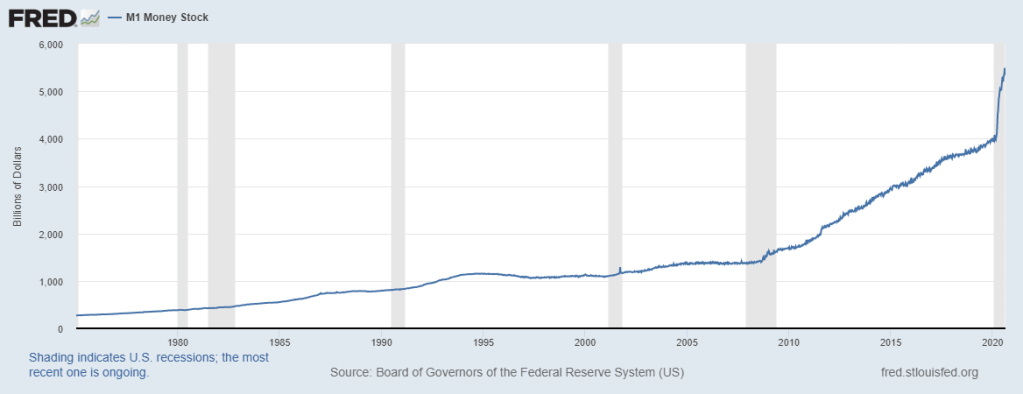
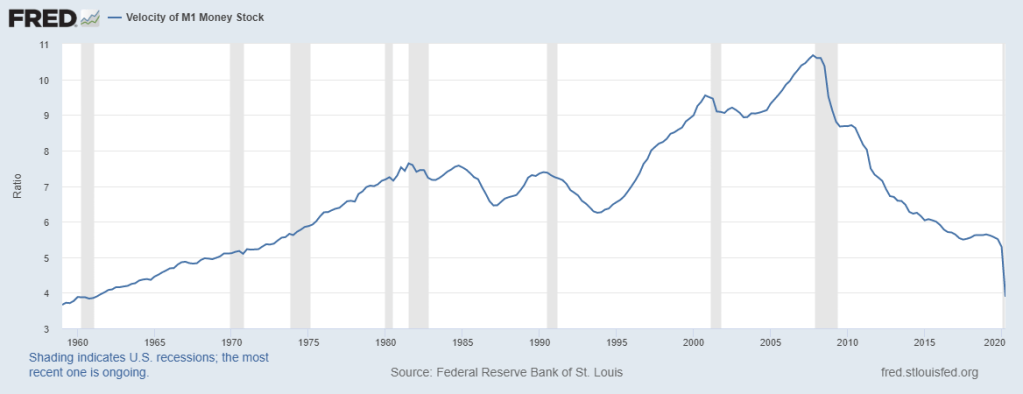
This chart of the ballooning of US money supply growth may help to explain the allure of the SPAC, along with many other signs of speculation: –
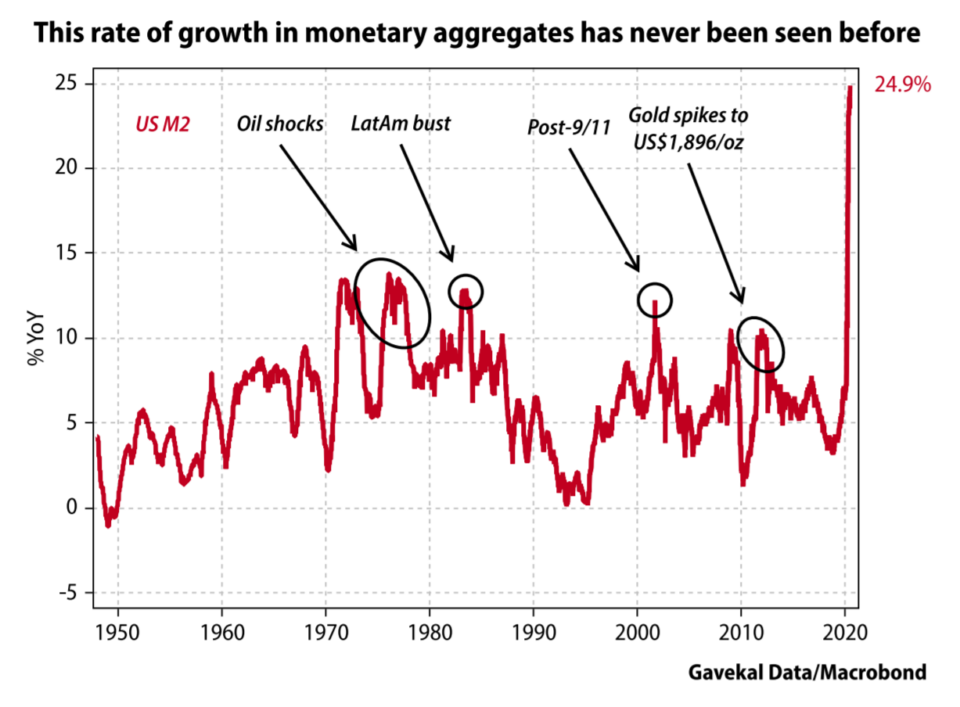
Source: Gavekal/Macrobond
In 2020, SPACs accounted for most of the growth in the US IPO market, raising $80bln from 237 listings. This surpassed the previous record of $13.6 billion raised from 59 IPOs in 2019. The trend has entered a new phase with $38bln raised from 128 listings in the first six weeks of 2021.
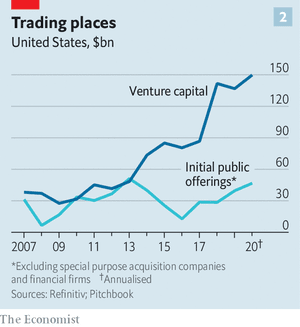
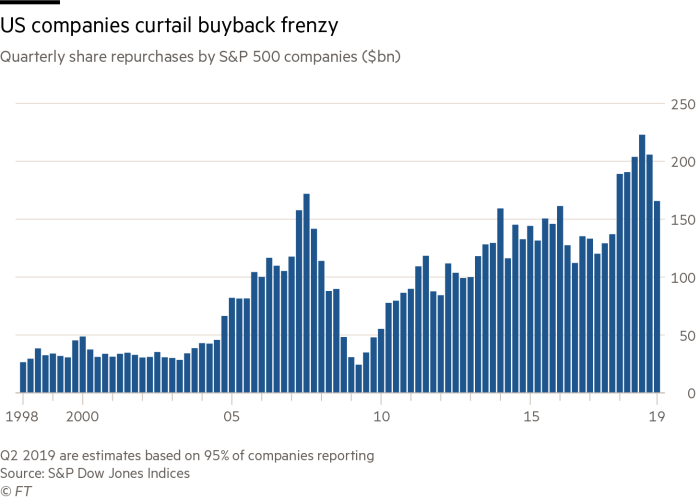
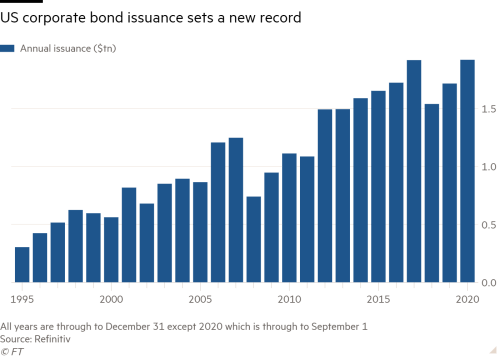
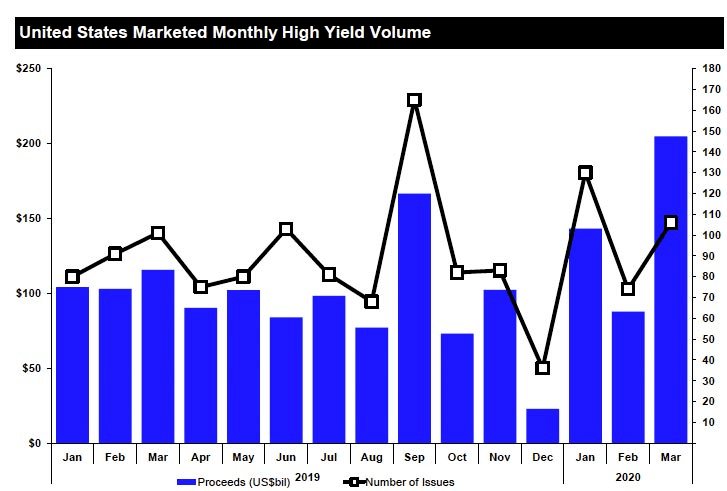
Another outcome of the rapid expansion in money supply can be observed in corporate capital raising. Last December The Economist – A year of raising furiously – noted that corporations globally raised more capital in 2020 than ever before: –
According to Refinitiv, a data provider, this year the world’s non-financial firms have raised an eye-popping $3.6trn in capital from public investors Issuance of both investment-grade and riskier junk bonds set records, of $2.4trn and $426bn, respectively. So did the $538bn in secondary stock sales by listed stalwarts, which leapt by 70% from last year, reversing a recent trend to buy back shares rather than issue new ones.
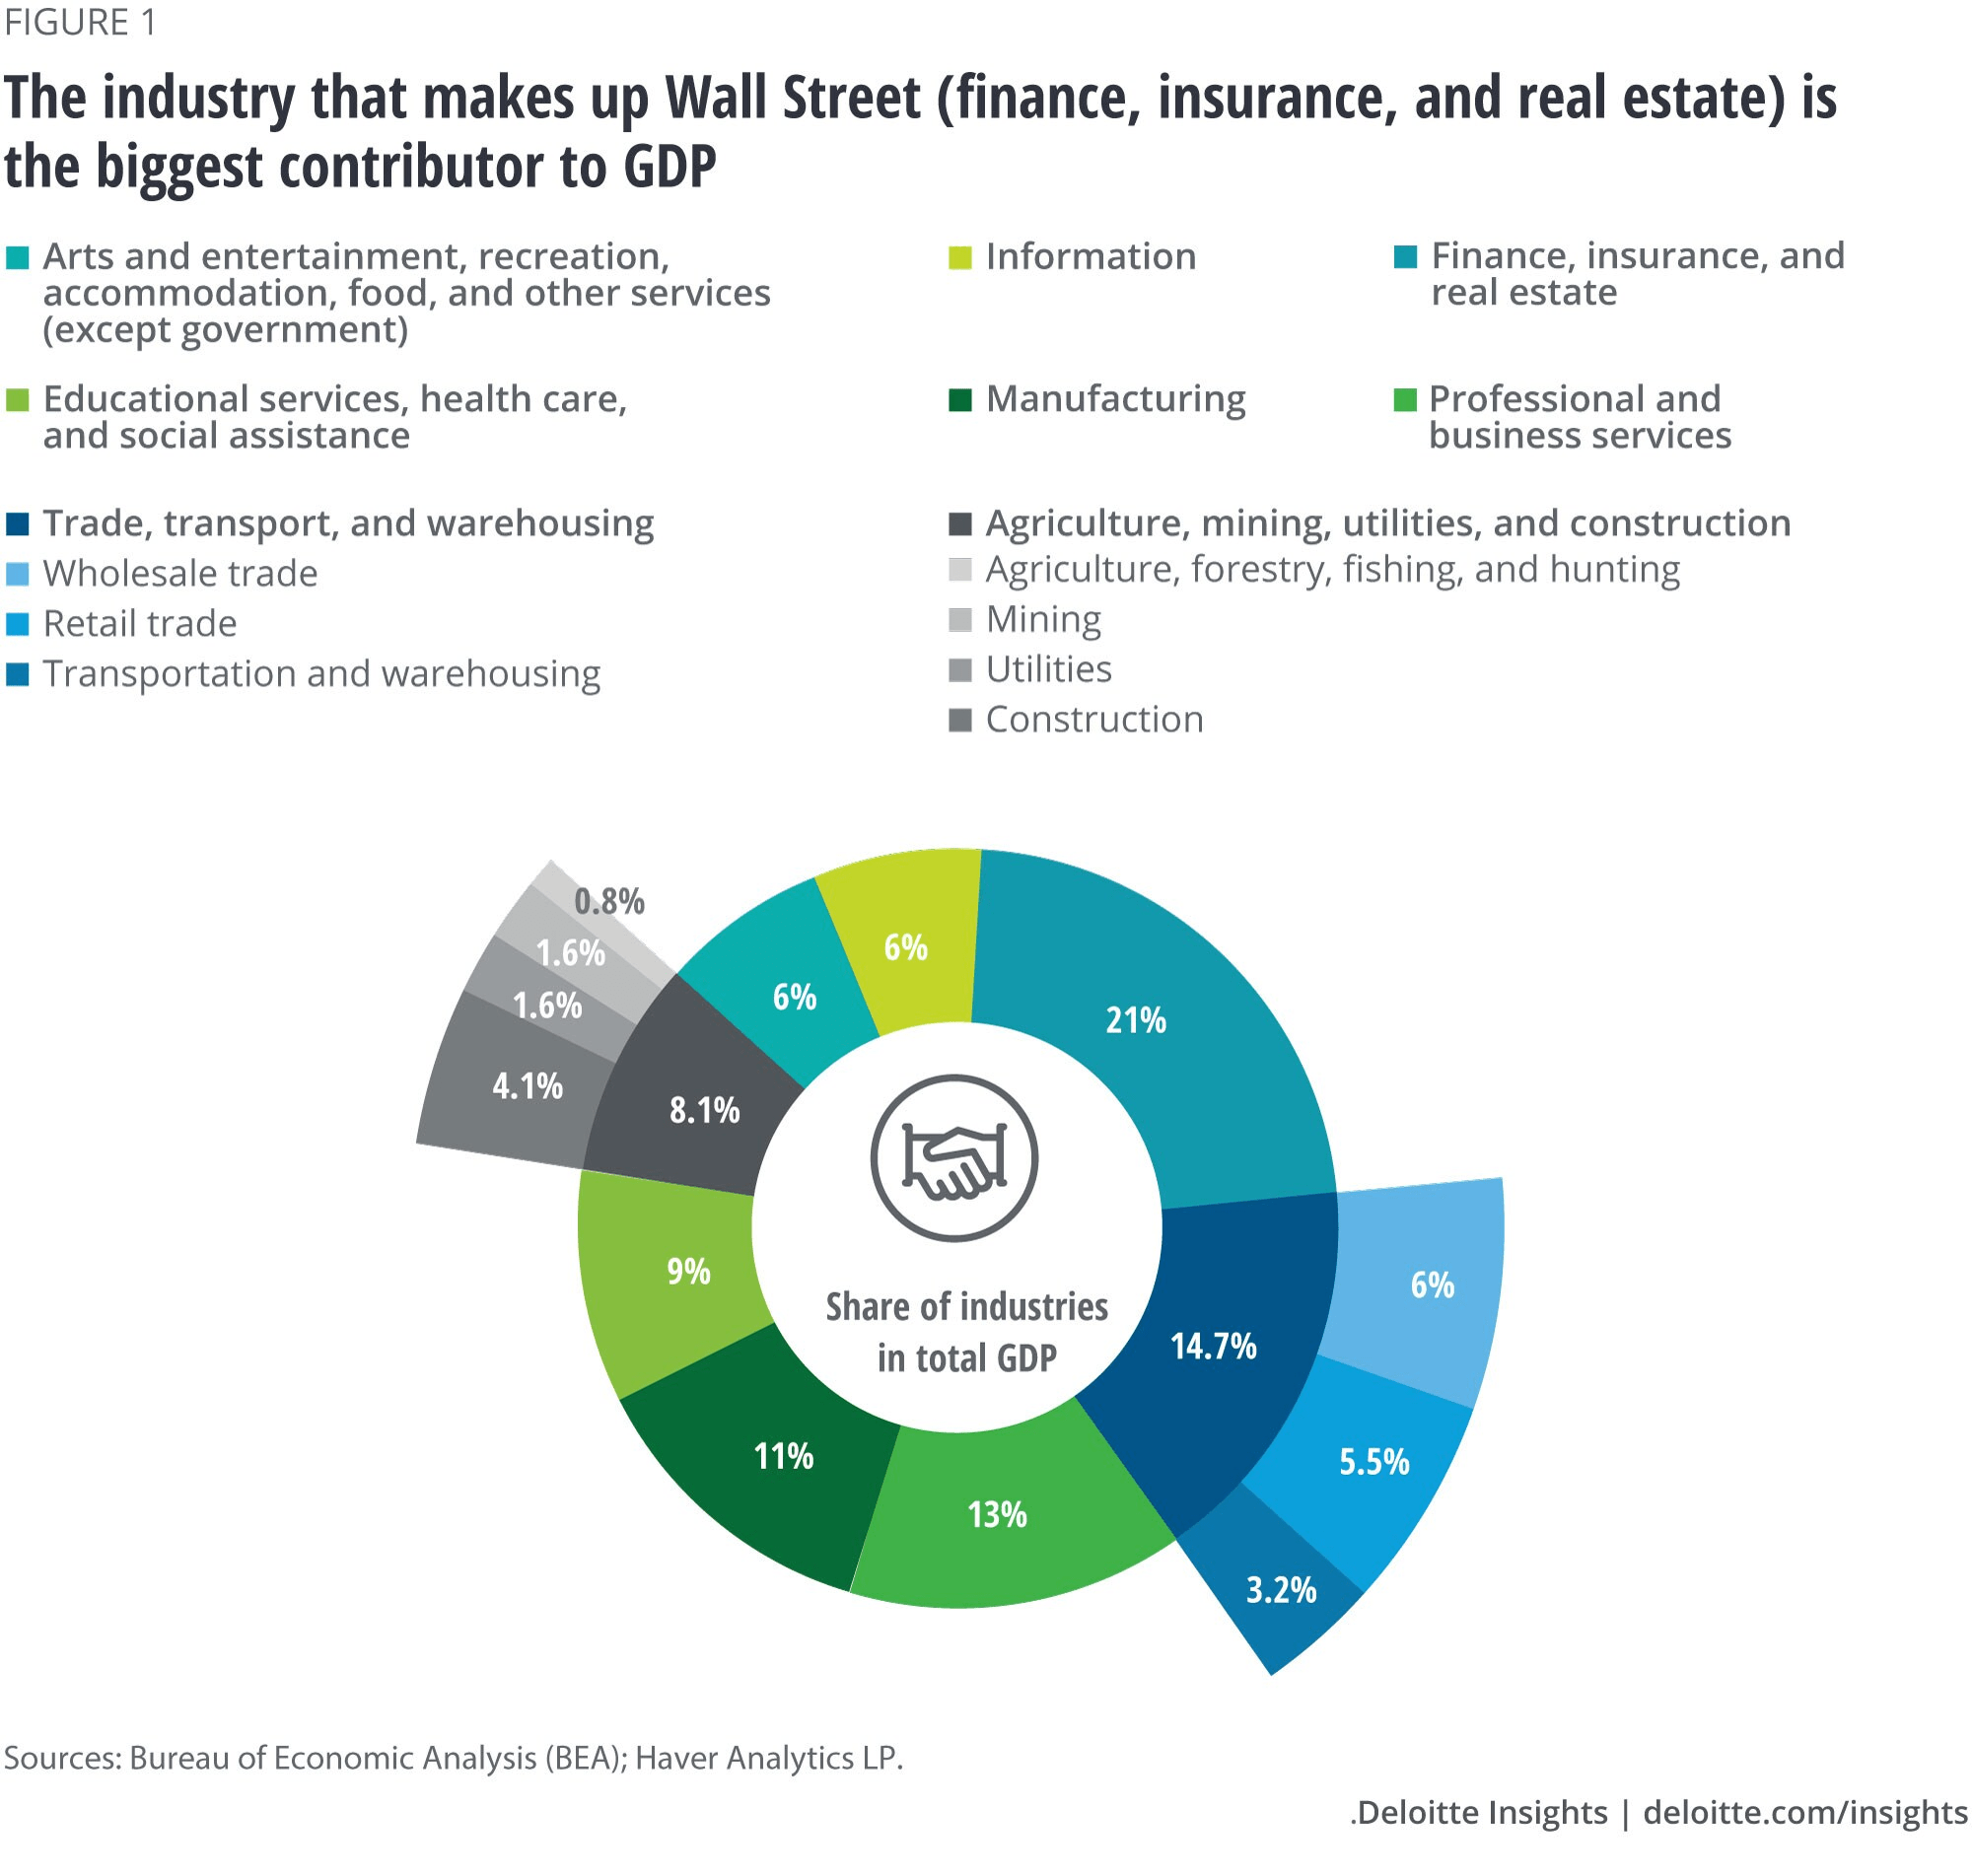
Here is a chart from the first part of this Macro Letter showing the composition of global corporate capital raising in 2020: –
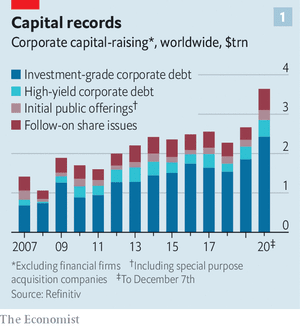
Source: The Economist
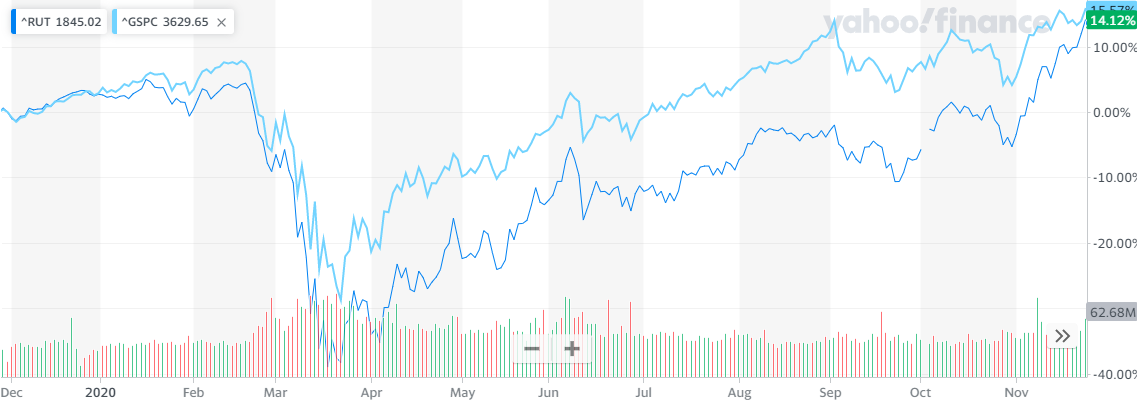
This brings us to the story of GameStop (GME) a video gaming retailer with dismal earnings expectations that was trading at less than $5/share in August of 2020 and peaked at $347/share during a frenzy of hedge fund short covering last month. An excellent description of the time-line and the players involved in the saga can be found in – How Main Street stormed the Financial Capital – the GameStop Story – Vijar Kohli. The GameStop effect spilt over into many small-cap names and pushed the Russell 2000 index to new highs.
The GameStop tale is intertwined with the fortunes of a retail stockbroker with the beguiling name, Robinhood Financial , and an even more beguiling mobile app. This CNBC article from October 2020 – How Robinhood and Covid opened the floodgates for 13 million amateur stock traders– sheds light on this new phenomenon: –
Robinhood has been the fintech darling of Silicon Valley, founded by Vladimir Tenev and Baiju Bhatt in 2013. The app has amassed 13 million user accounts and led the way for zero-commission fee trading. In no time, it has created brand awareness and popularity unlike that of the legacy brokerages such as Charles Schwab and Fidelity, or its app-first competitors like Webull and Dough.
Despite Robinhood being forced to suspend customer purchases of GameStop, together with some other securities – precipitating an SEC investigation and string of Class Action law suits – the company has continued to take on new clients. According to Rainmaker Securities, the latest private bids for Robinhood shares puts the company’s valuation around $40bln. This February 2021 article from Yahoo Finance – Robinhood is still the app of choice for retail investors: new data– provides more colour. Here is a chart showing the downloads of the Robinhood App last month: –
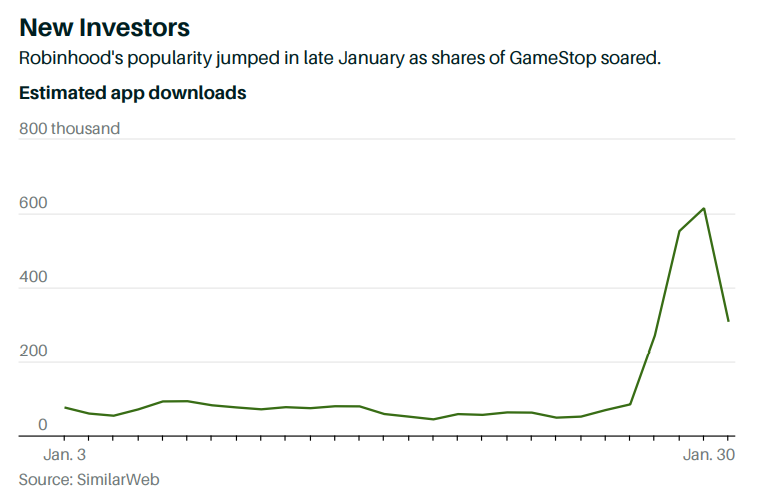
Source: SimilarWeb, Gavekal
For a more robust economic analysis of the implications of the GameStop saga, Weimin Chen, The Austrian Economic Center – Gamestop Market Mayhem and the Sickness of the Economy is illuminating:. The author concludes: –
There will likely be future limitations placed by brokerage platforms, greater calls for government regulation of the markets, more instances of hysteric market actions, and a general scramble for the next Gamestop style speculation. Federal Reserve Chairman Jerome Powell was quick to deflect blame for this week’s market volatility, but this could be just the beginning of more upcoming economic turbulence.
Another feature of the Robinhood Effect has been the dramatic increase in call option trading on single stocks: –
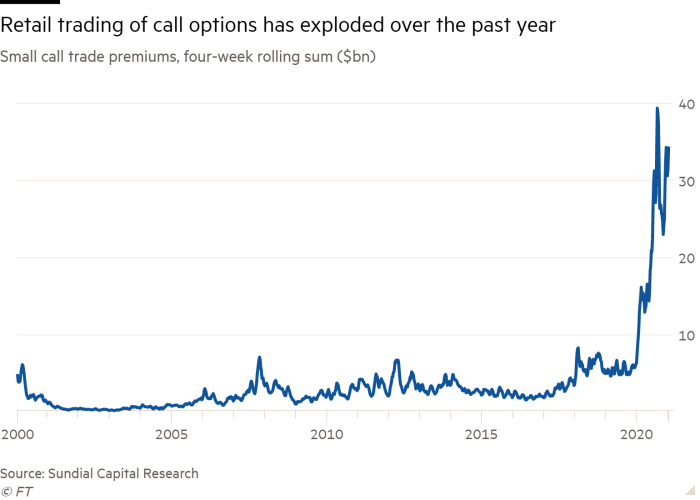
Source: FT, Sundial Capital Research
A common claim is that 90% of options expire worthless, but this is based on the fact that only 10% of option contracts are exercised. According to the CBOE, between 55% and 60% of options contracts are closed out prior to expiration. A more reasonable estimate is therefore that 30-35% of contracts that actually expire worthless. Nonetheless, retail investors have still paid option market-makers a vastly increased amount of option premium during the past year.
The traded options market is also an important indicator of risk. When the stock market falls, price volatility tends to rise, but option prices can anticipate changes in risk appetite. Without delving too deeply into the dark arts of option trading, in stable market conditions, call options tend to have lower prices (and therefore lower implied volatility) than put options, since investors tend to sell call options against their underlying portfolios but purchase put options to protect themselves from sudden market declines. There is a lot more to option pricing and trading than we can discuss here, suffice to say the Chicago Board Options Exchange (CBOE) calculate a SKEW Index – the difference between the relative price of different call and put options. SKEW values generally range between 100 and 150 – the higher the value, the higher the perceived tail risk. A reading of 100 should represent its lower bound (low tail-risk). For a further explanation I defer to David Kotok of Cumberland Advisors – GameStop And SKEW: –
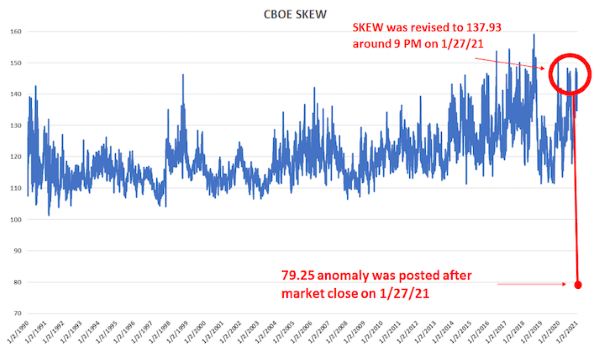
Source: CBOE, Cumberland Advisors
When you examine the SKEW methodology closely, you realize that a 79.25 price is practically impossible. It would mean that the stock market is paying you to take a tail-risk. In other words, such a price means that a trade can be constructed in which the investor cannot lose significantly. This is never supposed to happen. But we see that there is evidence that such a trade may have occurred on the same day as the wild swings of short covering and GameStop trading. That price suggests a market distortion that was quickly multiplied by many times.
Markets are complex systems, the price action in GameStop – and other small cap securities – feeds through to the option market, which in turn impacts other markets. The hedge fund Melvin Capital survived the brutal GameStop short-squeeze to fight another day but the episode is reminiscent, in a more contained way, of the LTCM debacle of 1998 – here is the report of the President’s Working Group on Financial Markets from April 1999 – Hedge Funds, Leverage, and the Lessons of Long-Term Capital Management.
The Robinhood Effect – a lethal mixture of work from home, stay at home and getting a government relief cheque – has been mirrored among other online brokers: –

Source: Horizon Fintex
A similar rise in first-time retail customers is evident in the Cryptocurrency and Foreign Exchange markets.
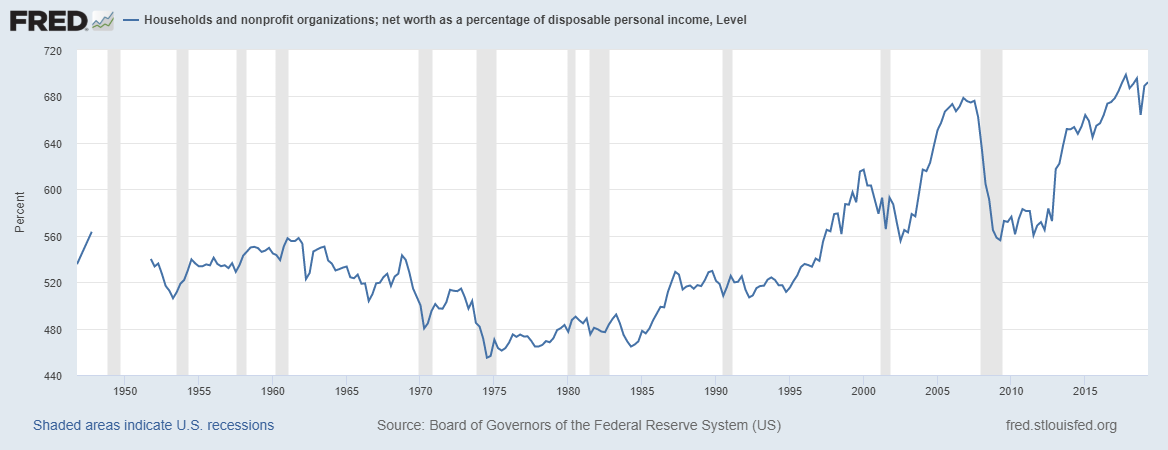
Another sign of assets being in bubble territory is the performance of the housing market. Now, it goes without saying, all property is local, but looking at the US, where the fiscal and monetary response has been the largest, we find yet another asset market at an all-time high: –
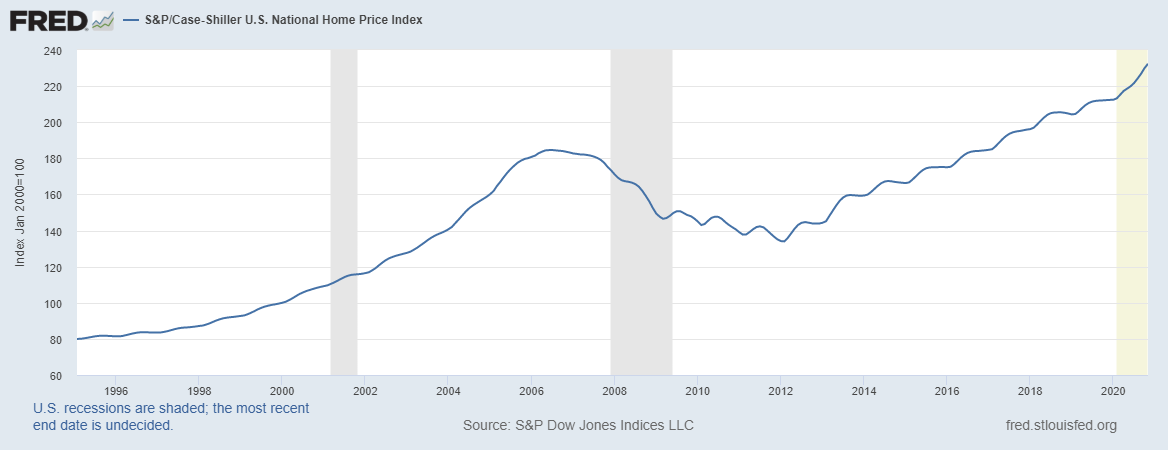
Source: Federal Reserve
The rise in house prices has been fuelled by cheap money: –
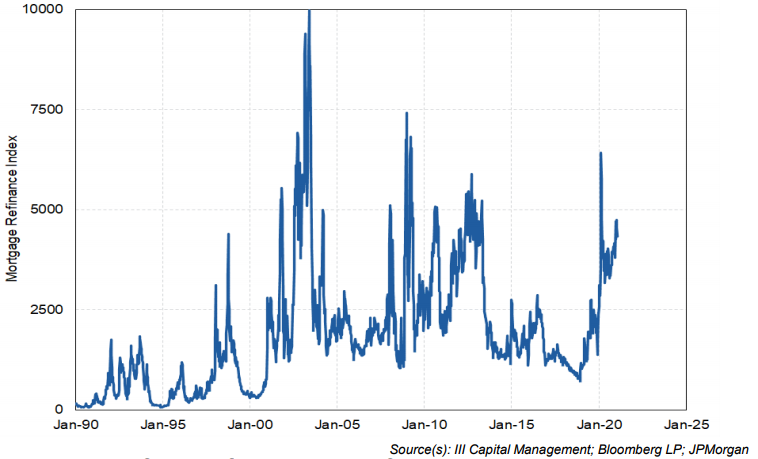
Source: III Capital Management, Bloomberg, JP Morgan
Combined with a shortage of supply: –
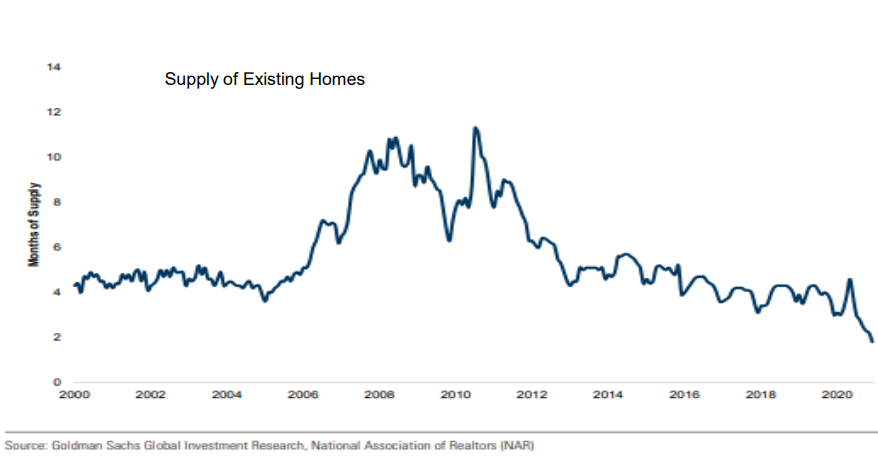
Source: III Capital Management, Goldman Sachs, NAR
Finally, fiscal and monetary expansion is akin to fiat currencies have debasement, it is scant surprise, therefore, to see Cryptocurrencies resurgent. The chart below shows the combined market capitalisation of all the listed digital currencies: –
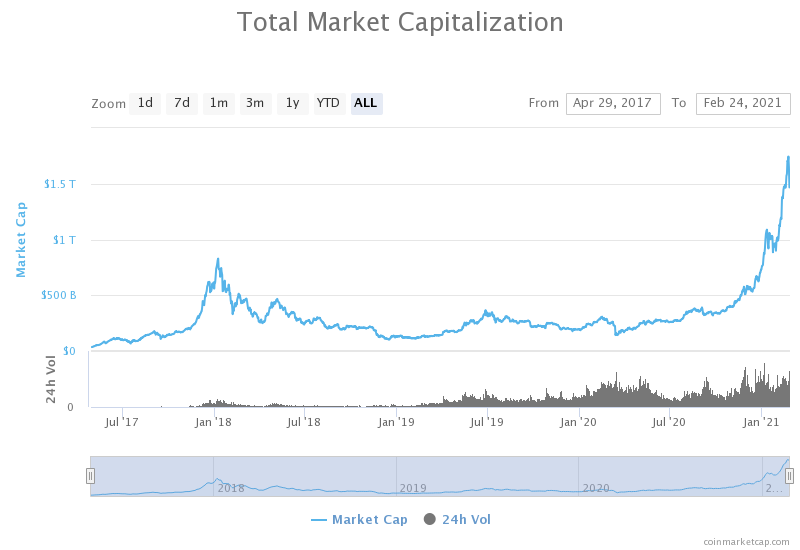
Source: Coinmarketcap.com
Of course the principal focus of the media has been on Bitcoin (BTC) access to which was made available to Paypal customers from October 2020. This month’s big stories include Telsa (TSLA) purchasing $1.5bln of BTC during January and Mastercard indicating that they intend to accept BTC as a form of payment later this year. The next chart shows the rising dominance of BTC (61%) compared to the previous peak in 2017: –

Source: Coinmarketcap.com
Ethereum (ETH) is second with a mere 12.7%. Putting digital assets in perspective, however, the market capitalisation of BTC, which just topped $1trln last week, is still less than 10% of the total market capitalisation of gold.
Whether or not one regards digital assets as an alternative store of value, soon to displace what Keynes dubbed the barbarous relic (gold), it is incontrovertible that the digital asset industry is in its infancy whilst the underlying technologies – DL, Blockchain and DeFi – have the potential to disrupt the entire financial system – who needs banks or other financial intermediaries in this brave new decentralised world? Coinbase, which has been described as the Robinhood of the Crypto world, is planning an IPO for later this year. The current indication is that it will achieve a capitalisation of $77bln.
What is of concern is that the Crypto charts above wreak of euphoria. Traders and investors with no prior experience, have jumped on the trend and now command cult-like status among the ingénue. Some of their followers will be lucky, but these price patterns are the tell-tale traits of a greater fool’s marketplace.
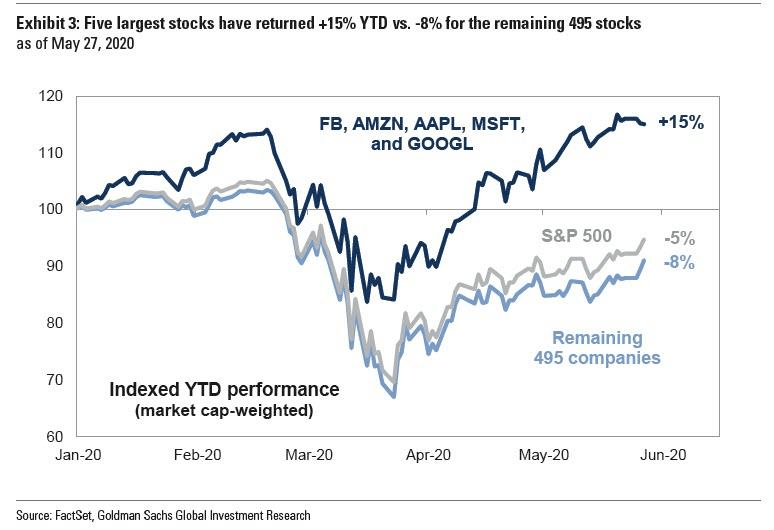
Even in the liquid, large-cap names, echoes of the DotCom bubble are apparent. Apple (AAPL) and Tesla (TSLA) stock rose more than 50% in the days after they announced stock splits. Apple created more value for shareholders by announcing a stock split in 2020 than through its new product launches, Tesla, which declared the first profit in its 18 year existence in 2020 ($721mln) has made more from its purchase of Bitcoin than it has made in its lifetime.
In a recent post, on what many have dubbed the everything bubble, – Is This The Biggest Financial Bubble Ever? Hell Yes It Is – John Rubino concludes: –
Meanwhile, the actions necessary to fix some of these bubbles are mutually exclusive. A stock market or housing bust requires much lower interest rates and bigger government deficits, while a currency crisis brought on by rising inflation requires higher interest rates and government spending cuts. Let everything blow up at once and there will be literally no fixing it. And the “everything bubble” will become the “everything bust.”
John’s website is called Dollar Collapse, of the two end-games he outlines above, letting the US$ slide is the least painful short-term solution, no wonder the US administration keep labelling other countries currency manipulators.
The Stock Market’s Nemesis
Having lain dormant for so long, its return to prominence may come as a shock to newer participants in the stock market: I am of course referring to the US Treasury Bond market. The chart below shows the 10yr yield over the last quarter century: –
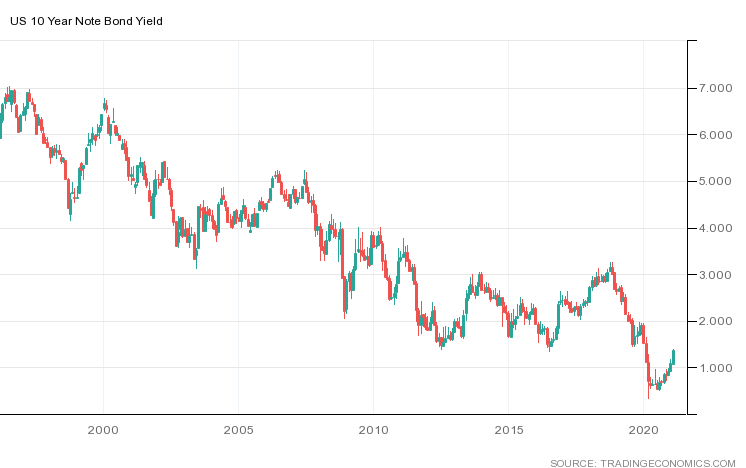
Source: Trading Economics
10yr yields hit their all-time low at 32bp last March, today (24th February) they have risen to 1.39%. The table below shows a selection of forecasts for year-end yields: –
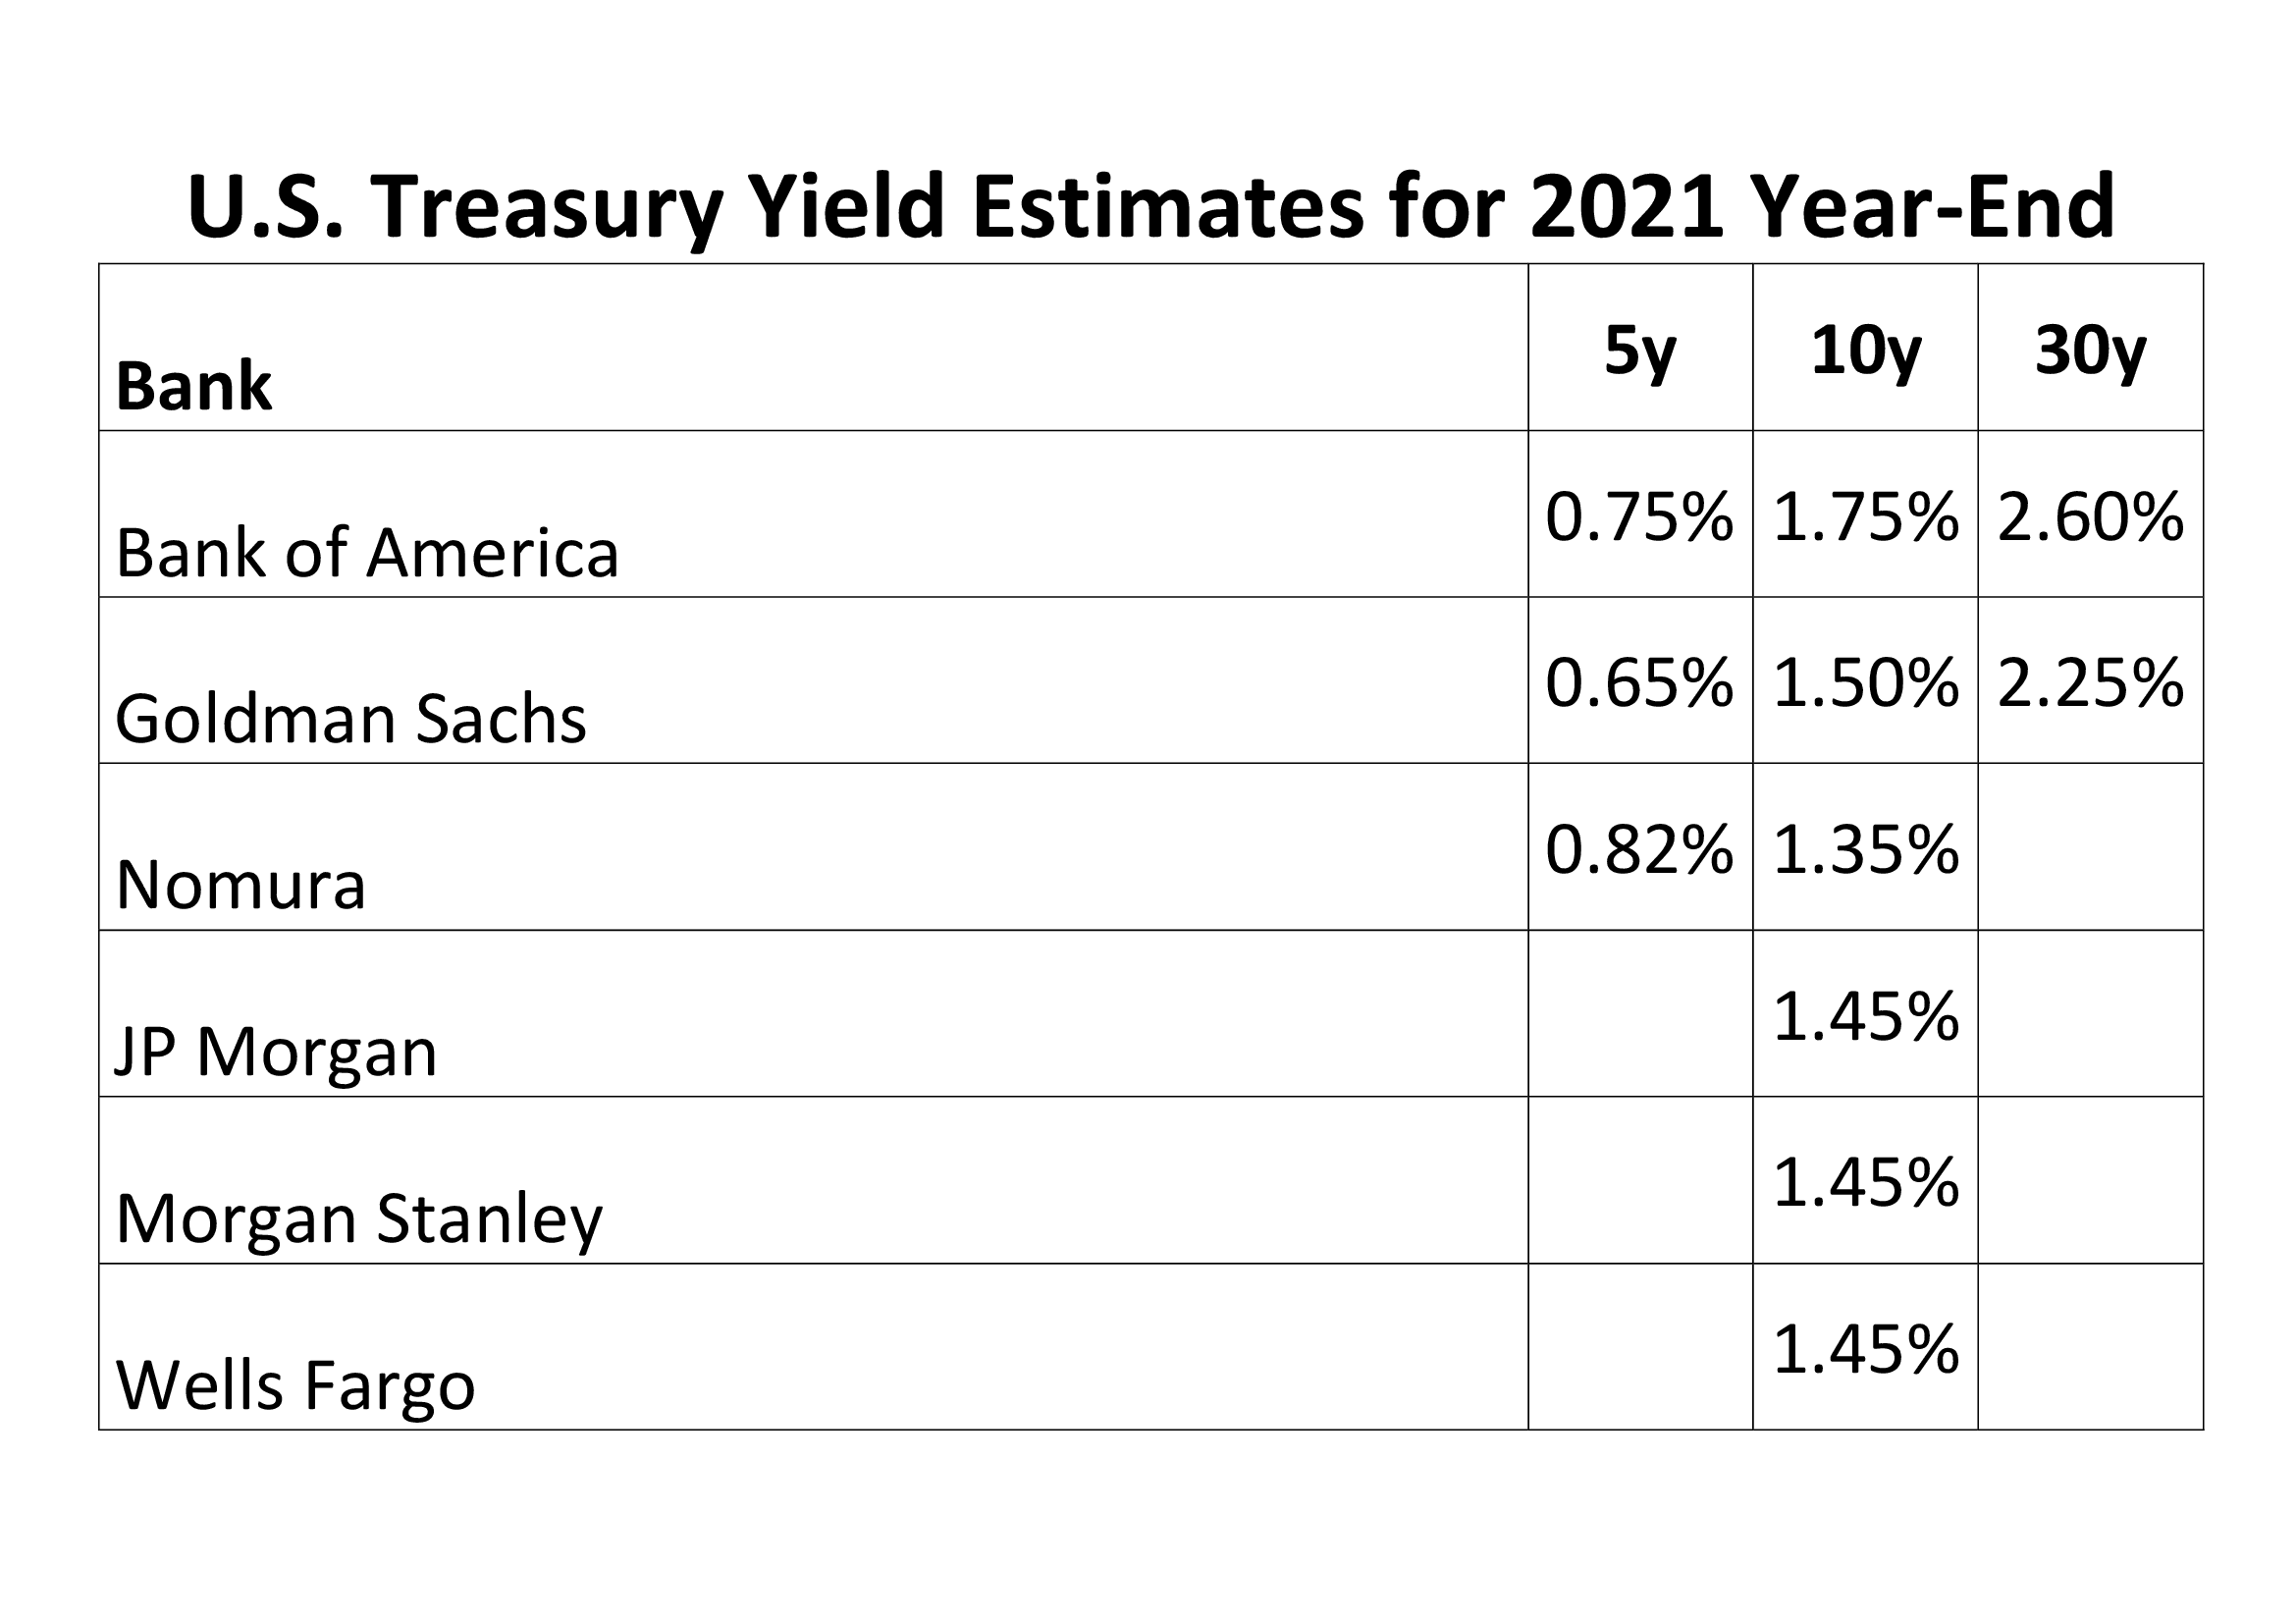
Source: III Capital Management
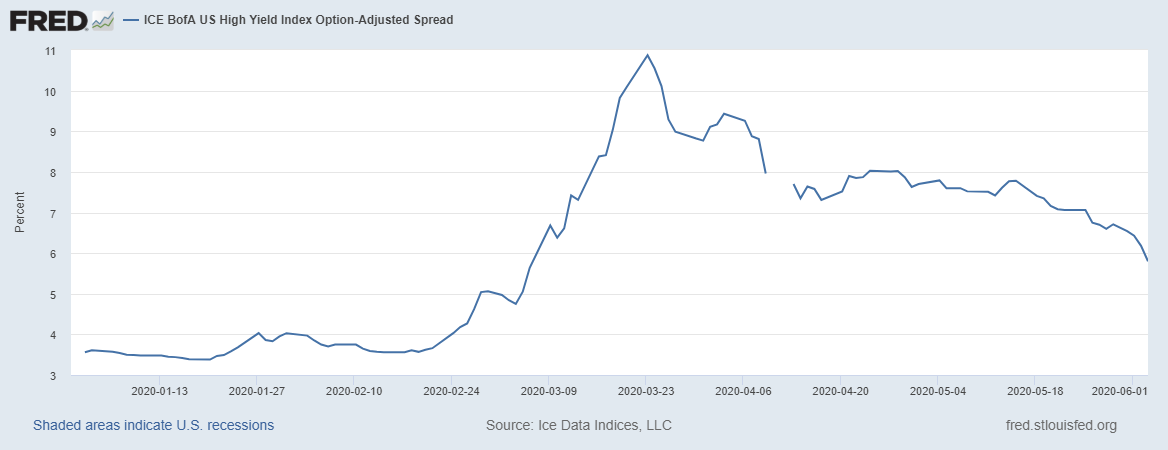
Central Bankers are holding short-term rates near to zero but the longer end of the yield-curve is being permitted to express concerns about the inflationary consequences of excessively accommodative fiscal and monetary policy. Meanwhile, central bank buying of corporate bonds has insured that credit spreads have shown a muted response to the recent increase in yields. At some point there will be an inflection point and credit will reprice violently. For those adventuring in the stock market, these words attributed to James Carville – a political adviser to President Clinton – remain worthy of careful reflection: –
I used to think that if there was reincarnation, I wanted to come back as the president or the pope or as a .400 baseball hitter. But now I would like to come back as the bond market. You can intimidate everybody.
Unless, as I expect, the world’s leading central banks intervene to fix the price of government bonds, the bond market, left to its own devices, will bring the stock market back to reality with a crash.
Conclusion and Investment Opportunities
Having written more than 6,000 words in this two part Macro Letter I still feel as if I have merely scratched the surface of the conflicting and contrasting factors which support the bull and bear case. Taking a step back, I encourage you to read Five Lessons From History By Morgan Housel, The Collaborative Funda short-ish article which presents five lessons which can be applied to investing and to life in general. In the interests of brevity: –
Lesson #1: People suffering from sudden, unexpected hardship are likely to adopt views they previously thought unthinkable.
Lesson #2: Reversion to the mean occurs because people persuasive enough to make something grow don’t have the kind of personalities that allow them to stop before pushing too far.
Lesson #3: Unsustainable things can last longer than you anticipate.
Lesson #4: Progress happens too slowly for people to notice; setbacks happen too fast for people to ignore.
Lesson #5: Wounds heal, scars last.
Reflecting on the current great viral crisis (GVC) and its aftermath, I see many signs of irrational exuberance but remain cognisant of the low likelihood of any sudden policy reversals by developed nation governments or their central banks, this is primarily due to the fragility of the current global economy. The scars of Covid will take many years to heal, unsustainable things may last longer than anticipated and, as JM Keynes famously observed: –
The markets can remain irrational longer than you can remain solvent.
The cult of the personality, personified by the likes of Elon Musk, remains ascendant, so reversion to mean may be postponed a while. There is widespread evidence of what the French philosopher Rene Girard dubbed mimetic desire; the idea that, because people imitate one another’s desires, they tend to desire the same things; in the process this desire creates rivalry and increases the fear of missing out. In the classic evolution of a bubble mimetic desire leads from the momentum or awareness phase to the hallowed halls of mania and euphoria: –
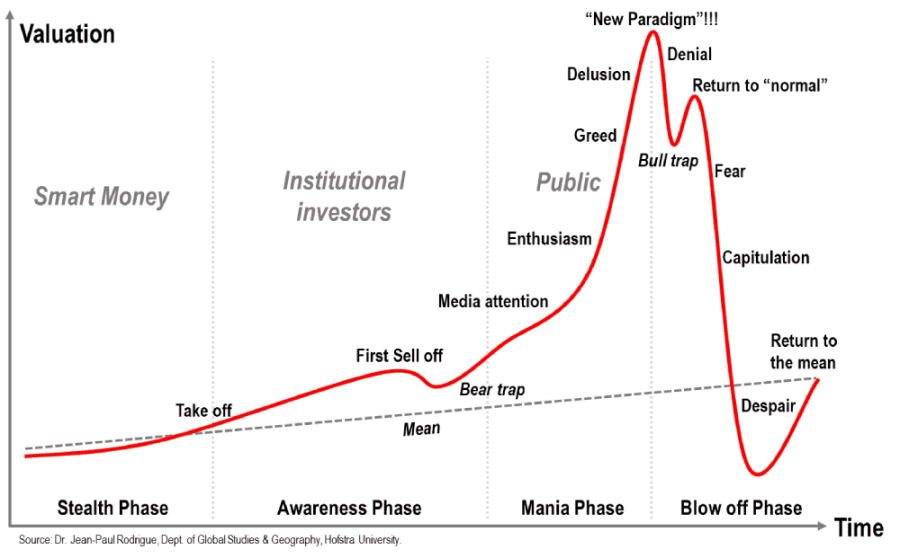
Source: Dr Jean-Paul Rodrigue – Holstra University
Now is not the time to be rushing headlong into the stock market, but the upward trend remains firmly in tact. Alan Greenspan observed irrational exuberance in 1996, it took the market another four years to reach its high, mimetic desire makes it hard for investors to risk taking profit for fear of missing an exponential rise. There are several risk reduction strategies, but these statements, attributed to two of the most successful investors of all time are always worth keeping in mind: –
Be fearful when others are greedy. Be greedy when others are fearful.
Warren Buffett
The time of maximum pessimism is the best time to buy and the time of maximum optimism is the best time to sell.
Sir John Templeton