Macro Letter – No 74 – 07-04-2017
US 30yr Swaps have yielded less than Treasuries since 2008 – does it matter?
- With 30yr Swap yields below T-bond yields arbitrage should be possible
- Higher capital requirements have increased the cost of holding T-bonds
- Central clearing has reduced counterparty risk for investors in swaps
- Maintaining swap market liquidity will be a critical role for Central Banks in the next crisis
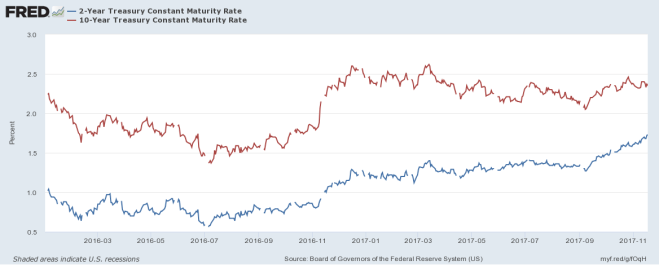
Global investors are drawn to US fixed income markets, among other reasons, because of the depth of liquidity. The long term investor, wishing to match assets against liabilities would traditionally purchase US Treasury bonds (T-bonds). This pattern of investment has not changed, but the yield on longer dated Treasuries has become structurally higher than the yield on interest rate swaps (IRS).
In a normally functioning market the lowest yield for a given maturity is usually the yield on government bonds – the so called risk free rate – however, regulatory and monetary policy changes have undermined this relationship.
Writing in March 2016 for Forbes, Darrell Duffie of Stanford University – Why Are Big Banks Offering Less Liquidity To Bond Markets? described the part of the story which relates to the repo market:-
The new Supplementary Leverage Ratio (SLR) rule changes everything for the repo market. For the largest U.S. banks, the SLR, meant to backstop risk-adjusted capital requirements, now requires 6% capital for all assets, regardless of their risk. For a typical large dealer bank, the SLR is a binding constraint and therefore pushes up the bank’s required equity for a $100 million repo trade by as much as for any other new position of the same gross size, for example a risky real estate loan of $100 million. This means that the bank’s required profit on a repo trade must be in the vicinity of the profit on a risky real estate loan in order for the repo trade to be viable for shareholder value maximization. That profit hurdle has become almost prohibitive for repo intermediation, so banks are providing dramatically less liquidity to the repo market. As a result, the spread between repo rates paid by non-banks and by banks has roughly tripled. The three-month treasury-secured repo rates paid by non-bank dealers are now even higher than three-month unsecured borrowing rates paid by banks, a significant market distortion. Trade volume in the bank-to-non-bank dealer market for U.S. government securities repo is less than half of 2012 levels.
Other factors that are distorting the Bond/Swap relationship include tighter macro prudential regulation and reduced dealer balance sheet capacity. Another factor is the activities of companies issuing debt.
Companies exchange floating rates of interest for fixed rates. When a company sells fixed-rate debt, it can use a swap to offset the payment of a bond coupon and pay a lower floating rate. Heavy corporate issuance can depress the spread between swaps and bonds. This can be exacerbated when dealers are swamped by sales of T-bonds. A combination of heavy company issuance being swapped and higher dealer inventories of Treasury debt, might explain why swap spreads turn negative over shorter periods.
Back in 2015, when the 10yr spread turned sharply negative, Deutsche Bank estimated that the long term fair value for swaps was 3bp higher than the same maturity T-bond. But negative spreads have continued. A side effect has been to raise the cost of US government financing, but Federal Reserve buying has probably more than compensated for this.
The declining volume of transactions in the repo market is one factor, the declining liquidity in the T-bond market is another. The quantitative easing policies of the Federal Reserve have lowered yields but they have also lowered liquidity of benchmark issues.
The final factor to consider is the demand for leveraged investment. One solution to the problem of matching assets versus liabilities is to leverage one’s investment in order to generate the requisite yield. This does, however, dramatically increase the risk profile of one’s portfolio. The easiest market in which to leverage a fixed income investment remains the IRS market but, as a white paper published last May – PNC – Why are swap rates trading below US Treasury Rates? highlights, the cost of leverage in the swap market has, if anything, increased more than in the bond repo market:-
The regulatory requirement for central clearing of most interest rate swaps (except for swaps with commercial end users) has removed counterparty risk from such swap contracts. Regulatory hedging costs and balance sheet constraints have also come into effect over the past few years. These rules have significantly reduced the market-making activity of swap dealers and increased the cost of leverage for such dealers. This is evidenced in the repo rates versus the Overnight Interest Swap* (OIS) basis widening. This basis widening strips rate expectations (OIS) from the pure funding premium (repo) rates. Swaps and Treasuries are less connected than in the past. The spread between them is a reflection of the relative demand for securities, which need to be financed, versus derivatives, which do not.
*The LIBOR-OIS Spread: The difference between LIBOR and OIS is called the LIBOR-OIS Spread and is deemed to be the health taking into consideration risk and liquidity. (An Overnight Index Swap (OIS) is a swap where the floating payments are based on the overnight Federal Funds Rate.)
For a more nuanced explanation, the publication, last month by Urban J. Jermann of the Wharton School, of a paper entitled – Negative Swap Spreads and Limited Arbitrage – is most insightful. Here are his conclusions based on the results of his arbitrage model:-
Negative swap spreads are inconsistent with an arbitrage-free environment. In reality, arbitrage is not costless. I have presented a model where specialized dealers trade swaps and bonds of different maturities. Costs for holding bonds can put a price wedge between bonds and swaps. I show a limiting case with very high bond holding costs, expected swap spreads should be negative. In this case, no term premium is required to price swaps, and this results in a significantly lower fixed swap rate. As a function of the level of bond holding costs, the model can move between this benchmark and the arbitrage-free case. The quantitative analysis of the model shows that under plausible holding costs, expected swap spreads are consistent with the values observed since 2008. Demand effects would operate in the model but are not explicitly required for these results.
My model can capture relatively rich interest rate dynamics. Conditional on the short rate, the model predicts a negative link between the term spread and the swap spread. The paper has presented some empirical evidence consistent with this property.
The chart below, which covers the period from 1999 up to Q3 2015, shows the evolution before and after the Great Financial Crisis. It is worth noting that the absolute yield may be an influence on this relationship too: as yields have risen in the past year, 30yr swap spreads have become less negative, 5yr and 10yr spreads have reverted to positive territory:-
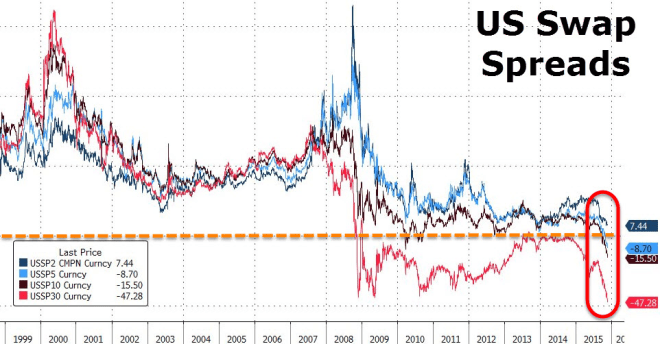
Source: ZeroHedge, Goldman Sachs
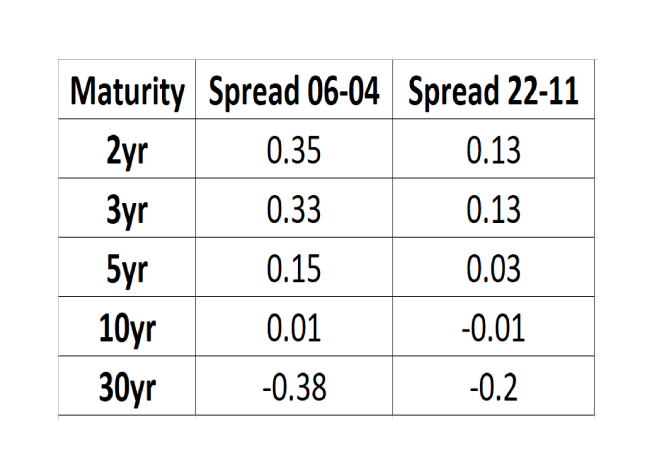
This table shows the current rates and spreads (6-4-2017):-
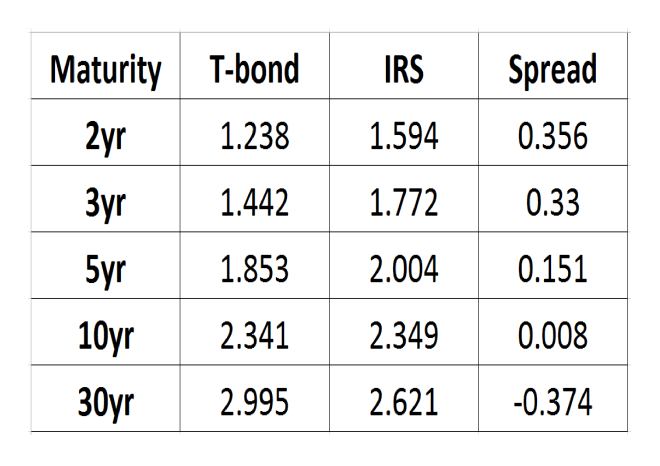
Source: Investing.com, The Financials.com
Conclusion and investment opportunity
The term “Risk-Free Rate” has always been suspect to my mind. As an investor, one seeks the highest return for the lowest risk. How different investors define risk varies of course, but, in public markets, illiquidity is usually high on the list of risks for which an investor would wish to be paid. If longer dated US T-bonds trade at a structurally higher yield than IRS’s, it is partly because they are perceived to lack their once vaunted liquidity. Dealers hold lower inventories of bonds, repo volumes have collapsed and central counterparty clearing of swaps has vastly reduced the counterparty risks of these, derivative, instruments. Added to this, as Jermann points out in his paper, frictional costs and uncertainty, about capital requirements and funding availability, make arbitrage between swaps and T-bonds far less clear cut.
When the German bond market collapsed during the unification crisis of the late 1980’s, it was Bund futures rather than Bunds which were preferred by traders. They offered liquidity and central counterparty clearing: and they did not require a repurchase agreement to set up the trade.
Today the IRS market increasingly determines the cost of finance, during the next crisis IRS yields may rise or fall by substantially more than the same maturity of US T-bond, but that is because they are the most liquid instruments and are only indirectly supported by the Central Bank.
At its heart, the Great Financial Crisis revolved around a drying up of liquidity in multiple financial markets simultaneously. Tightening of regulation and increases in capital requirements since the crisis has permanently reduced liquidity in many of these markets. Meanwhile, increasingly sophisticated technology has increased the speed at which liquidity provision can be withdrawn.
It behoves the Federal Reserve to become an active participant in the IRS market. Control of the swap market is likely to be the key to maintaining market stability, come the next crisis. IRS’s, replete with their leveraged investors, have assumed the mantle which was once the preserve of the US Treasury market.
In previous crises the “flight to quality” effect was substantial, in the next, with such a small free float of actively traded T-bonds, which are not already owned by the Federal Reserve, the effect is likely to be much greater. The latest FOMC Minutes suggest the Fed may turn its attention towards reducing the size of its balance sheet but the timing is still unclear and the first asset disposals are likely to be Mortgage Backed Securities rather than T-bonds.
Meanwhile, although interest rates have risen from historic lows they remain far below their long run average. Pension funds and other long term investors still require 7% or more in annualised returns in order to meet their liabilities. They are being forced to continuously increase their investment risk and many have chosen to use the swap market. The next crisis is likely to see an even more pronounced unravelling than in 2008/2009. The unravelling may not happen for some while but the stresses are likely to be focused on the IRS market.