Macro Letter – No 115 – 24-05-2019
Trade Wars, the prospects for freer trade and the impact on asset prices
- Will the Sino-US trade war breed contagion?
- Will the dispute trigger a global recession?
- Has the era of freer trade ended?
- Will asset prices suffer?
As Sino-US trade talks ended, not only, without a deal, but with another sharp increase in tariffs, it is worth looking at what has happened and why. During 2018 the US reversed 38 years of tariff reduction with a radical abruptness, imposing tariffs on 50% of Chinese imports, China retaliated in kind, imposing tariffs on 70% of US imports. The Peterson Institute – The 2018 US-China Trade Conflict after 40 Years of Special Protection – published before the recent tariff increases, reviews the situation in detail. The author, Chad Brown, begins by looking at the tariff reductions since the late 1980’s. For the US, these tariffs had fallen from 5% to 3%, whilst for China they declined from 40% to 8% by 2017. Over the same period China’s share of US imports rose from near to zero in 1978 to 20% by 2014. By contrast, Chinese imports from the US rose steadily, reaching 10% in 2001 – which coincided with their ascension to the World Trade Organisation (WTO) – however, since then, imports from the US have declined, dipping to 8.5% by 2017. In bilateral terms Chinese imports from the US are about a quarter of her exports to the land of the free.
At first sight, it might seem as if the trade tensions between China and the US are new, but relations have been deteriorating since the bursting of the US Tech bubble in 2001, if not before. Looking at the chart below, which measures antidumping and countervailing tariffs, it appears as if the Chinese did not begin to retaliate until 2006: –
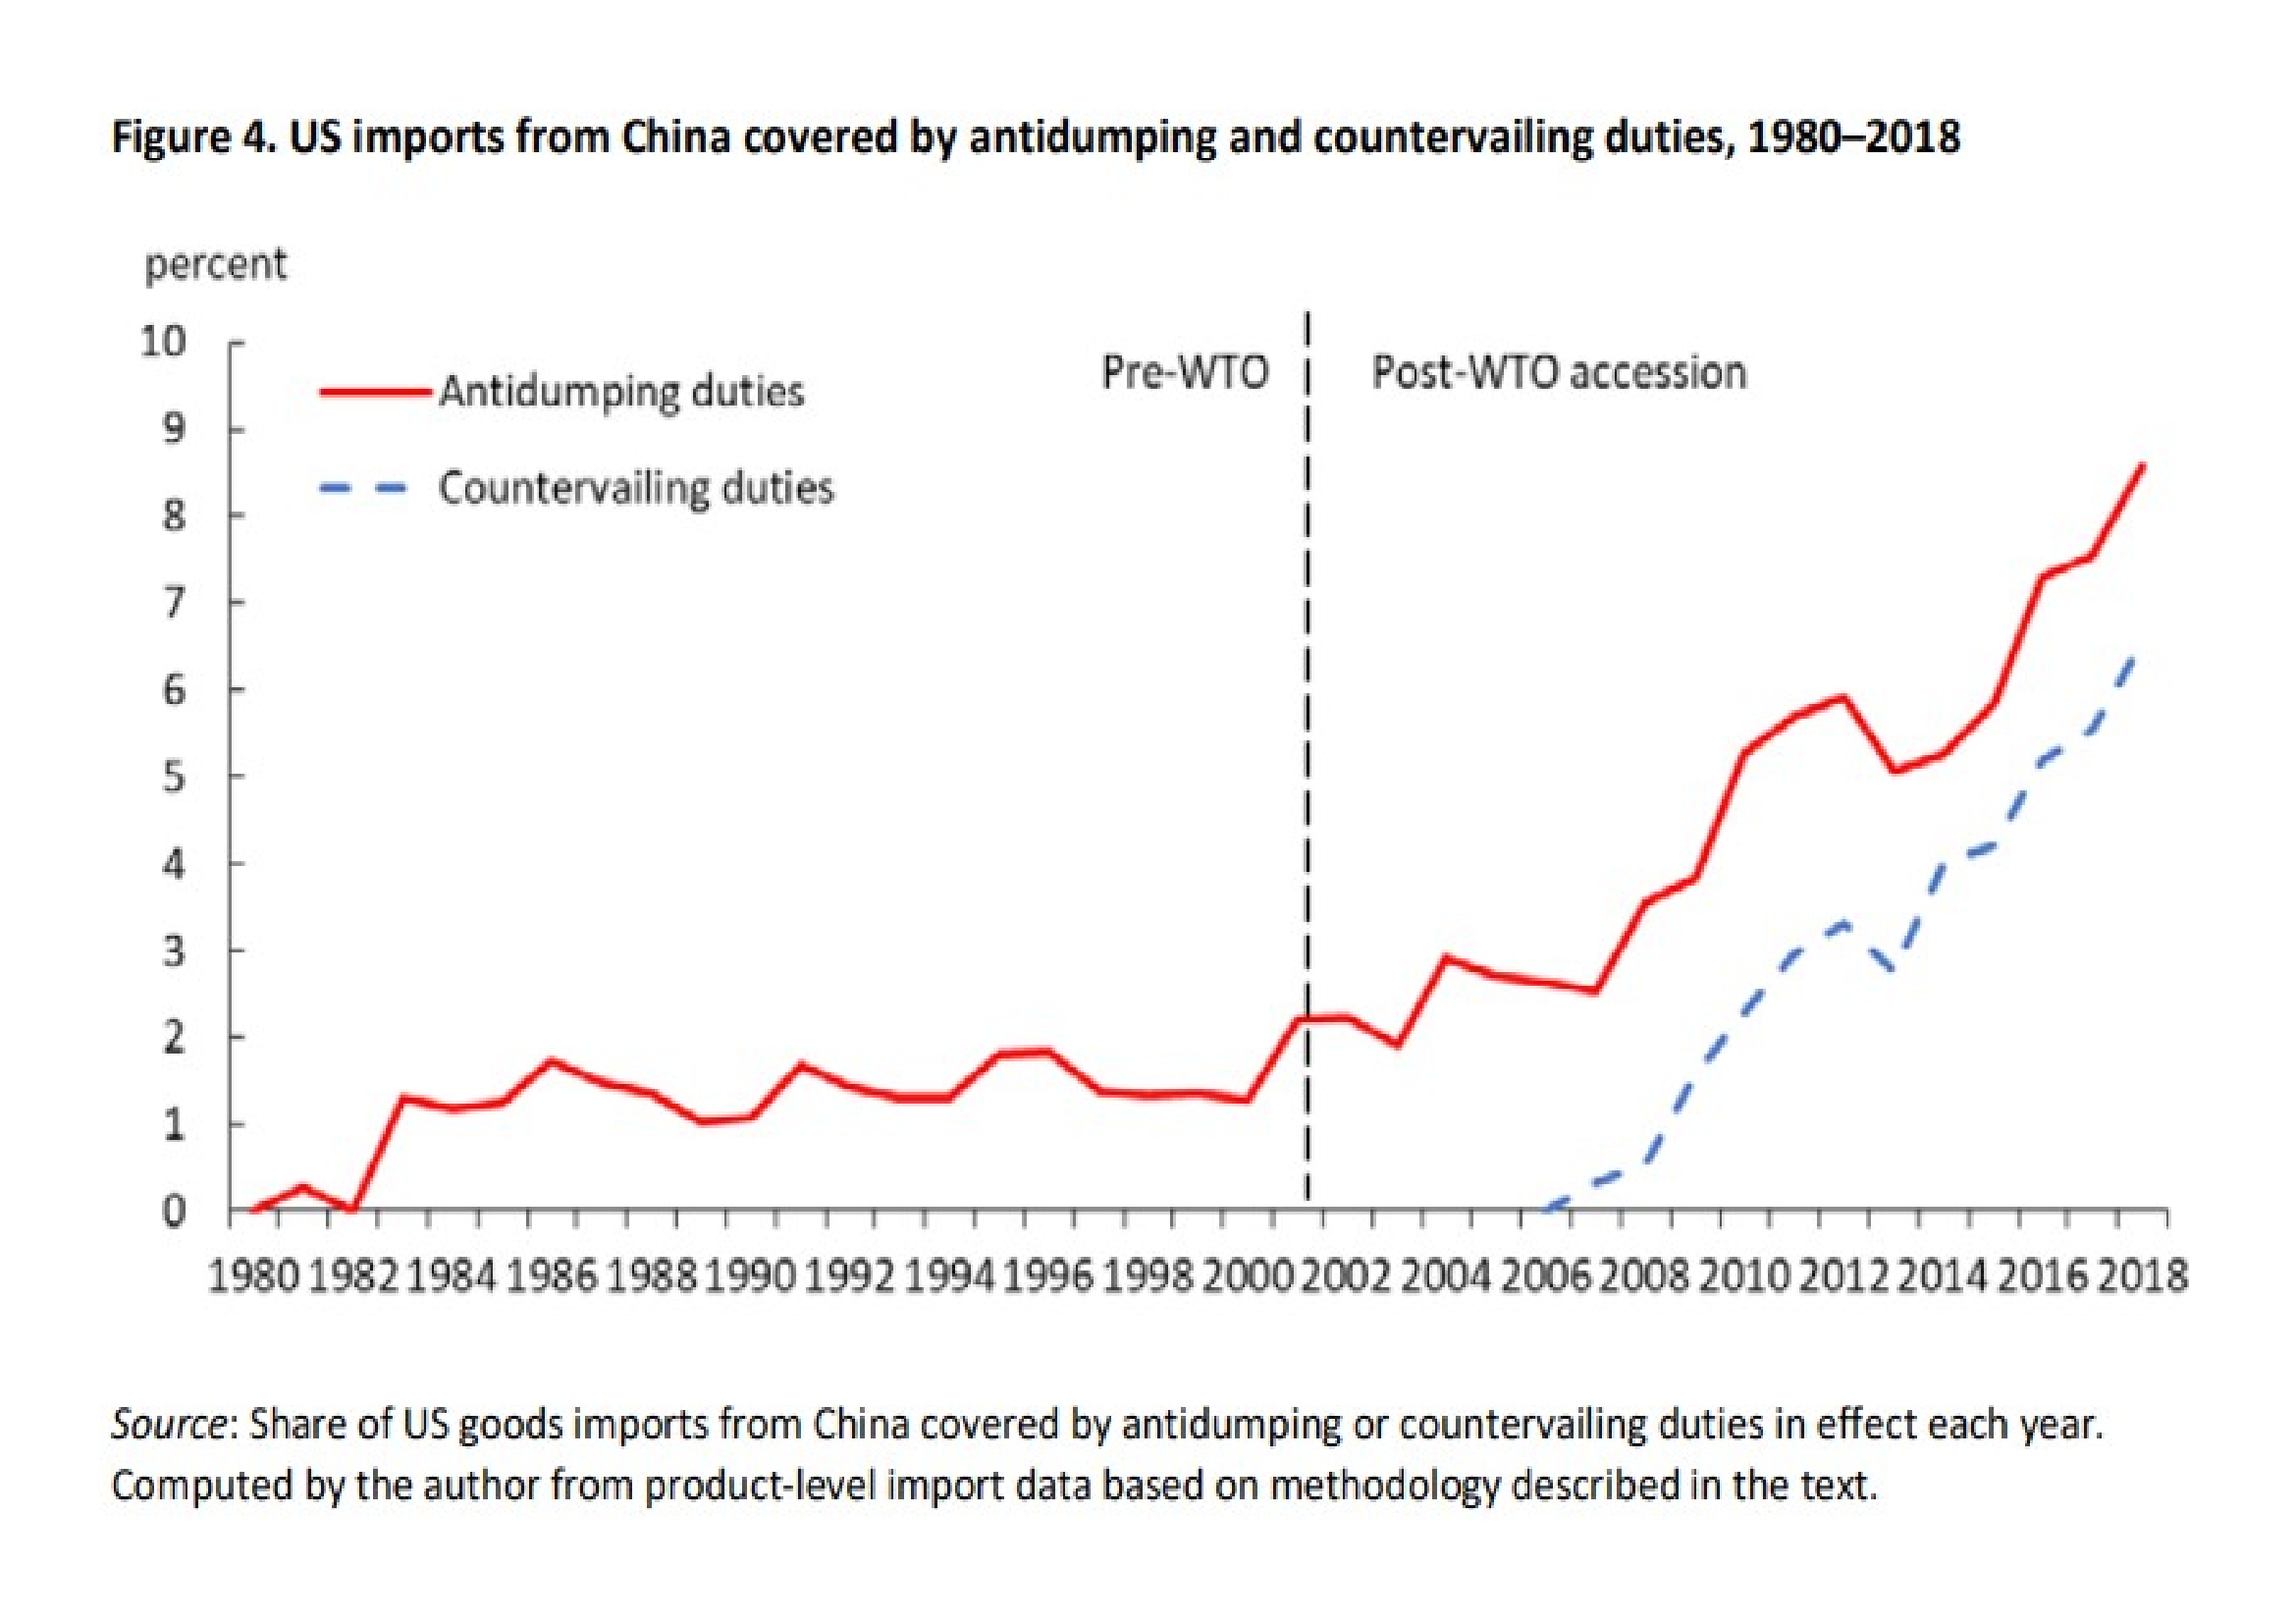
Source: Peterson Institute
Analysing anti-dumping and countervailing tariffs in isolation, however, gives a misleading impression of the US response to China. Peterson research attempts to assess the entire scope of the Sino-US trade dispute, by incorporating all forms of US special protection against China over the entire period. The next chart shows the true scale of US tariff reduction on Chinese imports; seen in this light, the extent of the recent policy shift is even more dramatic: –
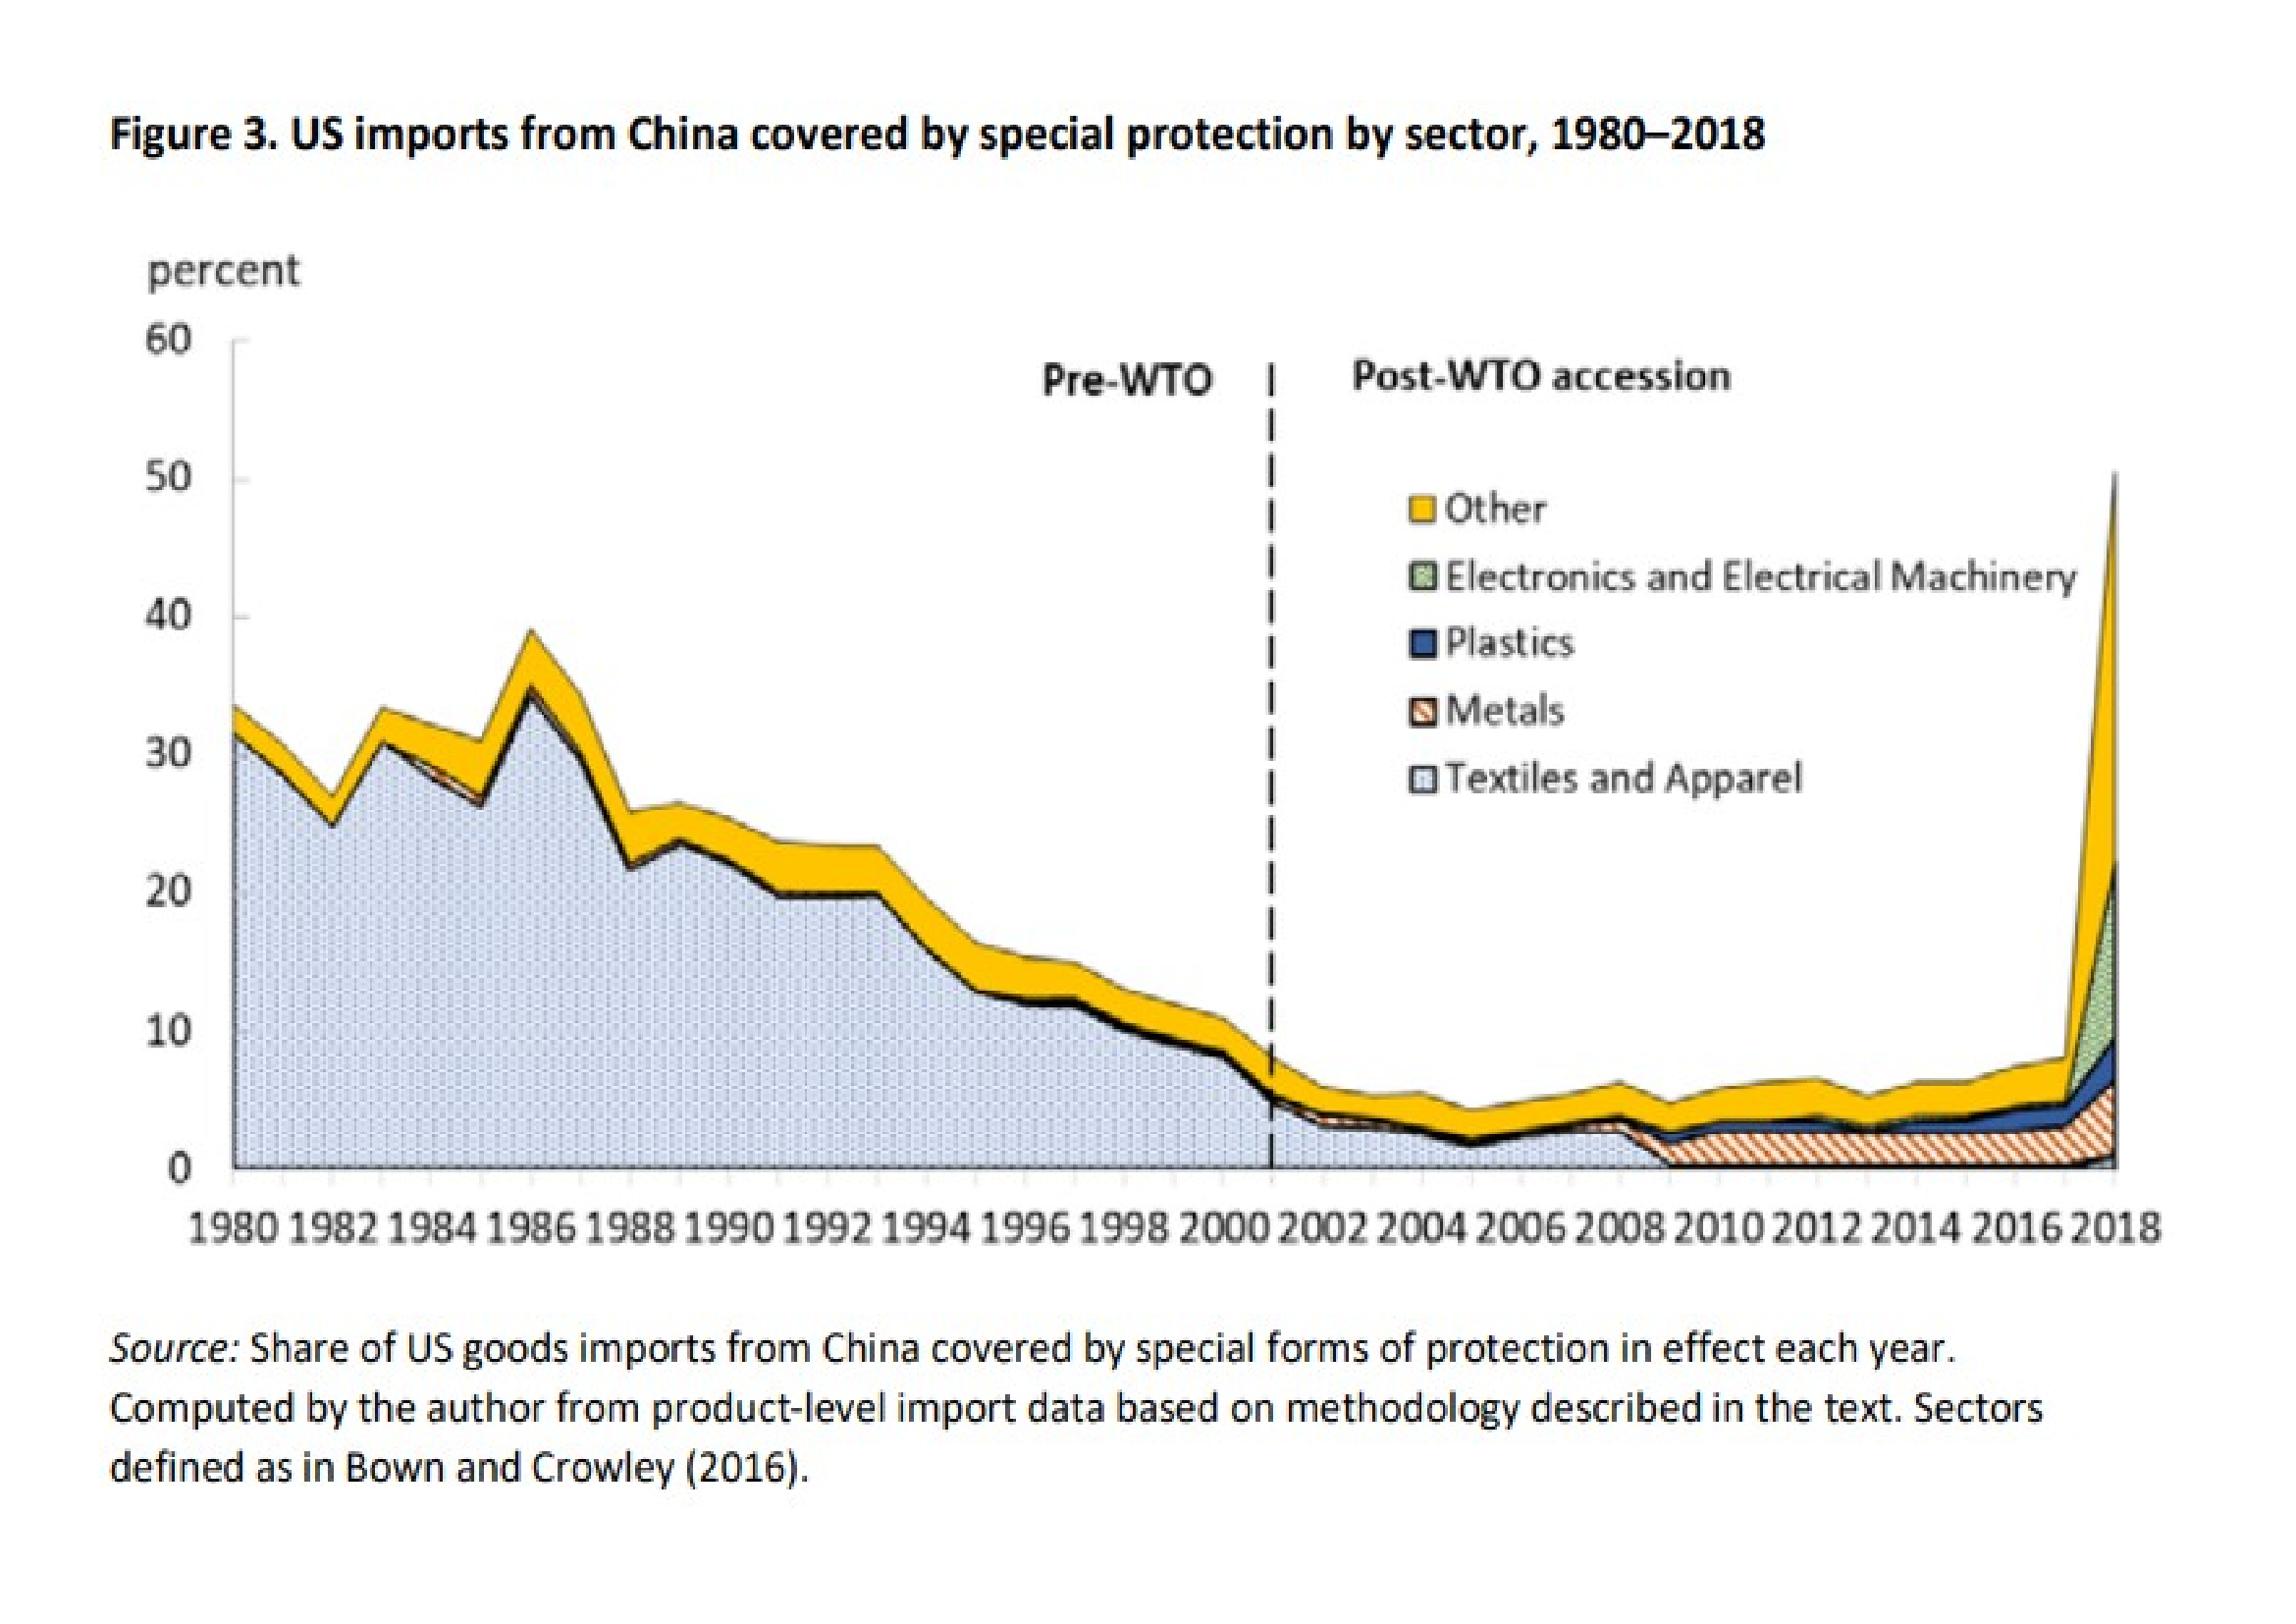
Source: Peterson Institute
Using this combined metric, US special protection peaked at 39% in 1986, after which these barriers declined rapidly reaching a nadir at 4.3% in 2005. On the eve of the trade war in 2017 barriers had risen to 8.1%. Prior to the May 10th tariff increase, that figure had jumped to 50%. An updated version of the Peterson chart of shown below: –
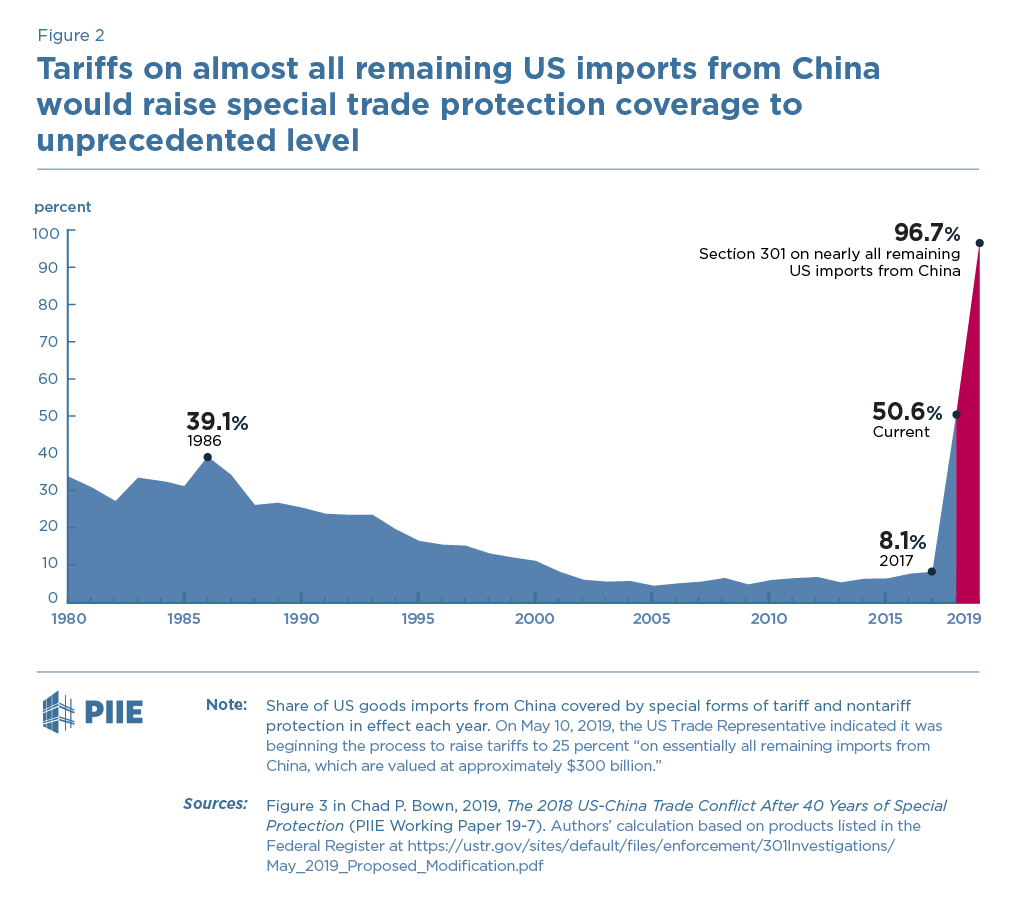
Source: Peterson Institute
The additional tariffs imposed this month will raise the average US tariff on Chinese goods to 18.3%. If Trump follows through with his threat to impose a 25% tariff on most of the rest of US imports from China, the average US tariff toward China would increase to 27.8%.
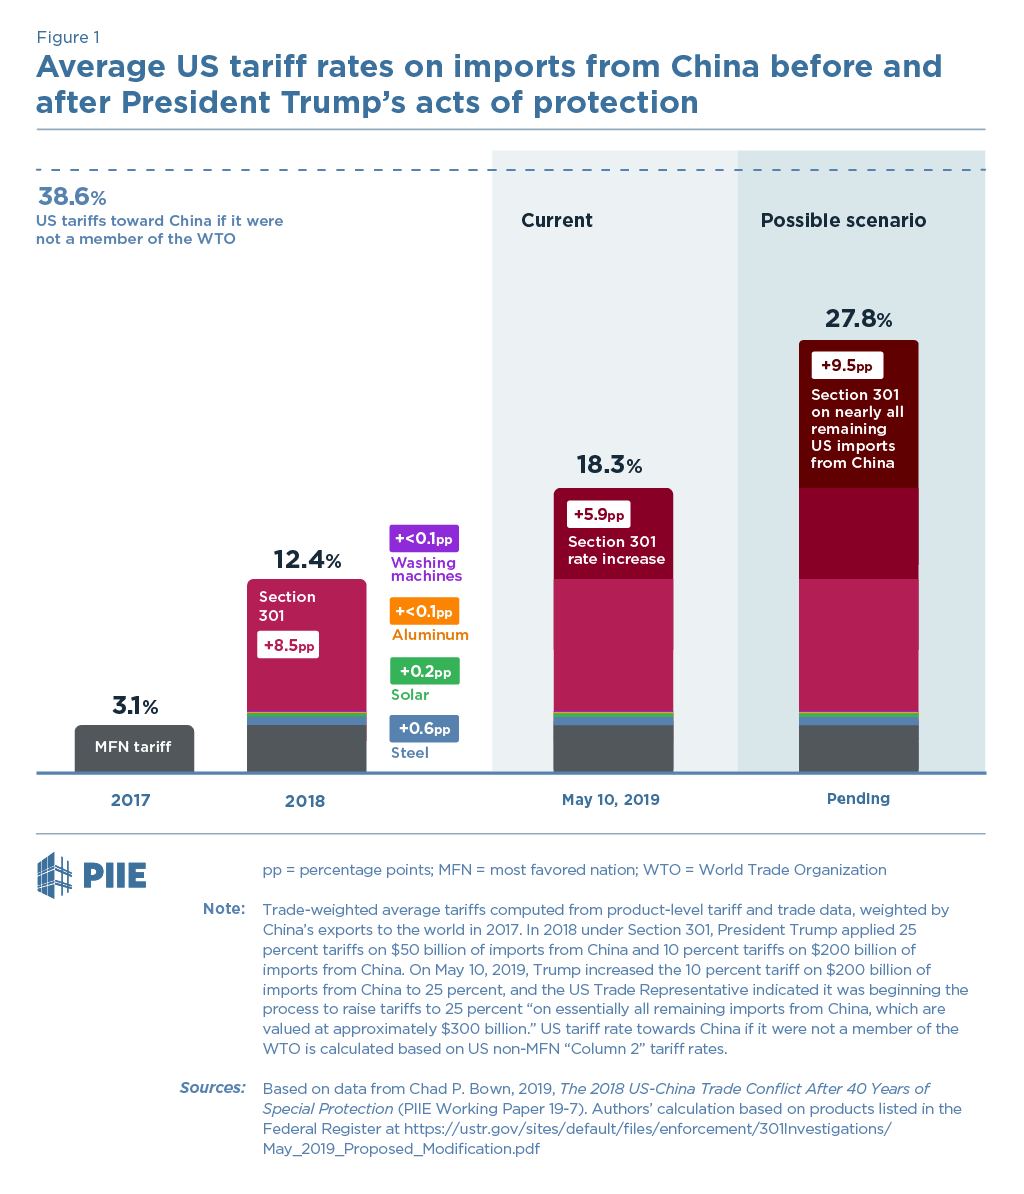
Source: Peterson Institute
What is the likely impact of these actions on trade and prices? For the US, import prices will increase, but given that US inflation has tended to be below the Fed target, this is manageable; corporates and consumers will pay the cost of tariffs, the tax receipts will help to finance the cost of recent US tax cuts. In China, whilst the impact is still negative, as this recent article from CFR – China Never Stopped Managing its Trade makes clear, the majority of imports are made by state owned enterprises or by companies which have a government permit to import such goods, added to which Chinese inflation has also been reasonably subdued, despite impressive continued economic expansion: –
When the state controls the firms that are doing the importing, a few phone calls can have a big impact. That’s why China can shut down trade in canola with Canada without formally introducing any tariffs.
That’s why China can scale back its purchases of Australian coal without filing a “dumping” or “national security” tariffs case.
And that’s why—when the trade war with the United States started—U.S. exports in a number of goods simply went to zero (normally, a 25 percent tariff would reduce imports by more like 50 percent or something…]
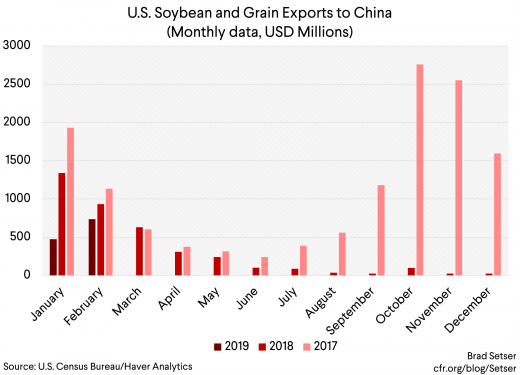
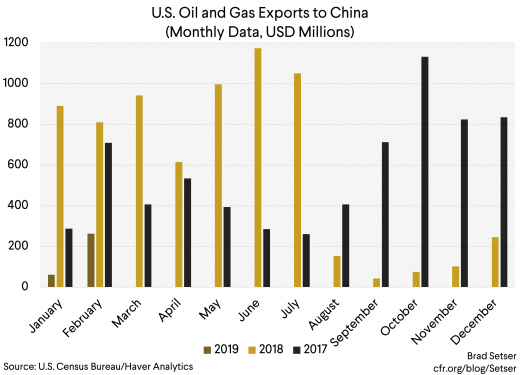
For US companies the four largest exports to China are aircraft, automobiles, soybeans and oil and gas. Of these, only automobiles are sold directly to the private sector. Here are three charts which explain why, for the US (at least in the near-term) there may be less to lose in this global game of chicken: –
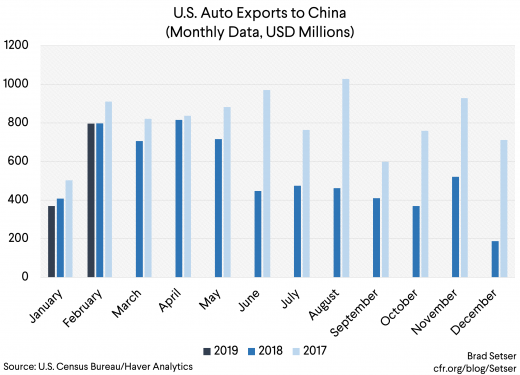
Source: US Census Bureau, Haver Analytics
Source: US Census Bureau, Haver Analytics
Source: US Census Bureau, Haver Analytics
The decline in US imports has been driven by a combination of substitution for imports from other sources and a rising domestic capability to manufacture intermediate goods. Faced with a dwindling market for their exports, the US might be forgiven for wishing to retire from the fray whilst it still has the advantage of being the ‘consumer of last resort’.
To date, US government receipts from tariff increases have amounted to an estimated $2bln. A study by the World Bank and the International Finance Corporation, however, estimates the true cost the US economy has been nearer to $6.4bln or 0.03% of GDP. The chart below shows the already substantial divergence between prices for tariff versus non-tariff goods: –
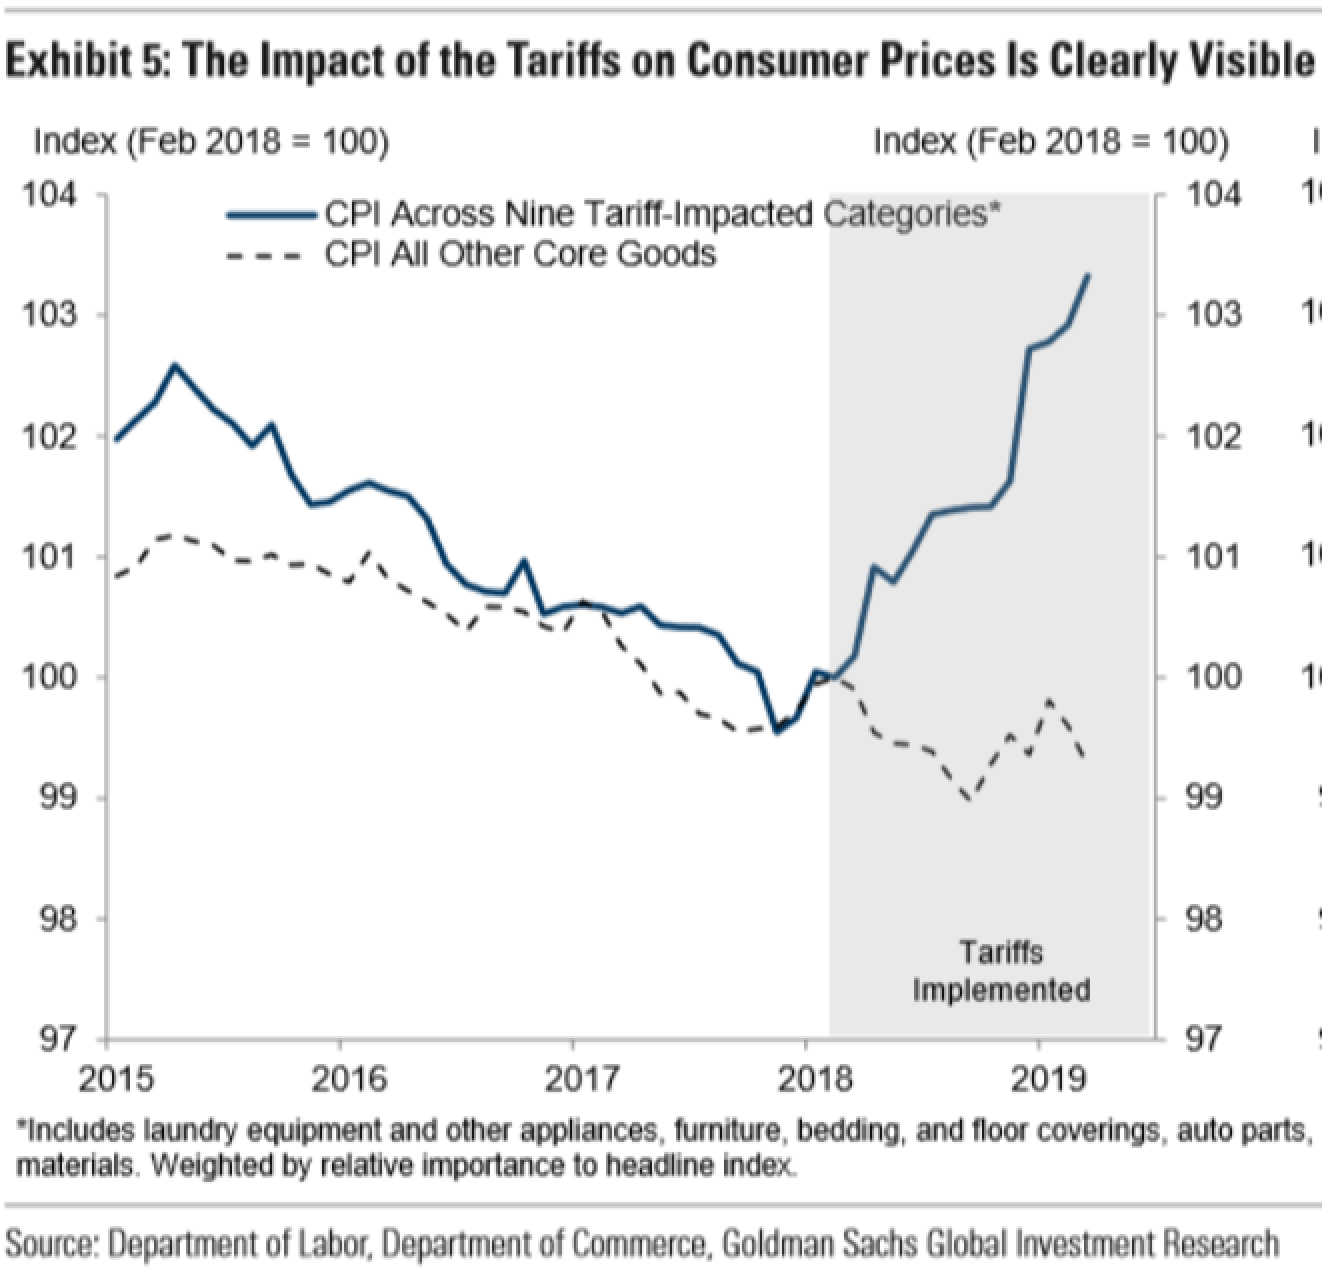
Source: Financial Sense, US Department of Labor, Commerce department, Goldman Sachs
The impact on China is more difficult to measure since Chinese statistics are difficult interpret, however, only 18% of Chinese exports are to the US – that equates to $446bln out of a total of $2.48trln in 2018, added to which, exports represent only 20% of Chinese GDP – all US imports amount to 3.6% of Chinese GDP.
The scale of the dispute (bilateral rather than multilateral) should not detract from its international significance. One institution which seen its credibility undermined by the imposition of US tariffs is the World Trade Organisation (WTO) – Chatham House – The Path Forward on WTO Reform provides an excellent primer to this knotty issue. Another concern, for economists, is that history is repeating itself. They fear Trump’s policies are a redux of the infamous Smoot-Hawley tariffs, imposed during the great depression. Peterson – Does Trump Want a Trade War? from March 2018 and Trump’s 2019 Protection Could Push China Back to Smoot-Hawley Tariff Levels published this month are instructive on this topic. These tariffs were implemented on 17th June 1930 and applied to hundreds of products. To put today’s dispute in perspective, the 1930’s tariff increase was only from 38% to 45% – a mere 18% increase – this month tariffs have increased from 10% to 25%: a 150% increase. Those who note that 25% is still well below 1930’s levels should not be complaisant, China remains a WTO member, were it not, US average tariffs would now be 38%. Back in 2016 President Trump talked of raising tariffs on Chinese imports to 45%, a number cunningly lifted from the Smoot-Hawley playbook.
One of the counter-intuitive effects of the 1930’s tariff increase was price deflation, in part due to many tariffs being imposed on a per unit cost basis. Today, per unit tariffs apply to only around 8% of goods, added to which, due to monetary engineering, by central banks, and the issuance of fiat currency by governments, the threat of real deflation is less likely.
Another risk is that the Sino-US spat engulfs other countries. The EU (especially Germany) has already suffered the ire of the US President. Recent trade deals between the EU and both Canada and Japan, have been heralded as a triumph for free-trade, however, they are an echo of the trading blocs which formed during the 1930’s. To judge by Trump’s recent tweets, for the moment, China has been singled out, on 13th May the President said: –
“Also, the Tariffs can be completely avoided if you buy from a non-Tariffed Country, or you buy the product inside the USA (the best idea). That’s Zero Tariffs. Many Tariffed companies will be leaving China for Vietnam and other such countries in Asia. That’s why China wants to make a deal so badly!”
Even if the trade dispute remains a Sino-US affair, there are other unseen costs to consider, on productivity and investment, Bruegal – Implications of the escalating China-US trade dispute takes up the discussion (emphasis mine): –
The direct aggregate effect of the tariffs on the welfare of the US and Chinese, while negative, is likely to be very small… because they represent a transfer from consumers, importers and partner exporters to the government… sooner or later, the American consumer will bear much of the cost of the tariff though higher prices, but also that tariff revenue will return to American residents in some form. The negative aggregate welfare effect of tariffs thus arises because, at the margin, they displace more efficient producers by less efficient ones… because, at the margin, tariffs artificially reduce the consumption or use of imports in favour of domestic goods or goods imported from third parties…
The distributional effect of tariffs is likely to be very uneven and severely negative on some people and sectors… while the Treasury will see increased revenue, and some producers who compete with imports will gain, small companies that depend on imported parts from China are likely to be very badly affected by tariffs…
Larger importers will also be adversely affected… US farmers who depend on Chinese markets have already been badly hurt by Chinese retaliation…
The biggest adverse effects of tariffs on aggregate economic activity is through investment. Lower investment is the natural result of the tariffs’ big distributional effects… and the uncertainty they engender. This effect on ‘animal spirits’ is difficult to model and impossible to quantify with precision… The extraordinary sensitivity of stock markets to trade news and their volatility is just one manifestation of this effect. The widening growth gap between the global manufacturing and services sectors evident in recent quarters is another, as is the slowdown in investment in many countries.
Bruegal go on to discuss the risk to the international trading system and the damage to the credibility of the WTO. Finally they suggest that the trade dispute is a kind of proxy-war between the two super-powers: this is much more than just a trade dispute.
Putting the Sino-US dispute in an historical context, a number of commentators have drawn comparisons between China today and Japan in the 1980’s. I believe the situation is quite different, as will be the outcome. Again, I defer to Bruegal – Will China’s trade war with the US end like that of Japan in the 1980s? The author’s argue that Japan chose to challenge the US when it was close to its economic peak and its productivity was stagnating. China, by contrast, has a younger population, rapidly improving productivity and, most importantly, remains a significant way below its economic peak: –
…Because China is at an earlier stage of economic development, it is expected to challenge the US hegemony for an extended period of time. Therefore, the US-China trade war could last longer than the one with Japan. With China’s growth prospects still relatively solid – it will soon overtake the US economy in size and it does not depend on the US militarily – China will likely challenge US pressure in the ongoing negotiations for a settlement to the trade war. This also means that any deal will only be temporary, as the US will not be able to contain China as easily as it contained Japan.
If you are looking for a more global explanation of the current dispute between the US and China, then this article from CFR – The Global Trading System: What Went Wrong and How to Fix It is instructive: –
As economist Richard Baldwin lays out in his book The Great Convergence, the Industrial Revolution of the 19th century had launched Europe, the US, Japan and Canada on a trajectory that would see their wealth surge ahead of the rest of the world. In 1820, for example, incomes in the US were about three times those of China; by 1914 Americans would be 10 times as wealthy as Chinese. Manufacturing clustered in the technologically advanced countries, while advances in containerized shipping and the lowering of tariffs through trade negotiations made it possible for these countries to specialize and trade in the classic Ricardian fashion.
The information technology revolution of the 1990s turned that story upside down. With the advent of cheap, virtually instant global communications via the Internet, it became possible – and then imperative for competitive success – for multinational companies to take their best technologies and relocate production in lower-wage countries. Manufacturing output rose in middle-income countries like China, India, Thailand, Poland and others, while falling sharply in the US, Japan, France, the UK and even Germany…
The global great convergence, however, coincided with a great divergence within the wealthy countries (and many developing countries as well). The new technologies and the disappearance of trade barriers upended the balance between labor and capital in the advanced industrialized countries, and contributed to soaring economic inequality…
In the US in 1979, an American with a college degree or higher earned about 50% more than one who had only a high school education or less. By 2018, American workers with a four-year college degree earned almost twice as much as those with just a high-school education, and were unemployed half as often, while those with a professional degree earned nearly three times as much.
The author goes on to liken today’s tension between the US and China with the situation which existed between the UK and US at the beginning of the 20th century: –
The world today again faces the same governance gap – a US that no longer has the economic muscle nor the political will to organize the global system, and a rising China that is reluctant to play a greater role.
CFR ask what the prospects maybe for renewed globalization? They identify three key elements which need to be addressed in order for de-globalisation to be reversed: a trade war truce (once both sides wake up to the extent of the empasse they have engineered), a filling the Leadership Vacuum (caused by both sides turning their backs on the WTO – they need to reengage and lead the world towards a solution) and, especially for the US, meeting the challenges at home (Trump cannot rely on a trade war in the long-run to solve the problem of inequality within the US).
Conclusions and investment opportunities
What is the likely impact on financial markets? To answer this question one needs to know whether the current trade war will escalate or dissipate: and if it escalates, will it be short and sharp or protracted and pernicious?
Alisdair Macleod of Gold Money – Post-tariff considerations identifies the following factors: –
The effect of the new tariff increases on trade volumes
The effect on US consumer prices
The effect on US production costs of tariffs on imported Chinese components
The consequences of retaliatory action on US exports to China
The recessionary impact of all the above on GDP
The consequences for the US budget deficit, allowing for likely tariff income to the US Treasury
Leading, in MacLeod’s opinion, to: –
Reassessment of business plans in the light of market information
A tendency for bank credit to contract as banks anticipate heightened lending risk
Liquidation of financial assets held by banks as collateral
Foreign liquidation of USD assets and deposits
The government’s borrowing requirement increasing unexpectedly
Bond yields rising to discount increasing price inflation
Banks facing increasing difficulties and the re-emergence of systemic risk
The author suggests that, all other things equal, tariffs should lead to price increases, but, with the US consumer already heavily burdened with debt, consumption demand will suffer.
I am less bearish than MacLeod because, if the Sino-US trade war threatens to puncture the decade long equity bull-market, we will see a combination of qualitative and quantitative easing from the largest central banks and aggressive fiscal stimulus from the governments of G20 and beyond. I wrote about this scenario (though without reference to the trade war) earlier this month in Macro Letter – No 114 – 10-05-2019 – Debasing the Baseless – Modern Monetary Theory. My, perhaps overly simple, prediction for assets in the longer-term is: bonds up, stocks up and real estate up.
In an alternative scenario, we might encounter asset price deflation and consumer price inflation occurring simultaneously. Worse still, this destructive combination of forces might coinciding with a global recession. The severity of any recession – and the inevitable correction to financial markets that such an economic downturn would precipitate – will depend entirely on the time it takes for US and Chinese trade negotiators to realise the danger and reach a compromise. I believe they will do so relatively quickly.
Attempting to predict what President Trump might do next is fraught with danger, but, due to the inherent weakness of the democratic process, I expect the US administration to concede. The US President has an election to win in November 2020; the President of China has been elected for life.