How are Chinese stocks responding to tariffs with the US and a slowdown in Asian growth?

How are Chinese stocks responding to tariffs with the US and a slowdown in Asian growth?

In the Long Run - small colour logo

Macro Letter – No 104 – 09-11-2018

How are Chinese stocks responding to tariffs with the US and a slowdown in Asian growth?

  • Despite US tariffs, China’s September trade balance with the US reached a record high
  • A number of China’s Asian neighbours have seen a deceleration in growth
  • The Shanghai Composite has fallen more than 50% since 2015, the PE ratio is 7.2
  • Government bond yields have eased and the currency is lower against a rising US$

During 2018 Chinese financial markets have been on the move. 10yr bond yields rose from all-time lows throughout 2017 but have since declined: –

China bonds 2006-2018

Source: Trading Economics, PRC Ministry of Finance

Despite this easing of monetary conditions the negative impact US tariffs, continues to weigh on the Chinese stock market: –

China shanghai index 1990-2018

Source: Trading Economics, OTC, CFD

Despite being a leader in frontier technologies such as e-commerce (China has 733mln internet users compared with 391mln in India, 413mln in the EU and a mere 246mln in the US) the recent decline in tech giants Alibaba (BABA) and Tencent (TCEHY) have added to financial market woes. However, as the chart above shows, Chinese stocks have been in a bear-market since 2015. Some of its Asian neighbours have followed a similar trajectory as their economies have slowed in response to a US$ strength and US trade policy.

The notionally pegged Chinese currency has also weakened against the US$, testing it lowest levels in almost a decade: –

China currency 2008-2018

Source: Trading Economics

Meanwhile, President Xi has now announced plans to rebalance China’s economy towards consumption, turning it into an importing superpower. Surely something has to give.

The IMF expects Chinese GDP to grow at 6.6% in 2018. They continue to point to signs of economic progress: –

The country now accounts for one-third of global growth. Over 800 million people have been lifted out of poverty and the country has achieved upper middle-income status. China’s per capita GDP continues to converge to that of the United States, albeit at a more moderate pace in the last few years.

The authors go on to predict that the country may become the world’s largest economy by 2030. However, there are headwinds: –

Despite the sharp rebound in nominal GDP and industrial profits, total nonfinancial sector debt still rose significantly faster than nominal GDP growth in 2017. While the corporate debt to GDP ratio has stabilized, government and especially household debt is rising, driven by continued strong off-budget investment spending and a rapid increase in mortgage and consumer loans.

It is debt that concerns Carnegie Endowment’s Michael Pettis – Beijing’s Three Options: Unemployment, Debt, or Wealth Transfers – as the title suggests he envisages three paths to adjustment.

Raise investment. Beijing can engineer an increase in public-sector investment. In theory, private-sector investment can also be expanded, but in practice Chinese private-sector actors have been reluctant to increase investment, and it is hard to imagine that they would do so now in response to a forced contraction in China’s current account surplus.

Reduce savings by letting unemployment rise. Given that the contraction in China’s current account surplus is likely to be driven by a drop in exports, Beijing can allow unemployment to rise, which would automatically reduce the country’s savings rate.

Reduce savings by allowing debt to rise. Beijing can increase consumption by engineering a surge in consumer debt. A rising consumption share, of course, would mean a declining savings share.

Reduce savings by boosting Chinese household consumption. Beijing can boost the consumption share by increasing the share of GDP retained by ordinary Chinese households, those most likely to consume a large share of their increased income. Obviously, this would mean reducing the share of some low-consuming group—the rich, private businesses, state-owned enterprises (SOEs), or central or local governments.

Although fiscal stimulus appears to be rebounding it is a short-term solution. There have been many example of non-productive public investment: as a longer-term policy, this route is untenable: –

If Beijing does not rein in credit growth in time, it will be forced to do so once debt levels reach the point at which debt can no longer rise fast enough to maintain the country’s targeted economic growth rate. This adjustment can happen quickly, in the form of a debt crisis. Or (what I think is far more likely, at least for now) it can happen slowly, in the form of what is subsequently called a lost decade (or decades) of slow growth, similar to what Japan experienced after 1990.

Increased unemployment is a dangerous route to take, debt levels are already stretched, which leaves wealth transfers to the private sector.

A forced contraction in China’s current account surplus must be counteracted by either an increase in unemployment, an increase in the debt, or wealth transfers to Chines consumers (rather than savers).

Looking ahead Chinese growth is likely to slow. Here is Focus Economics – China Economic Outlook for October: –

China Economic Outlook

Available data suggests that economic growth decelerated in the third quarter, mainly due to lackluster infrastructure investment and negative spillovers from financial deleveraging. Surprisingly, export growth remained robust in Q3 despite the ongoing trade war between China and the United States. The September PMI survey, however, revealed that external demand is softening, which suggests export figures are likely to worsen in the next few months. In response, the government has reverted to old tactics, boosting lending and increasing fiscal stimulus. Although these initiatives are effective in supporting the economy in the short-term, they threaten the effort made in previous years to reshape the country’s economic model and allow the country to avoid the “middle income trap”.

China Economic Growth

Looking ahead, economic growth is expected to decelerate. This reflects China’s more mature economic cycle and the impact of previous economic reforms, as well as the tit-for-tat trade war with the United States and the cooling housing market. However, a looser fiscal stance and a more accommodative monetary policy should cushion the slowdown. FocusEconomics panelists see the economy growing 6.3% in 2019, which is unchanged from last month’s forecast. In 2020 the economy is seen expanding 6.1%.

Countering this view Peterson Economics – Who Thinks China’s Growth Is Slowing? Suggests that China may be holding up much better than imagined: –

A widespread consensus has developed around the view that China’s economic growth is slowing and that the leadership in Beijing will have no choice but to capitulate in the tariff war with President Donald Trump to avoid a further slowdown. Leading US news organizations (here and here) have sounded this theme as a kind of late summer siren song to lull people into thinking that Trump’s confrontational approach is bound to succeed at some point. The reality is that, as has been the case for the last few years, the case for China’s imminent economic difficulties is overblown.

The most widely cited piece of evidence for the new conventional wisdom, for example, is that fixed asset investment is slowing dramatically. Unfortunately, this assessment is based on a monthly data series released by China’s National Bureau of Statistics (NBS), which is currently revising the method used to calculate fixed asset investment. The method that was used so far involved considerable double counting, which the authorities are paring back. The slowing growth of this metric, thus, tells us nothing, and assessments based on existing data are no longer meaningful. 

There are three sources of growth in any economy: consumption, investment, and net exports. The problem is that data on China’s fixed asset investment, which include the value of sales of land and other assets, have increasingly overstated the expansion of the economy’s productive capacity.  Nonetheless, financial analysts and others have relied on this series because it is the only high-frequency data available on investment.  China’s data on gross domestic capital formation, which accurately measures the expansion of productive capacity, are available only on an annual basis and with a lag of five months.

According to NBS data, fixed asset investment grew by only 5.5 percent in the first seven months of 2018, the lowest in decades. In the first half of the year (January to June), fixed asset investment grew by 6 percent. But the price index for fixed asset investment rose by 5.7 percent, implying that real investment barely grew.  This, however, is inconsistent with the more reliable NBS data, which show the expansion of capital formation, properly measured, accounted for about one-third of the 6.8 percent of China’s GDP growth.

When the NBS releases final data for 2018 (probably in about nine months), we are likely to learn that the growth of capital formation, properly measured, exceeded the growth of fixed asset investment, just as it did in 2017.

The full article is in three parts – part 2 – taking a closer look at domestic consumption – is here and part 3 – charting the steady rise in imports – is here.

Conclusions and Investment Opportunities

According to analysis from Star Capital (28-9-2018) the PE ratio for Chinese Stocks was just 7.2 times – the second cheapest of the 40 stock markets they monitor – although its CAPE ratio was a more exalted 15.7. Since June 2015 the Shanghai Composite Index have fallen by 53%, peak to trough, whilst since January it has retraced 32% to its low last month. The downtrend has yet to reverse, but, as the second chart above shows, we are testing a support line taken from the lows of 2005 and 2014.

The Q2 2018 Monetary Policy Report the PBoC revealed a moderation in the rate of growth of loans to households to 18.8%, other areas of lending continue to expand rapidly. M2 growth has been steady at around 8%. I believe they will allow interest rates to remain unchanged at 4.35%, or reduce them should the need arise. Last month PBoC foreign exchange reserves fell slightly (-$34bln) but they remain above $3trln: enough to moderate the RMBs decline. China’s real broad effective exchange rate (trade-weighted) is still in a broad, multi-year uptrend due to its soft peg to the US$. Here is the chart since 2006: –

fredgraph (4)

Source: Federal Reserve Bank of St Louis

I expect China to reach a trade deal with the US within the next year. The recent slowdown in growth rate of debt formation by households will reverse: and the Shanghai Composite Index will form a base. The RMB may weaken further as the US continues to raise interest rates. Provided the US stock market maintains its nerve, an opportunity to buy Chinese stocks may emerge in the next few months. It may not yet be time to buy but there is little benefit in remaining short.

The risk of a correction in the equity bull market

In the Long Run - small colour logo

Macro Letter – No 89 – 19-01-2018

The risk of a correction in the equity bull market

  • Rising commodity prices, including oil, are feeding through to PPI
  • Unemployment data suggests wages may begin to rise faster
  • Federal Reserve tightening will continue, other Central Banks may follow
  • The bull market will be nine years old in March, the second longest in history

Since March 2009, the US stock market has been trending broadly higher. If we can continue to make new highs, or at least, not correct to the downside by more than 20%, until August of this year it will be the longest equity bull-market in US history.

The optimists continue to extrapolate from the unexpected strength of 2017 and predict another year of asset increases, but by many metrics the market is expensive and the risks of a significant correction are become more pronounced.

Equity volatility has been consistently low for the longest period in 60 years. Technical traders are, of course, long the market, but, due to the low level of the VIX, their stop-loss orders are unusually close the current market price. A small correction may trigger a violent flight to the safety of cash.

Meanwhile in Japan, after more than two decades of under-performance, the stock market has begun to play catch-up with its developed nation counterparts. Japanese stock valuation is not cheap, however, as the table below, which is sorted by the CAPE ratio, reveals:-

Star_Capital_-_Equity_Valuations_31-12-2017

Source: Star Capital

Global economic growth surprised on the upside last year. For the first time since the great financial crisis, it appears that the Central Bankers experiment in balance sheet expansion has spilt over into the real-economy.

An alternative explanation is provided in this article – Is Stimulus Responsible for the Recent Improved Trends in the U.S. and Japan? – by Dent Researchhere are some selected highlights:-

Since central banks began their B.S. back in 2001, when the Bank of Japan first began Quantitative Easing efforts, I’ve warned that it wouldn’t be enough… that none of them would be able to commit to the vast sums of money they’d ultimately need to prevent the Economic Winter Season – and its accompanying deflation – from rolling over us.

Demographics and numerous other cycles, in my studied opinion, would ultimately overwhelm central bank efforts…

Are such high levels of artificial stimulus more important than demographic trends in spending, workforce growth, and productivity, which clearly dominated in the real economy before QE? Is global stimulus finally taking hold and are we on the verge of 3% to 4% growth again?…Fundamentals should still mean something in our economy…

And my Generational Spending Wave (immigration-adjusted births on a 46-year lag), which predicted the unprecedented boom from 1983 to 2007, as well as Japan’s longer-term crash of the 1990s forward, does point to improving trends in 2016 and 2017 assuming the peak spending has edged to 47 up for the Gen-Xers.

The declining births of the Gen-X generation (1962 – 1975) caused the slowdown in growth from 2008 forward after the Baby Boom peaked in late 2007, right on cue. But there was a brief, sharp surge in Gen-X births in 1969 and 1970. Forty-seven years later, there was a bump… right in 2016/17…

US Gets Short-lived - Dent Research

Source: Dent Research

The next wave down bottoms between 2020 and 2022 and doesn’t turn up strongly until 2025. The worst year of demographic decline should be 2019.

Japan has had a similar, albeit larger, surge in demographics against a longer-term downtrend.

Its Millennial generation brought an end to its demographic decline in spending in 2003. But the trends didn’t turn up more strongly until 2014, and now that they have, it’ll only last through 2020 before turning down dramatically again for decades…

Japan Gets Millennial Surge - Dent Research

Source: Dent Research

Prime Minister Abe is being credited with turning around Japan with his extreme acceleration in QE and his “three arrows” back in 2013. All that certainly would have an impact, but I don’t believe that’s what is most responsible for the improving trends. Rather, demographics is the key here as well, and this blip Japan is enjoying won’t last for more than three years!..

If demographics does still matter more, we should start to feel the power of demographics in the U.S. as we move into 2018.

If our economy starts to weaken for no obvious reason, and despite the new tax reform free lunch, then we will know that demographics still matter…

A different view of the risks facing equity investors in 2018 is provided by Louis-Vincent Gave of Gavekal, care of Mauldin Economics – Questions for the Coming Yearhe begins with Bitcoin:

…a recent Bloomberg article noted that 40% of bitcoins are owned by around 1,000 or so individuals who mostly reside in the greater San Francisco Bay area (the early adopters). Sitting in Asia, it feels as if at least another 40% must be Chinese investors (looking to skirt capital controls), and Korean and Japanese momentum traders. After all, the general rule of thumb in Asia is that when things go up, investors should buy more.

Asia’s fondness for chasing rising asset prices means that it tends to have the best bubbles. To this day, nothing has topped the late 1980s Taiwanese bubble, although perhaps, left to its own devices, the bitcoin bubble may take on a truly Asian flavor and outstrip them all? Already in Japan, some 1mn individuals are thought to day-trade bitcoins, while 300,000 shops reportedly have the capacity to accept them for payment. In South Korea, which accounts for about 20% of daily volume in bitcoin and has three of the largest exchanges, bitcoin futures have now been banned. For its part, Korea’s justice ministry is considering legislation that would ban payments in bitcoin all together.

At the very least, it sounds like the Bank of Korea’s recent 25bp interest rate hike was not enough to tame Korean animal spirits. So will the unfolding bitcoin bubble trigger a change of policy from the BoK and, much more importantly, from the Bank of Japan in 2018?

 Mr Gave then goes on to highlight the risks he perceives as under-priced for 2018, starting with the Bank of Japan:-

In recent years, the BoJ has been the most aggressive central bank, causing government bond yields to stay anchored close to zero across the curve, while acting as a “buyer of last resort” for equities by scooping up roughly three quarters of Japanese ETF shares. Yet, while equities have loved this intervention, Japanese insurers and banks have had a tougher time. Indeed, a chorus of voices is now calling for the BoJ to let the long end of the yield curve rise, if only to stop regional banks hitting the wall.

Japanese_banks_in_the_wars_-_Gavekal

Source: Gavekal/Macrobond

So could the BoJ tighten monetary policy in 2018? This may be more of an open question than the market assumes. Indeed, the “short yen” trade is popular on the premise that the BoJ will be the last central bank to stop quantitative easing. But what if this isn’t the case?

The author then switches to highlight the pros and cons. It’s the cons which interest me:-

  • PPI is around 3%
  • The banks need a steeper yield curve to survive
  • The trade surplus is positive once again
  • The US administration has been pressuring Japan to encourage the Yen to rise

I doubt the risk of BoJ tightening is very great – they made the mistake of tightening too early on previous occasions to their cost. In any case, raising short-term rates will more likely lead to a yield curve inversion making the banks position even worse. The trade surplus remains small and the Yen remains remarkably strong by long-term comparisons.

This brings us to the author’s next key risk (which, given Gavekal’s deflationist credentials, is all the more remarkable) that inflation will surprise on the upside:-

Migrant workers are no longer pouring into Chinese cities. With about 60% of China’s citizens now living in urban areas, urbanization growth was always bound to slow. Combine that with China’s aging population and the fact that a rising share of rural residents are over 40 (and so less likely to move), and it seems clear that the deflationary pressure arising from China’s urban migration is set to abate.

 Reduced excess capacity in China is real: from restrictions on coal mines, to the shuttering of shipyards and steel mills, Xi Jinping’s supply-side reforms have bitten. At the very least, some 10mn industrial workers have lost their jobs since Xi’s took office (note: there are roughly 12.5m manufacturing workers in the US today!).

Chinas_decelerating_urbanisation_-_Gavekal

Source: Gavekal/Macrobond

Total_labor_market_in_China_-_Gavekal

Source: Gavekal/Macrobond

To say that most “excess investment” China unleashed with its 2015-16 monetary and regulatory policy stimulus went into domestic real estate is only a mild exaggeration. Very little went into manufacturing capacity, which may explain why the price of goods exports from China has, after a five-year period, shown signs of breaking out on the upside. Another part of the puzzle is that Chinese producer prices are also rising, so it is perhaps not surprising that export prices have followed suit. The point is, if China’s export prices do rise in a concerted manner, it will happen when inflation data in the likes of Japan, the US and Germany are moving northward…

China_PPI_-_Gavekal

Source: Gavekal/Macrobond

Global_Inflation_-_Gavekal

Source: Gavekal/Macrobond

…The real reason I worry about inflation today is that inflation has the potential to seriously disrupt the happy policy status quo that has underpinned markets since the February 2016 Shanghai G20 meeting.

Mr Gave recalls the Plaza and Louvre accords of 1985 and ‘87, reminding us that the subsequent rise in bond yields in the summer of 1987 brought the 1980’s stock market bubble to an abrupt halt.

…for the past 18 months, I have espoused the idea that, after a big rise in foreign exchange uncertainty – triggered mostly by China with its summer 2015 devaluation, but also by Japan and its talk of helicopter money, and by the violent devaluation of the euro that followed the eurozone crisis – the big financial powers acted to calm foreign exchange markets after the February 2016 meeting of the G20 in Shanghai.

…as in the post-Louvre accord quarters, risk assets have broadly rallied hard. It’s all felt wonderful, if not quite as care-free as the mid-1980s. And as long as we live under this Shanghai accord, perhaps we should not look a gift horse in the mouth and continue to pile on risk?

This brings me to the nagging worry of “what if the Shanghai agreement comes to a brutal end as in 1987?”

Again the author is at pains to point out that, for the bubble to burst an inflation hawk is required. A Central Bank needs to assume the mantle of the Bundesbank of yesteryear. He anticipates it will be the PBoC:-

…(let’s face it: the last two upswings in global growth, namely 2009 and 2016, were triggered by China more than the US). Indeed, the People’s Bank of China may well be the new Bundesbank for the simple reason that most technocrats roaming the halls of power in Beijing were brought up in the Marxist church. And the first tenet of the Marxist faith is that historical events are shaped by economic forces, with inflation being the most powerful of these. From Marx’s perspective, Louis XVI would have kept his head, and his throne, had it not been for rapid food price inflation the years that preceded the French Revolution. And for a Chinese technocrat, the Tiananmen uprising of 1989 only happened because food price inflation was running at above 20%. For this reason, the one central bank that can be counted on to be decently hawkish against rising inflation, or at least more hawkish then others, is the PBoC.

Mr Gave foresees inflation delivering a potential a triple punch; lower valuations for asset markets, followed by tighter monetary and fiscal policy in China, which will then trigger an incendiary end to the unofficial ‘Shanghai Agreement’. In 1987 it was German Bunds which offered the safe haven, short-dated RMB bonds may be their counterpart in the ensuing crisis.

This brings our author to the vexed question of the way in which the Federal Reserve will respond. The consensus view is that it will be business as usual after the handover from Yellen to Powell, but what if it’s not?

…imagine a parallel universe, such that within a few months of being sworn in, Powell faces a US economy where:-

Unemployment is close to record lows and government debt stands at record highs, yet the federal government embarks on an oddly timed fiscal stimulus through across-the-board tax cuts.

Shortly afterwards, the government further compounds this stimulus with a large infrastructure spending bill.

As inflationary pressures intensify around the world (partly due to this US stimulus), the PBoC, BoJ and ECB adopt more hawkish positions than have been discounted by the market.

The unexpected tightening by non-US central banks leads other currencies higher, and the US dollar lower.

The combination of low interest rates, expansionary fiscal policy and a weaker dollar causes the US economy to properly overheat, forcing the Fed to tighten more aggressively than expected.

Gave proposes four scenarios:-

  1. More of the same – along the lines of the current forecasts and ‘dot-plot’
  2. A huge US fiscal stimulus forcing more aggressive tightening
  3. An unexpected ‘shock’ either economic or geopolitical, leading to renewed QE
  4. The Fed tightens but inflation accelerates and the rest of the world’s Central Banks tighten more than expected

…In the first two scenarios, the US dollar will likely rise, either a little, or a lot. In the latter two scenarios, the dollar would likely be very weak. So if this analysis is broadly correct, shorting the dollar should be a good “tail risk” policy. If the global economy rolls over and/or a shock appears, the dollar will weaken. And if global nominal GDP growth accelerates further from here, the dollar will also likely weaken. Being long the dollar is a bet that the current investment environment is sustained.

The final risk which the author assesses is the impact of rising oil prices. It has often been said that a rise in the price of oil is a tax on consumption. Louis-Vincent Gave gives us an excellent worked example:-

assume that the world consumes 100mn barrels of oil a day…Then further assume that about 100 days of inventory is kept “in the system”… if the price of oil is US$60/bbl, then oil inventories will immobilize around US$600bn in working capital. But if the price drops to US$40/bbl, then the working capital needs of the broader energy industry drops by US$200bn.

The chart below shows the decline in true money supply:-

Excess_liquidity_is_slowing_-_Gavekal

Source: Gavekal/Macrobond

The Baker Hughes US oil rig count jumped last week from 742 to 752 but it is still below the highs of last August and far below the 1609 count of October 2014. The break-even oil price for US producers is shown in the chart below:-

Oil_Breakevens_-_Geopolitical_Futures

Source: Geopolitical Futures

If the global price of oil were entirely dependent on the marginal US producer, there would be little need to worry but the World Rig Count has also been slow to respond and Non-US producers are unable to bring additional rigs on-line as quickly, in response to price rises, as their US counterparts:-

Baker_Hughes_World_Rig_Count_10_years

Source: Baker Hughes

An additional concern for the oil price is the lack of capital investment over recent years. Many of the recent fracking wells in the US are depleting more rapidly. This once dynamic sector may have become less capable of reacting to the recent price increase. I’m not convinced, but a structurally higher oil price is a risk to consider.

Conclusion and investment opportunities

As Keynes famously said, ‘The markets can remain irrational longer than I can remain solvent.’ Global equity markets have commenced the year with gusto, but, after the second longest bull-market in history, it makes sense to be cautious. Growth stocks and Index tracking funds were the poster children of 2017. This year a more defensive approach is warranted, if only on the basis that lightening seldom strikes twice in the same place. Inflation may not become broad-based but industrial metals prices and freight rates have been rising since 2016. Oil has now broken out on the upside, monetary tightening and balance sheet reduction as the watch words of the leading Central Banks – even if most have failed to act thus far – these actions compel one to tread carefully.

A traditional value-based approach to stocks should be adopted. Japan may continue to play catch up with its developed nation peers – the demographic up-tick, mentioned by Dent research, suggests that the recent breakout may be sustained. The Federal Reserve is leading the reversal of the QE experiment, so the US stock market is probably most vulnerable, but the high correlations between global stock markets means that, if the US stock market catches a cold, the rest of the world is unlikely to avoid infection.

High-yield bonds have been the alternative to stocks for investors seeking income for several years. Direct lending and Private Debt funds have raised a record amount of assets in the past couple of years. If the stock market declines, credit spreads will widen and liquidity will diminish. In the US, short dated government bond yields have been rising steadily and yield curves have been flattening, nonetheless, high grade floating rate notes and T-Bills may be the only place to hide, especially if inflation should rise even as stocks collapse.

There will be a major stock market correction at some point, there always is. When, is still in doubt, but we are nearer the end of the bull-market than the beginning. Technical analysis suggests that one must remain long, but in the current low volatility environment it makes sense to use a trailing stop-loss to manage the potential downside risk. Many traders are adopting a similar strategy and the exit will be crowded when you reach the door. Expect slippage on your stop-loss, it’s a price worth paying to capture the second longest bull-market in history.


China – leading indicator? Stocks, credit policy, rebalancing and money supply

China – leading indicator? Stocks, credit policy, rebalancing and money supply

In the Long Run - small colour logo

Macro Letter – No 88 – 08-12-2017

China – leading indicator? Stocks, credit policy, rebalancing and money supply

  • Chinese bond yields have reached their highest since October 2014
  • Chinese stocks have corrected despite the US market making new highs
  • The PBoC has introduced targeted lending to SMEs and agricultural borrowers
  • Money supply growth is below target and continues to moderate

Chinese 10yr bond yields have been rising steadily since October 2016. They never reached the low or negative levels of Japan or Germany. 1yr bonds bottomed earlier at 1.76% in June 2015 having tested 1% back in 2009.

The pattern and path of Chinese rates is quite different from that of US Treasuries. Last month rates increased to their highest since 2014 and the Shanghai Composite index finally appears to have taken notice. The divergence, however, between Shanghai stocks and those of the US is worth investigating more closely.

The chart below shows the yield on 10yr Chinese Government Bonds since 2007 (LHS) and the 3 month inter-bank deposit rate over the same period (RHS):-

china 10yr vs 3 m interbank - 10yr

Source: Trading Economics

From a recent peak in 2014, yields declined steadily until October 2016, since when they have begun to rise quite sharply.

The next chart shows the change in yield of Government bonds and AAA Corporate bonds across the entire yeild curve:-

China_Government_vs_Corp_AAA_Yield_Curve

Source: PBoC

The dates I chose were 29th September – the day before the People’s Bank of China (PBoC) announced their targeted lending plan. The 22nd November – the day before the Shanghai index reversed and 6th December – bringing the data set up to date.

The general observation is simply that yields have risen across the maturity spectrum, but the next chart, showing the change in the spread between government and corporate paper reveals some additional nuances:-

China_Government_vs_AAA_Corp_Spread

Source: PBoC

Spreads have generally widened as monetary conditions have tightened. The widening has been most pronounced in the 30yr maturity. The widening of credit spreads may be driven by the prospect of $1trln of corporate debt which is due to mature between now and 2019.

Another factor may be the change in policy announced by the PBoC on September 30th. Bloomberg – China’s Central Bank Unveils Targeted Lending Plan to Aid Growth provides an excellent overview:-

Banks will enjoy 0.5 percentage point RRR cut if eligible lending exceeds 1.5 percent or more of their new lending in 2017

Deduction will be 1.5 percentage point if eligible lending reaches 10 percent or more of new lending in 2017, or if “inclusive finance” loans take up 10 percent of total outstanding loans in 2017

Rural commercial banks who meet an earlier requirement that at least 10 percent of new lending is local can receive a 1 percentage point reduction

The RRR is the Reserve Requirement Ratio. This is a targeted easing of lending requirements aimed at directing credit to small and medium sized enterprises (SMEs) rather than state owned enterprises (SOEs) and encouraging lending to the agricultural sector. It also favour banks over the shadow banking sector. This policy shift was a rapid response to a trend which has been evident this year. Whilst credit continues to expand the percentage of credit directed to SMEs dropped from 50% in 2016 to 30% in 2017 – this policy aims to rebalance the supply of credit.

Despite expectations that the first half of 2017 would be strongest, the Chinese economy continues to grow above official forecasts, Q3 GDP came in at 6.8%. M2 money supply growth, by contrast, was only 8.8% in October versus 9.2% in September. The chart below shows the declining pattern over the past five years:-

China_M2_Money_Supply_5yr_growth_rate_CEIC

Source: CEIC, PBoC

8.8% M2 growth still looks high when compared with the US (6%) the EU (5.1%) or Japan (3.9%) but with GDP increasing by 6.8% it does not look excessive. It is worth noting, however, that the PBoC target for M2 growth in 2017 is 12% down from 13% in 2016.

What impact has this had on stocks? Not much, so far, is the answer:-

Shanghai Index - 5yr

Source: Trading Economics, Shanghai SE

Chinese stocks, as I have mentioned previously, do not look excessively expensive by several measures, however, this is not to suggest that they will not fall. According to Star Capital, at the end of September the PE ratio for China was 7.6 but the CAPE ratio was a much higher 17.3. The Dividend yield (3.9%) offers some comfort nonetheless.

Conclusions and Investment Opportunities

Chinese economic growth remains spectacular but the authorities are interested in promoting inclusive growth rather than encouraging individual speculation. Official interest rates have been 4.35% since October 2015, which is the lowest they have ever been, however, the reverse repo rate was increased in January from 2.25% to 2.45% and the standing loan facility rate increased in March from 3.1% to 3.3%. The bond market expects this mild tightening bias to continue. Meanwhile, inflation, which was 1.9%, up from 0.8% in February, is hardly cause for concern.

Chinese stocks can be divided into SOEs and Non-SOEs. Since the beginning of 2017 the sectors have diverged sharply, as this chart of the WisdomTree China ex-State-Owned Enterprises Fund (CXSE) versus the MSCI China Index (NDEUCHF), indicates:-

Wisdomtree_ex-SOE_ETF_vs_MSCI_China_YTD

Source: WisdomTree, MSCI

Even since the end of November, when stocks fell abruptly, the outperformance of, what some are calling new-China, has been maintained. This is not to suggest that PBoC policy is deliberately designed to support the new-China economy, but when the interests of the Chinese people and that of enterprises align it can be a winning combination.

It is still too soon to predict the end of the rise in Chinese stocks, the authorities, however, are determined not to allow a repeat of the speculative bubble of 2015. The combination of a continued decline in the pace of money supply growth and higher bond yields, may see Chinese stocks decline in response to monetary tightening before those of developed nation countries. Chinese stocks trade differently to those listed in more open markets, nonetheless, the importance of China should not be underestimated: it might even be the leading indicator for world markets.

Central Bank balance sheet adjustment – a path to enlightenment?

400dpiLogo

Macro Letter – No 79 – 16-6-2017

Central Bank balance sheet adjustment – a path to enlightenment?

  • The balance sheets of the big four Central Banks reached $18.4trln last month
  • The Federal Reserve will commence balance sheet adjustment later this year
  • The PBoC has been in the vanguard, its experience since 2015 has been mixed
  • Data for the UK suggests an exit from QE need not precipitate a stock market crash

The Federal Reserve (Fed) is about to embark on a reversal of the Quantitative Easing (QE) which it first began in November 2008. Here is the 14th June Federal Reserve Press Release – FOMC issues addendum to the Policy Normalization Principles and Plans. This is the important part:-

For payments of principal that the Federal Reserve receives from maturing Treasury securities, the Committee anticipates that the cap will be $6 billion per month initially and will increase in steps of $6 billion at three-month intervals over 12 months until it reaches $30 billion per month.

For payments of principal that the Federal Reserve receives from its holdings of agency debt and mortgage-backed securities, the Committee anticipates that the cap will be $4 billion per month initially and will increase in steps of $4 billion at three-month intervals over 12 months until it reaches $20 billion per month.

The Committee also anticipates that the caps will remain in place once they reach their respective maximums so that the Federal Reserve’s securities holdings will continue to decline in a gradual and predictable manner until the Committee judges that the Federal Reserve is holding no more securities than necessary to implement monetary policy efficiently and effectively.

On the basis of their press release, the Fed balance sheet will shrink until it is nearer $2.5trln versus $4.4trln today. If they stick to their schedule that should take until the end of 2021.

The Fed is likely to be followed by the other major Central Banks (CBs) in due course. Their combined deleveraging is unlikely to go unnoticed in financial markets. What are the likely implications for bonds and stocks?

To begin here are a series of charts which tell the story of the Central Bankers’ response to the Great Recession:-

Central_Bank_Balance_Sheets_-_Yardeni_May_2017

 Source: Yardeni Research, Haver Analytics

Since 2008 the balance sheets of the four major CBs have grown from around $6.5trln to $18.4trln. In the case of the People’s Bank of China (PBoC), a reduction began in 2015. This took the form of a decline in its foreign exchange reserves in order to support the weakening RMB exchange rate against the US$. The next chart shows the path of Chinese FX reserves and the Shanghai Stock index since the beginning of 2014. Lagged response or coincidence? Your call:-

China FX reserves and stocks 2014 - 2017

Source: Trading Economics

At a global level, the PBoC balance sheet reduction has been more than offset by the expansion of the balance sheets of the Bank of Japan (BoJ) and European Central Bank (ECB), however, a synchronous balance sheet contraction by all the major CBs is likely to be of considerable concern to financial market participants globally.

An historical perspective

Have CB balance sheets ever been as large as they are today? Indeed they have. The chart below which terminates in 2011, shows the evolution of the Fed balance sheet since its inception in 1913:-

Federal_Reserve_Balance_Sheet_-_History_-_St_Louis

Source: Federal Reserve, Haver Analytics

The increase in the size of the Fed balance sheet during the period of the Great Depression and WWII was related to a number of factors including: gold inflows, what Friedman and Schwartz termed “precautionary demand” for reserves by commercial banks, lack of alternative assets, changes in reserve requirements, expansion of income and war financing.

For a detailed review of all these factors, this paper from 2016 – How was the Quantitative Easing Program of the 1930s Unwound? By Matthew Jaremski and Gabriel Mathy – makes fascinating reading, here’s the abstract:-

Outside of the recent past, excess reserves have only concerned policymakers in one other period: The Great Depression of the 1930s. This historical episode thus provides the only guidance about the Fed’s current predicament of how to unwind from the extensive Quantitative Easing program. Excess reserves in the 1930s were never actively unwound through a reduction in the monetary base. Nominal economic growth swelled required reserves while an exogenous reduction in monetary gold inflows due to war embargoes in Europe allowed banks to naturally reduce their excess reserves. Excess reserves fell rapidly in 1941 and would have unwound fully even without the entry of the United States into World War II. As such, policy tightening was at no point necessary and likely was even responsible for the 1937-1938 recession.

During the period from April 1937 to April 1938 the Dow Jones Industrial Average fell from 194 to 100. Monetarists, such as Friedman, blamed the recession on a tightening of money supply in 1936 and 1937. I don’t believe Friedman’s censure is lost on the FOMC today: past Fed Chair, Ben Bernanke, is regarded as one of the world’s leading authorities on the causes and policy errors of the Great Depression.

But is the size of a CB balance sheet a determinant of the direction of the stock market? A richer data set is to be found care of the Bank of England (BoE). They provide balance sheet data going back to 1694, although the chart below, care of FRED, starts in 1701:-

BoE_Balance_Sheet_to_GDP_since_1701_-_BoE_and_FRED

Source: Federal Reserve, Bank of England

The BoE really only became a CB, in the sense we might recognise today, as a result of the Banking Act of 1844 which granted it a monopoly on the issuance of bank notes. The chart below shows the performance of the FT-All Share Index since 1700 (please ignore the reference to the Pontifical change, this was the only chart, offering a sufficiently long history, which I was able to discover in the public domain):-

UK-equities-1700-2012 Stockmarket Almanac

Source: The Stock Almanac

The first crisis to test the Bank’s resolve was the panic of 1857. During this period the UK stock market barely changed whilst the BoE balance sheet expanded by 21% between 1857 and 1859 to reach 10.5% of GDP: one might, however, argue that its actions were supportive.

The next crisis, the recession of 1867, was precipitated by the end of the American Civil War and, of more importance to the financial system, the demise of Overund and Gurney, “the Bankers Bank”, which was declared insolvent in 1866. Perhaps surprisingly, the stock market remained relatively calm and the BoE balance sheet expanded at a more modest 20% over the two years to 1858.

Financial markets became a little more interconnected during the Panic of 1873. This commenced with the “Gründerzeit” or “Founders” crash on the Vienna Stock Exchange. It sent shockwaves around the world. The UK stock market declined by 31% between 1873 and 1878. The BoE may have exacerbated the decline, its balance sheet contracted by 14% between 1873 and 1875. Thereafter the trend reversed, with an expansion of 30% over the next four years.

I am doubtful about the BoE balance sheet contraction between 1873 and 1875 being a policy mistake. 1873 was in fact the beginning of the period known as the Long Depression. It lasted until 1896. Nine years before the end of this 20 year depression the stock market bottomed (1887). It then rose by 74% over the next 11 years.

The First World War saw the stock market decline, reaching its low in 1917. From juncture it rallied, entirely ignoring the post-war recession of 1919 to 1921. Its momentum was only curtailed by the Great Crash of 1929 and subsequent Great Depression of 1930-1931.

Part of the blame for the severity of the Great Depression may be levelled at the BoE, its balance sheet expanded by 77% between 1928 and 1929. It then remained relatively stable despite Sterling’s departure from the Gold Standard in 1931 and only began to expand again in 1933 and 1934. Its balance sheet as a percentage of GDP was by this time at its highest since 1844, due to the decline in GDP rather than any determined effort to expand the balance sheet on the part of the Old Lady of Threadneedle Street. At the end of 1929 its balance sheet stood at £537mln, by the end of 1934 it had reached £630mln, an increase of just 17% over five traumatic years. The UK stock market, which had bottomed in 1931 – the level it had last traded in 1867 – proceeded to rally for the next five years.

Adjustment without tightening

History, on the basis of the data above, is ambivalent about the impact the size of a CB’s balance sheet has on the financial markets. It is but one of the factors which influences monetary conditions, the others are the availability of credit and its price.

George Selgin described the Fed’s situation clearly in a post earlier this year for The Cato Institute – On Shrinking the Fed’s Balance Sheet. He begins by looking at the Fed pre-2008:-

…the Fed got by with what now seems like a modest-sized balance sheet, the liabilities of which consisted mainly of circulating Federal Reserve notes, supplemented by Treasury and GSE deposit balances and by bank reserve balances only slightly greater than the small amounts needed to meet banks’ legal reserve requirements. Because banks held few excess reserves, it took only modest adjustments to the size of the Fed’s balance sheet, achieved by means of open-market purchases or sales of short-term Treasury securities, to make credit more or less scarce, and thereby achieve the Fed’s immediate policy objectives. Specifically, by altering the supply of bank reserves, the Fed could  influence the federal funds rate — the rate banks paid other banks to borrow reserves overnight — and so keep that rate on target.

Then comes the era of QE – the sea-change into something rich and strange. The purchase of long-term Treasuries and Mortgage Backed Securities is funded using the excess reserves of the commercial banks which are held with the Fed. As Selgin points out this means the Fed can no longer use the federal funds rate to influence short-term interest rates (the emphasis is mine):-

So how does the Fed control credit now? Instead of increasing or reducing the availability of credit by adding to or subtracting from the supply of Fed deposit balances, the Fed now loosens or tightens credit by controlling financial institutions’ demand for such balances using a pair of new monetary control devices. By paying interest on excess reserves (IOER), the Fed rewards banks for keeping balances beyond what they need to meet their legal requirements; and by making overnight reverse repurchase agreements (ON-RRP) with various GSEs and money-market funds, it gets those institutions to lend funds to it.

Between them the IOER rate and the implicit ON-RRP rate define the upper and lower limits, respectively, of an effective federal funds rate target “range,” because most of the limited trading that now goes on in the federal funds market consists of overnight lending by GSEs (and the Federal Home Loan Banks especially), which are not eligible for IOER, to ordinary banks, which are. By raising its administered rates, the Fed encourages other financial institutions to maintain larger balances with it, instead of trading those balances for other interest-earning assets. Monetary tightening thus takes the form of a reduced money multiplier, rather than a reduced monetary base.

Selgin goes on to describe this as Confiscatory Credit Control:-

…Because instead of limiting the overall availability of credit like it did in the past, the Fed now limits the credit available to other prospective borrowers by grabbing more for itself, which it then passes on to the U.S. Treasury and to housing agencies whose securities it purchases.

The good news is that the Fed can adjust its balance sheet with relative ease (emphasis mine):-

It’s only because the Fed has been paying IOER at rates exceeding those on many Treasury securities, and on short-term Treasury securities especially, that banks (especially large domestic and foreign banks) have chosen to hoard reserves. Even today, despite rate increases, the IOER rate of 75 basis points exceeds yields on most Treasury bills.  Were it not for this difference, banks would trade their excess reserves for Treasury securities, causing unwanted Fed balances to be passed around like so many hot-potatoes, and creating new bank deposits in the process. Because more deposits means more required reserves, banks would eventually have no excess reserves to dispose of.

Phasing out ON-RRP, on the other hand, would eliminate the artificial boost that program has been giving to non-bank financial institutions’ demand for Fed balances.

Because phasing out ON-RRP makes more reserves available to banks, while reducing IOER rates reduces banks’ own demand for such reserves, both policies are expansionary. They don’t alter the total supply of Fed balances. Instead they serve to raise the money multiplier by adding to banks’ capacity and willingness to expand their own balance sheets by acquiring non-reserve assets. But this expansionary result is a feature, not a bug: as former Fed Vice Chairman Alan Blinder observed in December 2013, the greater the money multiplier, the more the Fed can shrink its balance sheet without over-tightening. In principle, so long as it sells enough securities, the Fed can reduce its ON-RRP and IOER rates, relative to prevailing market rates, without missing its ultimate policy targets.

Selgin expands, suggesting that if the Fed decide to announce a fixed schedule for adjustment (which they have) then they may employ another tool from their armoury, the Term Deposit Facility:-

…to the extent that the Fed’s gradual asset sales fail to adequately compensate for a multiplier revival brought about by its scaling-back of ON-RRP and IOER, the Fed can take up the slack by sufficiently raising the return on its Term Deposits.

And the Fed’s federal funds rate target? What happens to that? In the first place, as the Fed scales back on ON-RRP and IOER, by allowing the rates paid through these arrangements to decline relative to short-term Treasury rates, its administered rates will become increasingly irrelevant. The same changes, together with concurrent assets sales, will make the effective federal funds rate more relevant, by reducing banks’ excess reserves and increasing overnight borrowing. While the changes are ongoing, the Fed would continue to post administered rates; but it could also revive its pre-crisis practice of announcing a single-valued effective funds rate target. In time, the latter target could once again be more-or-less precisely met, making it unnecessary for the Fed to continue referring to any target range.

With unemployment falling and economic growth steady the Fed are expected to tighten monetary policy further but the balance sheet adjustment needs to be handled carefully, conditions may look benign but the Fed ultimately holds more of the nation’s deposits than at any time since the end of WWII. Bank lending (last at 1.6%) is anaemic at best, as the chart below makes clear:-

Commercial_Bank_Loan_Creation_US

Source: Federal Reserve, Zero Hedge

The global perspective

The implications of balance sheet adjustment for the US have been discussed in detail but what about the rest of the world? In an FT Article – The end of global QE is fast approaching – Gavyn Davies of Fulcrum Asset Management makes some projections. He sees global QE reaching a plateau next year and then beginning to recede, his estimate for the Fed adjustment is slightly lower than the schedule announced last Wednesday:-

Fulcrum_Projections_for_tapering

Source: FT, Fulcrum Asset Management

He then looks at the previous liquidity injections relative to GDP – don’t forget 2009 saw the world growth decline by -0.8%:-

Fulcrum CB Liquidity Injections - March 2017 forecast

Source: IMF, National Data, Haver Analytics, Fulcrum Asset Management

It is worth noting that the contraction of Emerging Market CB liquidity during 2016 was principally due to the PBoc reducing their foreign exchange reserves. The ECB reduction of 2013 – 2015 looks like a policy mistake which they are now at pains to rectify.

Finally Davies looks at the breakdown by institution. The BoJ continues to expand its balance sheet, rising above 100% of GDP, whilst eventually the ECB begins to adjust as it breaches 40%:-

Fulcrum Estimates of CB Balance sheets - March 2017 

Source: Haver Analytics, Fulcrum Asset Management

I am not as confident as Davies about the ECB’s ability to reverse QE. They were never able to implement a European equivalent of the US Emergency Economic Stabilization Act of 2008, which incorporated the Troubled Asset Relief Program – TARP and the bailout of Fannie Mae and Freddie Mac. Europe’s banking system remains inherently fragile.

ProPublica – Bailout Costs – gives a breakdown of cost of the US bailout. The policies have proved reasonable successful and at little cost the US tax payer. Since initiation in 2008 outflows have totalled $623.4bln whilst the inflows amount to $708.4bln: a net profit to the US government of $84.9bln. Of course, with $455bln of troubled assets still outstanding, there is still room for disappointment.

The effect of TARP was to unencumber commercial banks. Freed of their NPL’s they were able to provide new credit to the real economy once more. European banks remain saddled with an abundance of NPL’s; her governments have been unable to agree on a path to enlightenment.

Conclusions and Investment Opportunities

The chart below shows a selection of CB balance sheets as a percentage of GDP. It is up to the end of 2016:-

centralbankbalancesheetgdpratios

SNB: Swiss National Bank, BoC: Bank of Canada, CBC: Central Bank of Taiwan, Riksbank: Swedish National Bank

Source: National Inflation Association

The BoJ has since then expanded its balance sheet to 95.5% and the ECB, to 32%. With the Chinese economy still expanding (6.9% March 2017) the PBoC has seen its ratio fall to 45.4%.

More important than the sheer scale of CB balance sheets, the global expansion has changed the way the world economy works. Combined CB balance sheets ($22trln) equal 21.5% of global GDP ($102.4trln). The assets held are predominantly government and agency bonds. The capital raised by these governments is then invested primarily in the public sector. The private sector has been progressively crowded out of the world economy ever since 2008.

In some ways this crowding out of the private sector is similar to the impact of the New Deal era of 1930’s America. The private sector needs to regain pre-eminence but the transition is likely to be slow and uneven. The tide may be about to turn but the chance for policy mistakes, as flows reverse, is extremely high.

For stock markets the transition to QT – quantitative tightening – may be neutral but the risks are on the downside. For government bond markets there are similar concerns: who will buy the bonds the CBs need to sell? If interest rates normalise will governments be forced to tighten their belts? Will the private sector be in a position to fill the vacuum created by reduced public spending, if they do?

There is an additional risk. Yield curve flattening. Banks borrow short and lend long. When yield curves are positively sloped they can quickly recapitalise their balance sheets: when yield curves are flat, or worse still inverted, they cannot. Increases in reserve requirements have made government bonds much more attractive to hold than other securities or loans. The Commercial Bank Loan Creation chart above may be seen as a warning signal. The mechanism by which CBs foster credit expansion in the real economy is still broken. A tapering or an adjustment of CB balance sheets, combined with a tightening of monetary policy, may have profound unintended consequences which will be magnified by a severe shakeout in over-extended stock and bond markets. Caveat emptor.

China – Coal, Steel, Water and Demographics – Which way now?

400dpiLogo

Macro Letter – No 62 – 30-09-2016

China – Coal, Steel, Water and Demographics – Which way now?

  • The price of coking coal has risen 164% this year, doubling since July
  • The NDRC is still attempting to reduce both coal and steel production this year
  • The April stimulus package has boosted construction and infrastructure demand
  • The pace of Chinese growth has stabilised but at a much reduced level

This year several commodity markets saw significant price increases. I discussed this in Macro Letter – No 51 – 11-3-2016 – How do we square the decline in trade with the rebound in industrial commodities?

The price of Iron Ore, Aluminium and other industrial metals has rallied sharply over the last few weeks – WTI now seems to have followed suit. Most commentators regard this as a short covering rally.

Over the last six months the US economy has maintaining momentum, albeit at a disappointingly modest pace. Elsewhere the economic headwinds are blowing harder, with Europe and Japan still mired in a “slow-growth/no-growth” environment. Yet during the last few weeks the spot price of premium coking coal – one of the key inputs for steel production – has doubled to more than $200/tonne. Although this is from multi-year lows seen in 2015, coking coal is now the top performing commodity market year to date:-

steel-index-coking-coal

Source: Steel Index, Amcharts.com

According to CME data, the futures curve for Australian Coking Coal is in steep backwardation out to December 2017 delivery. This suggests a short-term supply shortage rather than a generalised increase in demand.  Mining.com – Stunning coking coal rally wreaks havoc in steel, iron ore explains what has been happening:-

The rise in the price of coking is upending the economics of the iron ore and steel markets with the Australian export benchmark price climbing 164% so far this year.

Metallurgical coal was exchanging hands at $206.40 on Monday according to data provided by Steel Index as it consolidates at higher levels following weeks of panic buying not seen since 2011, when floods in key export region in Queensland sent the price surging to $335 a tonne (albeit not for long).

The rally was triggered by Beijing’s decision to limit coal mines’ operating days to 276 or fewer a year from 330 before as it seeks to restructure the industry. Safety closures and weather related supply curbs in China and Australia only added fuel to the fire.

sgx-hot-metal-spread

Source: TSI, Bloomberg, SGX

The price of Iron Ore has also risen by 31% to around $55/tonne, but, as the chart above makes clear, the ratio between the price of iron ore and coking coal is now at its lowest this century.

China’s coking coal output has fallen more than 10% due to the government edict to curtail domestic production. In response import volumes rose 45% in August alone. Goldman Sachs and Macquarie have both increased their price forecasts for 2017 and 2018.

The National Development and Reform Commission (NDRC) – the agency responsible for implementing production cuts – had achieved only 39% of the annual target for reducing coal capacity and 47% of the annual reduction in steel capacity as of the end of July. The Peterson – Institute – State of Play in the Chinese Steel Industry explains the reasons for this policy. Suffice to say, China’s domestic steel production tripled between 2005 and 2015 taking its share of global steel production from 31% to 50%. Under WTO rules it will have Market Economy Status from December 2016 – a wave of anti-dumping laws suits may well follow unless it curtails production.

Despite common knowledge of official policy, commentators have suggested that the recent production cut was intended to deliberately squeeze coal prices, allowing heavily indebted coal producers to repay loans to domestic Chinese banks. After two meetings between the China Iron and Steel Association and the NDRC, coal producers will now be allowed to produce an additional 50 tonne/day from October to alleviate shortages.

The steel industry was under margin pressure even before the rise in coal prices – the government has been forcing an industry wide consolidation. The high price of coal accelerates this “oligopolisation” of the sector. It is part of a broader reform and consolidation of State Owned Enterprises (SOEs). The Peterson Institute – China’s SOE Reform—The Wrong Path takes issue with this policy. It has its attractions in the short-term nonetheless – consolidation reduces competition within industries, the pricing power of these consolidated “oligopolies” should rise, enabling them to increase profitability and reduce their indebtedness. President Xi has called for “Stronger, bigger, better” state-owned enterprises. I fear for the squeezed private sector in this environment.

A more important structural reform was announced last month when the Supreme People’s Court ordered the establishment of more special divisions to handle liquidation and bankruptcy cases in intermediate courts. China has an undeveloped bankruptcy code – defaulting borrowers linger, acting as a drag on the economy. At the G20 summit President Xi said, “China has taken the most robust and solid measures in cutting excess capacity and we will honour our commitment with actions”. An efficient method of “zombie corporation liquidation” would expedite this process.

Another explanation for the government’s decision to reduce the number working days at coal mines is its commitment to reducing pollution. Brookings – The end of coal-fired growth in China looks at the bigger picture:-

China’s coal consumption grew from 1.36 billion tons per year in 2000 to 4.24 billion tons per year in 2013, an annual growth rate of 12 percent. As of 2015, the country accounts for approximately 50 percent of global demand for coal. In other words, China’s economic miracle was fueled primarily by coal.

…China’s coal consumption decreased by 2.9 percent in 2014 and 3.6 percent in 2015, and the economy has maintained a moderate speed of growth. This indicates that there is a decoupling of economic growth from the growth in coal consumption. China’s coal consumption might have in fact already peaked.

Over the past 35 years, coal powered the engine of China’s rapidly developing economy. Coal represented 75 percent of overall energy consumption. This number decreased to 64.4 percent in 2015—the lowest in China’s modern history—as the country’s energy intensity decreased by 65 percent relative to 35 years ago. In fact, though rarely noticed until the recent peak, this has been part of a fundamental shift in the Chinese economy’s relationship with coal.

The authors present three arguments to support their view that China’s reliance on coal is in structural decline. Firstly, a decrease in manufacturing and construction, which have seen over-investment during the last decade or more. Second, policies on climate change and air pollution—especially the Paris Agreement’s, signed this month, which calls for a 20% clean energy target by 2030. Read China-United States Exchange Foundation – After the Paris Climate Agreement, What’s Next? for more details. Finally, China’s adoption of technological innovation in energy, communications, and manufacturing.

In his G20 speech President Xi said “…green mountains and clear water are as good as mountains of gold and silver”. The problem of clean water is probably the single greatest resource challenge facing China today as this article from CEAC – China that once thrived on water, faces water problems today points out:-

The total amount of water resources in China is so huge as to reach 2325.85 billion cubic meters, which is the 4th largest in the world. However, Chinese population is so large that the per capita amount of water resources is only 1730.4 cubic meters. This is extremely small in the world. Moreover, water resources are distributed unevenly by the region. Generally speaking, water is scarce in northern parts of China, including the Northeast, the North, and the Northwest regions. Beijing is in the North region. On the other hand, water is abundant in the South Central, the South, and the Southwest regions. The problem is that water is growing scarcer, while its consumption is rising. Particularly, people in Northwest China suffer from chronic shortage of water.

…It is not the quantity of water that matters critically in China. The quality of water is deteriorating rapidly. According to “The Monthly Report of Ground Water” which was released by the Ministry of Water Resources of China this January, they conducted water quality observation researches of 2,103 wells in the Songliao plain of the Northeast region and the Jianghan plain in an inland area last year, and it turned out that 80% of ground water is too severely contaminated to drink. Ground water pollution is serious, particularly in the regions of water scarcity.

In the shorter-term there has been some increase in demand. Steel usage has risen in response to the mini-stimulus package implemented in April. It was aimed largely at railway and housing construction. Electricity demand picked up again in May +2.1% from April +1.9%, fuelling an increase in demand for thermal coal. Other leading indicators, also suggest that the slowdown in Chinese growth may have run its course. There has been an increase in railway freight volumes and pickup in copper output:-

copper-5

Source: Market Realist, National Bureau of Statistics

Outside China the picture looks mixed. LME stocks of Copper and Zinc have recovered but Nickle and Aluminium stocks remain depleted. Global demand still appears to be subdued.

Chinese economy is unlikely to return to the double digit growth rates seen prior to the great recession, but, despite its indebtedness, the world’s largest command economy may be able to avoid an imminent banking crisis.

The Debt to GDP ratio continues to rise. A source of grave concern which is noted in the BIS Quarterly Review, September 2016. At the end of July total Chinese debt reached $28trln – greater than the government debt of the US and Japan combined. Corporate debt, which is fortunately denominated primarily in local currency, now stands at 171% of GDP whilst total debt stands at 255%. A favourite BIS measure is the Credit to GDP gap. A figure above 10 is a warning signal that an economy may be approaching a “Minsky Moment” – China scores 30.1, the highest of any large economy.

China has also continued to reduce its vast foreign exchange reserves, although at a more moderate pace than in 2014 and 2015. In July it reduced its holding of US Treasuries by $22bln – the largest one month decline in three years. It also released information about its gold holdings which, as many market participants had predicted, have risen substantially – it last reported this information in 2009. The US Bond sales may, therefore, have been to insure the stability of the RMB versus the US$ ahead of the G20 summit which was hosted by China this month.

Should we be concerned about a Chinese banking crisis? According to Michael PettisChina Financial Markets – Does it matter if China cleans up its banks? banking solvency is not the issue, but the indebtedness of the economy is:-

The only “solution” to excessive debt within the economy is to allocate the costs of that debt, and not to transfer it from one entity to another.

The recapitalization of the banks is nice, in other words, but it is hardly necessary if we believe, and most of us do, that the banks are effectively guaranteed by the local governments and ultimately the central government, and that depositors have a limited ability to withdraw their deposits from the banking system. “Cleaning up the banks” is what you need to do when lending incentives are driven primarily by market considerations, because significant amounts of bad loans substantially change the way banks operate, and almost always to the detriment of the real economy.

…If we change our very conservative assumptions so that debt is equal to 280% of GDP, and is growing at 20% annually, and that debt-servicing capacity is growing at half the rate of GDP (3.0-3.5%, which I think is probably still too high), then for China to reach the point at which debt-servicing costs rise in line with debt-servicing capacity, Beijing’s reforms must deliver an improvement in productivity that either:

Causes each unit of new debt to generate 18 times as much GDP growth as it is doing now, or

Causes all assets backed by the total stock of debt (280% of GDP) to generate 50% more GDP growth than they do now.

Pettis remains pessimistic about China’s ability to grow its way out of debt. History is certainly on his side in this respect, however, policies such as the One Belt One Road Initiative, which aims to improve cross-border infrastructure in order to reduce transportation costs between China and its trading partners, still makes sense at this stage of China’s development. Comparisons have been made with the US Marshall Plan which helped to regenerate Europe after WWII but with an indicated aim of financing $4trln of new projects, its scale is much larger. Chatham House – Westward ho—the China dream and ‘one belt, one road’: Chinese foreign policy under Xi Jinping reviews the policy in detail, as does Peterson Institute – China’s Belt and Road Initiative.

Meanwhile, the great rebalancing towards domestic consumption continues, at what, in other countries, would be considered break-neck speed. This may, nonetheless, be too slow for China – the mini-stimulus package, in April, was a clear political capitulation. The Kansas City Federal Reserve – Consumer Spending in China: The Past and the Future looks at the success of rebalancing to date and the prospects going forward. They point out that Chinese consumption as a share of GDP declined between 1970 and 2000 largely as a result of demographic forces – low birth rate and aging population – together with urbanisation. Post 2000 rapid house price appreciation accelerated this trend. Since 2010 consumption has begun to rise from a low point of 37% of GDP, this coincides with the peak in household savings at 42% – it is now around 38.5%. The authors predict:-

In a benchmark scenario of relatively stable income growth and a further modest decline in the household saving rate, consumption growth in China remains at around 9 percent per year over the next five years, causing the share of Chinese consumption in GDP to increase by about 5 percentage points to 44 percent by 2020. This scenario has two implications. First, it suggests that strong consumption growth is sustainable in the near future, allowing China to continue transitioning toward a consumption-driven economy. Second, it suggests that strength in near-term Chinese consumption growth will partly rely on a further decline in the household saving rate. As the household saving rate cannot decline indefinitely, consumption growth may need to rely more heavily on household income to be sustainable in the long run.

Parallels have been made with Japan where the savings rate has declined from 40% to 19% of GDP since 1970. If China follows this pattern, savings as a percentage of income will continue to decline. The transition could be relatively smooth provided the residential property market does not collapse in the interim. The FRBKC article concludes:-

The declining saving rate in China reflects both a changing demographic structure—an expected increase in the young dependency ratio after multiple decades of decline—and a changing consumption pattern of young people, who face less pressure to save thanks to financial support from their parents and grandparents.

In the long run, transitioning to a consumption-driven economy may require some policy changes. Specifically, China may need to implement successful supply-side reforms—which are on the government’s agenda but haven’t yet been significantly pushed forward—to enable domestic production to meet rising domestic demand. Although the Chinese household saving rate is declining from a very high level, the downward trend cannot last forever. A truly consumption-driven economy must rely on strong household income growth, which is ultimately driven by improved technology and investment.

In the long run, demographic forces will affect China more than any other factor. According to the Ministry of Human Resources China’s working population hit a record 774.5mln in 2015, however, the UN estimate China will have 212mln fewer workers by 2050. The UN Demographic Profile is found on page 189.

Market impact and investment opportunities

Next week the RMB will be included in the SDR – the Peterson Institute – China’s Renminbi Is about to Break the Financial Glass Ceiling discusses this in more detail. There is widespread speculation that the PBoC will widen the RMB currency bands at any moment. In other respects the PBoC is in a more difficult position. The RMB has already weakened by 5% against the US$ this year. Cutting interest rates would probably cause the currency to weaken further, riling the US voters ahead of the election. They are not impotent, however, and injected a record RMB 310bln into the money market in August – part of an overt policy to support the official banking sector, diminishing the influence of shadow banks.

Domestic investors have favoured bonds over equities for the past couple of months, while the spread between corporate bonds and government bonds has narrowed. Chinese 10yr government bond yields have fallen around 50bp this year, but official policy, encouraging investors to purchase higher yielding bonds and reduce their exposure to leveraged wealth management products and other non-standard assets, is boosting demand for corporate issues.

Retail investors, who were badly burnt in the stock market collapse of 2015, remain obsessed with the property market despite massive over-supply. Equity broker margin balances remain low. Institutional portfolio managers have reduced exposure to stocks from 62% in July to 49% this month. In the post-crash environment IPO issuance has been subdued with only RMB 955bln of capital raised in the seven months to July. This compares to RMB 1.55trln in 2015. The final quarter may see better sentiment. Stocks may get a boost from local government spending in Q3 and Q4 – if only to insure their budgets are not reduced next year. The table below, from Star Capital, ranks forty of the world’s major stock markets. Using their metrics, China is second cheapest and has the lowest PE, Price to Cash flow and Price to Book:-

Country CAPE PE PC PB PS DY Rank
Russia 4.9 7.5 3.6 0.8 0.8 4.10% 1
China 12.4 6.1 3.2 0.8 0.6 4.70% 2
Brazil 8.5 44.1 6.6 1.4 1.1 3.40% 3
South Korea 12.6 11 5.5 1 0.6 1.80% 5
Hungary 9.9 ? 5.1 1.2 0.6 2.80% 6
Czech 8.7 11.8 5.5 1.2 1 7.50% 8
Turkey 9.7 10.8 6.2 1.3 0.9 2.70% 9

Source: Starcapital.de

The Shanghai Composite Index (SHCOMP) is down 8.85% YTD and by 41.84% since its high in June 2015, however it is up 48.25% from June 2014. Russia’s RTS Index by contrast is up 72.81% from its December 2014 low but still 29.68% below its level of June 2014.

Looking outside China, several Australia-centric mining stocks have already risen on the back of the move in coking coal but it seems unlikely that the supply imbalance will prove protracted. Anglo American (AAL) is still looking to sell more of its Australian coal mines – they may well find Chinese buyers.

Outside of China, infrastructure investment across Asia Pacific is on the rise, which is supportive for industrial commodities in general. KPMG – 10 emerging trends in 2016, published in January, takes a very optimistic long term view:-

Ultimately, however, we believe that this may well be the tipping point that ushers in 50 years (or more) of prosperity as capital starts to match up with projects which, in turn, will drive economic growth in the developing world and shore up retirement savings in the mature markets.

Commodity markets tend to exhibit very individual characteristics, however, several industrial and agricultural commodities have formed a longer term base this year. Is this the beginning of the next commodity super-cycle? It’s too soon to call, but without a rise in global demand the prospects for substantial gains are likely to be limited – Indian GDP growth is slowing. The IMF WEO July update revised its India GDP forecast for 2016 to 7.4% from 7.5% – in 2015 it was 7.6%. Its China forecast was revised up 0.1% and its overall Emerging Market and Developing Economy forecast for 2016 and 2017 was unchanged at 4.1% and 4.6%, although, world economic growth was revised 0.1% lower.

China’s stock market remains cheap by many metrics, but the level of indebtedness is an impediment to economic growth. The property market, although over-supplied, continues to attract investment, but this is economically unproductive in the long run. Government policy is attempting to steer the economy towards higher domestic consumption and technologically driven, productivity enhancing, investments. Environmental issues are finally being addressed, yet the challenge of clean water remains substantial.

Near term, debt reduction – and it has yet to begin – will hamper growth, which will, in turn, reduce the attractiveness of Chinese stocks. Reform of the SOEs will involve consolidation into a smaller number of vast enterprises. Private enterprises will suffer. “Zombie” companies will start to be dealt with as bankruptcy procedures become standardised, but, as with all policy in China, a gradualist approach is likely to be implemented. Commodity markets may continue to rise due to supply side factors but I doubt that Chinese demand will rebound even to the level of 2013/2014, let alone the early part of the century.

China – Rebalancing, Debt and the Stock Market

400dpiLogo

Macro Letter – No 58 – 08-07-2016

China – Rebalancing, Debt and the Stock Market

  • Chinese growth has been slowing since 2007
  • Total debt to GDP has risen from 148% in 2007 to 237% today
  • Oversupply in real-estate is still a concern but lower interest rates are helping
  • Infrastructure spending may help and Chinese stocks are cheap

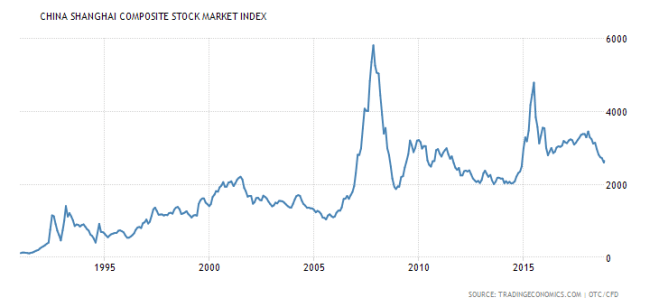
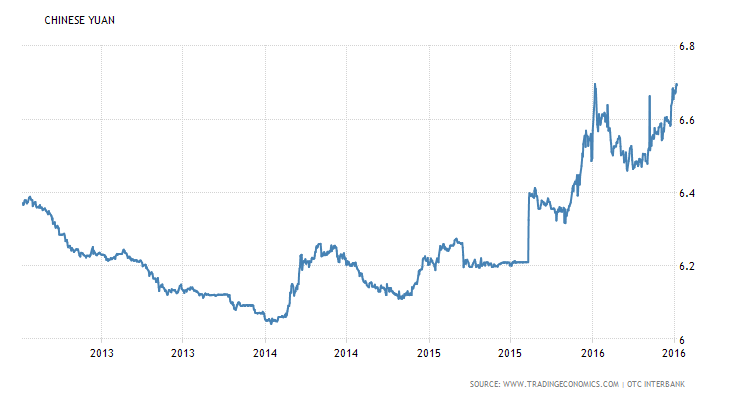
I was prompted to write this rather longer letter by the recent weakness of the Chinese currency. The chart below tracks the progress of the USDCNY over the last three years, compared with many emerging markets the devaluation is minimal:-

china-currency 2yr

Source: Trading Economics

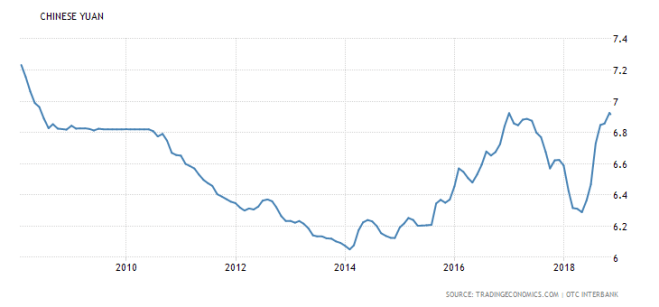
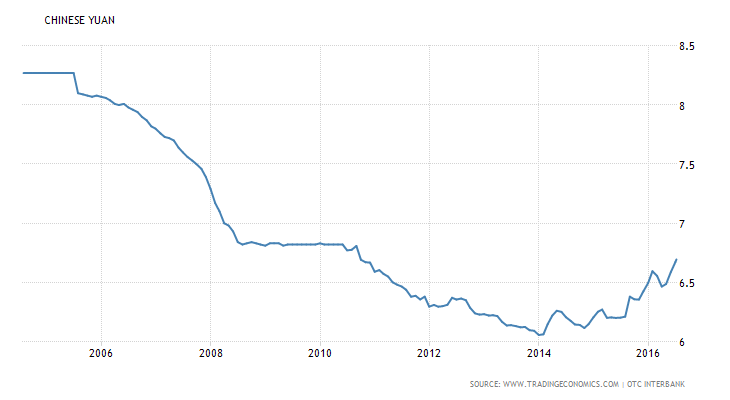
A longer term chart shows how far the currency has travelled over the last 12 years:-

china-currency 12 yr

Source: Trading Economics

It was at the National People’s Congress of March 2013 that the policy of “rebalancing” was introduced, however, the CNY continued to strengthen. This gradual appreciation against the US$ had created large imbalances within the Chinese economy. The economic-policy adjustment of “rebalancing” had one objective: shifting China from a production-oriented economy to one focused on household consumption. If, in the process, it could alleviate international pressure on the Chinese administration to allow the CNY to float freely, so much the better. Now it looks as if the outcome of allowing the CNY to float freely would see it sink like a stone.

A Review of Rebalancing

A detailed analysis of the rebalancing challenge is contained in this February 2013 paper from the ECB – China’s Economic Growth and Rebalancing it highlights international concerns:-

China’s leadership is well aware of the limitations of the producer-biased and export-led model. Interestingly, there is no major disagreement between the Chinese and the international community about the need for rebalancing policies to ensure China’s smooth transition to a more sustainable model. The disagreement is more about how fast the reform measures should be implemented.

It has been argued that intertwined economic and political interests make China’s rebalancing more difficult and cause the reform process to advance slowly. Political resistance to the reforms stems from various sources. First, in a system where political success at the local level has been historically dependent on quantitative growth, reforms that emphasise the quality of growth are bound to meet some resistance. Second, the current growth model required to keep some strategic sectors of the economy closed and under state control (e.g. financial markets, services, heavy industry). The planned opening up of these sectors to competition does not only meet resistance from SOEs and banks, but is also questioned in government circles owing to worries about exhausting the “privilege” of direct macroeconomic policy management. Not surprisingly, major resistance is observed in the export lobby, which is one of the most influential in China and the one which reforms affect most directly.

Reviewing the policy initiative in June 2014 – shortly after the, once in a decade, handover of power from President Hu Jintao and Premier Wen Jiabao to Xi Jinping and Li Keqiang – McKinsey – China’s great rebalancing: Promise and peril concluded:-

Of course, there is no guarantee that rebalancing will succeed. Part of the problem is that the politics associated with it—boosting the income of Chinese households at the expense of state-owned companies and other large investment-oriented entities—is actually more complicated than the economics. But one thing is certain. China is rapidly reaching the point of diminishing economic and political returns from its investment-driven model, which is headed for change one way or another: either through a proactive rebalancing, with reforms and policy adjustments, or a forced rebalancing precipitated by rising stresses in and beyond the financial system. So far, the signs are encouraging that the new leadership is serious about changing China’s growth model, and this is reason enough for global firms that have benefited from China’s investment boom to rethink their strategies for the years ahead.

Three years on the challenges of rebalancing an $11trln economy of 1.4bln people are becoming evident. McKinsey – China’s Choice – Capturing the $5 Trillion Productivity Opportunity, published last month, makes the case for continued reform based on boosting productivity:-

…Government can do a great deal to improve the odds of success by transforming institutions in six priority areas:

I. Open more sectors up to competition. SOEs still account for 43 percent of service sector fixed-asset investment, compared with 8 percent in manufacturing

.…In telecommunications, for instance, an effort to introduce mobile virtual network operators to target underserved segments has not yet had a substantial impact because the big three players in the sector still have considerable clout in negotiations and strong influence on pricing. In health care, fixing the economics model to make hospitals less dependent on drug sales and encourage more qualified doctors to work at private hospitals could help improve the quality of service.

II. Improve the breadth and quality of capital markets. China would benefit from a financial system where market forces allocate capital efficiently; that means well functioning bond and equity markets that attract a diverse set of investors, including institutional and overseas players. The municipal bond market could lower financing costs for local government while bringing market discipline to managing investment projects. To facilitate this shift, China needs to strengthen the foundations of an effective financial system, such as strong, independent credit-rating agencies, more transparent public data on the economy, and more effective communication about government monetary policy. Inviting new players (such as internet banks) to supply capital and helping banks build capabilities to undertake more lending for underserved segments such as small and medium-sized enterprises and rural consumers will be important.

III. Enable corporate restructuring. Shifting successfully to a productivity-led growth model will mean a sea change—letting inefficient companies fail rather than protecting and propping them up and rationalizing excess capacity.

…enforcing bankruptcy law and improving the bankruptcy process. Strengthening capabilities of asset-management companies tasked with handling restructuring could help to turn around companies in default. China will need to expand the securitization of non-performing loans to be prepared for any larger-scale bad debt situation and to ensure that banks put effective risk management in place.

IV. Invest in talent and enhance labor mobility. China has made great strides in educating its people, but more is needed. Among the measures that the government could now take are providing more funding for education, designing programs that rotate effective teachers to places they are most needed, and engaging the private sector to define job-ready skills, build those into curricula, and establish an education to-employment pipeline. On top of this, the government could enhance labor mobility to optimize employment across different regions of the country. Expansion of unemployment insurance and training can help smooth the transition for displaced workers and help them back into jobs. Ensuring gender equality in opportunities in education and in the labor market, while supporting women as well as men as they develop their careers, can further strengthen China’s talent base.

V. Boost aggregate demand. As inequality grows, the government can revise fiscal and tax policies to give households more spending power. For families in need, it could consider conditional cash transfers. Improving social safety net programs by raising health-care and retirement benefits, for example, can reduce the need for precautionary saving for out-of-pocket medical expenses, facilitate consumption, and reduce income inequality. Broadening affordable-housing programs to include migrant workers, with market-based subsidies on both the supply and demand side, can also help low-income families to consume more.

VI. Improve public-sector effectiveness. Ensuring that government raises its own productivity is an important part of any transition to a productivity-led model. Such an effort can start by using household income and productivity indicators to evaluate officials and departments rather than rewarding them largely for the GDP growth their cities or regions achieve. Digitizing government operations and service delivery is an important part of the mix. Government also needs to develop better conflict-resolution capabilities to mediate between different stakeholders so that restructuring and reforms can proceed.

Another aspect of President Xi’s reform is in foreign policy, it has been dubbed the “One Belt, One Road” (OBOR). Last week the Economist – Our bulldozers, our rules discussed the potential of the initiative:-

…Asia needs new infrastructure—about $770 billion a year of it until 2020, according to the Asian Development Bank. This demand should eventually ease today’s worries about a lack of projects. Bert Hofman, the World Bank’s chief in Beijing, adds that individual countries will benefit more if they align their plans with one another and with China. It does not pay to plan and build separately.

Next, China needs OBOR. At home, its businesses are being squeezed by rising costs and growing demands that they pay more attention to protecting the environment. It makes sense for them to shift some manufacturing overseas—as long as the infrastructure is there.

Lastly, Xi Jinping needs it. He has made OBOR such a central part of his foreign policy and has gone to such lengths to swing the bureaucracy behind the project that it is too late to step back now.

None of this means the new Silk Road will be efficient, nor does it mean China’s plans will always be welcome in countries suspicious of its expanding reach. But the building blocks are in place. The first projects are up and running. OBOR is already beginning to challenge the notion of Europe and Asia existing side by side as different trading blocs.

This is reminiscent of the economic development of Japan during the 1970’s and 1980’s.

Despite these policy initiatives, the Chinese economy has been slowing for the past six years. An excellent overview of the current situation was provided last month by the China-United States Exchange Foundation – China’s Incomplete Growth Strategy, in which they highlighted the policies for and challenges to achieve growth, both in the long and short run. Most of the problems are associated with the oversupply evident in the real-estate market and the economic drag from the debt associated with this over-supply. Their solution, as McKinsey suggested above, is infrastructure development:-

…last November, they officially placed the blame on long-term supply-side shortcomings, which they pledged to address with far-reaching structural reforms.

…the supply-side focus largely ignores the present. China faces two separate challenges: the long-term issue of a declining potential growth rate and the immediate problem of below-potential actual growth.

Among the long-term factors undermining potential growth are diminishing returns to scale, a widening income gap, and a narrowing scope for technological catch-up through imitation. Moreover, even as the country’s demographic dividend dissolves, its carrying capacity (the size of the population the environment can sustain) is being exhausted – a situation that high levels of pollution are certainly not helping. Finally, and most important, the country is suffering from inadequate progress on market-orientated reform.

While some of these factors are irreversible, others can be addressed effectively. And, indeed, the government’s supply-side reform strategy will go a long way toward doing just that, ultimately stabilizing and even raising China’s growth potential. But, contrary to popular belief, they will not boost China’s actual growth rate today.

Why are so many economists convinced that a long-term reform strategy is all China needs? One reason is the widely held notion that today’s overcapacity reflects supply-side problems, not insufficient demand. According to this view, China should implement policies like tax cuts to encourage companies to produce products for which there is genuine demand. That way, the government would not inadvertently sustain “zombie enterprises” that cannot survive without bank loans and support from local governments.

But only some of China’s overcapacity can be attributed to bad investment decisions. A large share has emerged because of a lack of effective demand. And that is, at least partly, a result of the government’s effort to moderate real-estate investment, which has caused the sector’s annual growth to tank, plunging from 38% in 2010 to 1% at the end of 2015.

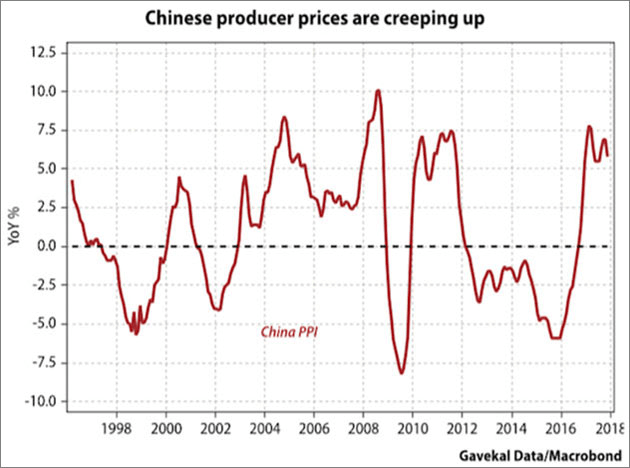
With real-estate investment still accounting for more than 14% of GDP last year, plummeting growth in the sector has put considerable downward pressure on the economy as a whole, helping to push China into a debt-deflation spiral. As overcapacity drives down the producer price index – which has now been falling for 51 consecutive months – real debt rises. This is undermining corporate profitability, spurring companies to deleverage and reduce investment, and fuelling further declines in PPI.

The enduring importance of real-estate investment to China’s economic growth is reflected in trends from the first quarter of this year. Annual GDP growth of 6.7%, despite being the slowest rate for any quarter in seven years, exceeded market expectations. And it was driven partly by an unforeseen increase in real-estate investment growth, to 6%.

This is not to say that what China needs is more real-estate investment. According to the National Bureau of Statistics, China had 718 million square meters of unsold commercial and residential floor space at the end of 2015; when space under construction is factored in, inventory expands to more than five billion square meters. With an average of only 1.2 billion square meters of housing being sold each year, the best way to reduce this supply glut is clear: limit future construction. One of the most important reasons for the recent investment surge was abundant liquidity driving speculative demand – and that is hardly sustainable.

…Infrastructure investment, in particular, may well be the key to tackling China’s economic woes. After all, such investment, which grew at 19.6% in the first quarter of 2016, has already proved to be a critical driver of economic growth – and, unlike real-estate investment, it has not worsened China’s resource allocation or set the stage for major imbalances.

When there is slack in the economy, the only way to escape the debt-deflation trap is to grow strongly. Given that China is saddled with large local-government and corporate debts, but also enjoys large domestic savings and a strong fiscal position, this message could not be more pertinent. In an ideal world, domestic consumption would serve as the main engine of growth; under current circumstances, infrastructure investment is the most reliable option.

In the short term, when overcapacity and deflation are the main obstacles, infrastructure investment boosts growth through the economy’s demand side. In the long run, it operates through the supply side to boost productivity and thus raise growth potential. China can fund such investment with fiscal deficits, given strong demand for government bonds. And, with China’s major banks still state-owned, and capital controls still in place, the risk of an imminent financial crisis is very low.

Of course, China’s government must uphold its commitment to implement structural reforms. But infrastructure investment is also badly needed, not just to prevent the economy from sliding further, but also to enable China to generate the sustained long-term growth that it requires to achieve developed-country status.

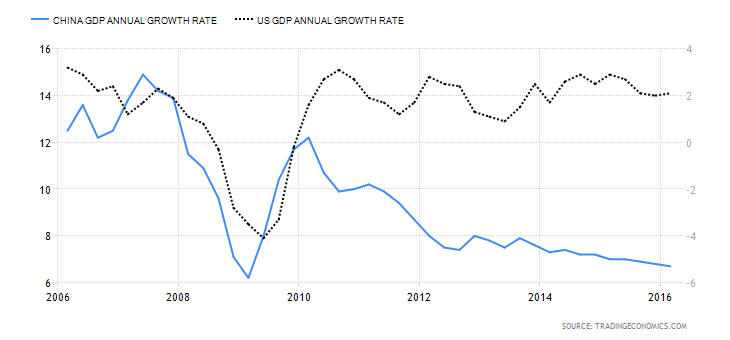
The slowdown in Chinese growth has finally prompted concerns around the world. In their May Economic Letter, the Dallas Fed – Impact of Chinese Slowdown on U.S. No Longer Negligible noted that the knock on effect of slowing Chinese growth had taken 20% off US GDP. The chart below shows Chinese and US annual GDP growth over the last 10 years, China is the left hand scale, the negative impact of Chinese growth on US GDP since 2010 has been roughly 0.4%:-

China vs US GDP 10 yr

Source: Trading Economics

The Problem of Debt

The current environment in China – as it is in much of the rest of the world – is dominated by the incessant increase in debt. In May, in what many observers regard to be a reversal of their opinion on the dangers of China’s debt mountain, the Economist – The coming debt bust attempted to quantify the magnitude of the problem facing the Chinese financial system:-

China was right to turn on the credit taps to prop up growth after the global financial crisis. It was wrong not to turn them off again. The country’s debt has increased just as quickly over the past two years as in the two years after the 2008 crunch. Its debt-to-GDP ratio has soared from 150% to nearly 260% over a decade, the kind of surge that is usually followed by a financial bust or an abrupt slowdown.

China will not be an exception to that rule. Problem loans have doubled in two years and, officially, are already 5.5% of banks’ total lending. The reality is grimmer. Roughly two-fifths of new debt is swallowed by interest on existing loans; in 2014, 16% of the 1,000 biggest Chinese firms owed more in interest than they earned before tax. China requires more and more credit to generate less and less growth: it now takes nearly four yuan of new borrowing to generate one yuan of additional GDP, up from just over one yuan of credit before the financial crisis. With the government’s connivance, debt levels can probably keep climbing for a while, perhaps even for a few more years. But not for ever.

When the debt cycle turns, both asset prices and the real economy will be in for a shock. That won’t be fun for anyone. It is true that China has been fastidious in capping its external liabilities (it is a net creditor). Its dangers are home-made. But the damage from a big Chinese credit blow-up would still be immense. China is the world’s second-biggest economy; its banking sector is the biggest, with assets equivalent to 40% of global GDP. Its stockmarkets, even after last year’s crash, are together worth $6 trillion, second only to America’s. And its bond market, at $7.5 trillion, is the world’s third-biggest and growing fast. A mere 2% devaluation of the yuan last summer sent global stockmarkets crashing; a bigger bust would do far worse. A mild economic slowdown caused trouble for commodity exporters around the world; a hard landing would be painful for all those who benefit from Chinese demand.

Brace, brace

Optimists have drawn comfort from two ideas. First, over three-plus decades of reform, China’s officials have consistently shown that once they identified problems, they had the will and skill to fix them. Second, control of the financial system—the state owns the major banks and most of their biggest debtors—gave them time to clean things up.

Both these sources of comfort are fading away. This is a government not so much guiding events as struggling to keep up with them. In the past year alone, China has spent nearly $200 billion to prop up the stockmarket; $65 billion of bank loans have gone bad; financial frauds have cost investors at least $20 billion; and $600 billion of capital has left the country. To help pump up growth, officials have inflated a property bubble. Debt is still expanding twice as fast as the economy.

…“shadow assets” have increased by more than 30% annually over the past three years. In theory, shadow banks diversify sources of credit and spread risk away from the regular banks. In practice, the lines between the shadow and formal banking systems are badly blurred.

That creates two risks. The first is higher-than-expected losses for the banks. Hungry for profits in a slowing economy, plenty of Chinese banks have mis-categorised risky loans as investments to dodge scrutiny and lessen capital requirements. These shadow loans were worth roughly 16% of standard loans in mid-2015, up from just 4% in 2012. The second risk is liquidity. The banks have become ever more reliant on “wealth management products”, whereby they pay higher rates for what are, in effect, short-term deposits and put them into longer-term assets. For years China restricted bank loans to less than 75% of their deposit base, ensuring that they had plenty of cash in reserve. Now the real level is nearing 100%, a threshold where a sudden shortage in funding—the classic precursor to banking crises—is well within the realm of possibility. Midsized banks have been the most active in expanding; they are the place to look for sudden trouble.

Pandamonium

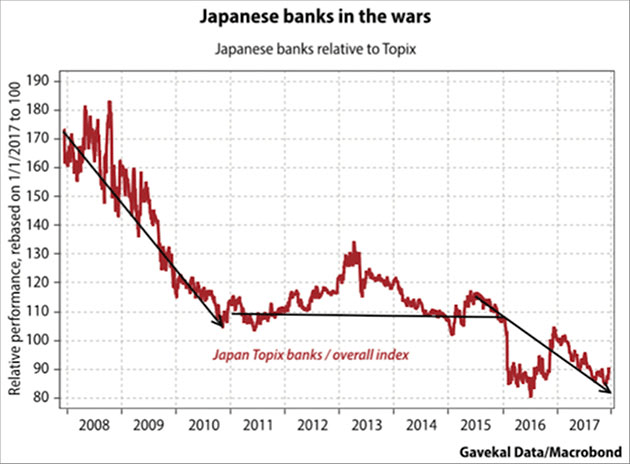
The end to China’s debt build-up would not look exactly like past financial blow-ups. China’s shadow-banking system is big, but it has not spawned any products nearly as complex or international in reach as America’s bundles of subprime mortgages in 2008. Its relatively insulated financial system means that parallels with the 1997-98 Asian crisis, in which countries from Thailand to South Korea borrowed too much from abroad, are thin. Some worry that China will look like Japan in the 1990s, slowly grinding towards stagnation. But its financial system is more chaotic, with more pressure for capital outflows, than was Japan’s; a Chinese crisis is likely to be sharper and more sudden than Japan’s chronic malaise.

One thing is certain. The longer China delays a reckoning with its problems, the more severe the eventual consequences will be. For a start, it should plan for turmoil. Policy co-ordination was appalling during last year’s stockmarket crash; regulators must work out in advance who monitors what and prepare emergency responses. Rather than deploying both fiscal and monetary stimulus to keep growth above the official target of at least 6.5% this year (which is, in any event, unnecessarily fast), the government should save its firepower for a real calamity. The central bank should also put on ice its plans to internationalise the yuan; a premature opening of the capital account would lead only to big outflows and bigger trouble, when the financial system is already on shaky ground.

Most important, China must start to curb the relentless rise of debt. The assumption that the government of Xi Jinping will keep bailing out its banks, borrowers and depositors is pervasive—and not just in China itself. It must tolerate more defaults, close failed companies and let growth sag. This will be tough, but it is too late for China to avoid pain. The task now is to avert something far worse.

An article in Bruegal – Chinese banks: the way forward, which was published in April, looks in greater detail at the expansion of Chinese bank credit:-

The extensive credit expansion in January and February, especially from the banking sector, has several implications. First, it masks the growth of the non-performing loan ratio as the denominator has experienced such a big increase. Second, such surge in credit granted must have had a surge in demand as well. Whether that new demand reflects an improvement in the economy or simply more financing needs is a key question. If it is the latter then it reflects an increasing demand for new funds to repay outstanding loans.

Having said that, China had a bad-loan coverage ratio of 150%, which is considered high for international standards. However, there is rumor that this will be lowered to 120%. In any event, credit risk is rapidly rising in China as the economy slows down and financial conditions are lax enough for corporates to continue to leverage. The question, thus, is how weak are Chinese banks in the current circumstances.

No review of the financial position of China would be complete without a comment from Michael Pettis; last month he wrote Rebalancing, wealth transfers, and the growth of Chinese debt, this is a long research paper so I have only included extracts below:-

There is no way Beijing can address the debt without a sharp drop in GDP growth, but as unwilling as Beijing may be to see much lower growth, it doesn’t have any other option. It must choose either much lower but manageable growth today or a chaotic decline in growth tomorrow. The debt burden cannot stop rising, in other words, until Beijing adjusts its growth expectations sharply downwards and forcefully implements the kinds of reforms that the XI administration has talked about implementing, albeit against powerful political opposition, since the Third Plenum of October 2013.

Pettis then produces a set of scenarios, firstly with growth remaining at current levels:-

Growth remains at 6-7% 2016 -2019 2020-2023
No government transfers


·    Debt growth is steady at 12-14%

·    Investment growth is steady at current levels

·    Consumption growth is steady at current levels

·    Growth in household income is steady and household share of GDP is unchanged

·    No rebalancing


·    Period begins with 25% higher debt-to-GDP ratio, and consumption and investment account for roughly equal shares of GDP

·    Debt growth rises to 15-18%

·    Investment growth is steady at current levels

·    Consumption growth is steady at current levels

·    Growth in household income is steady and household share of GDP is unchanged

·    No rebalancing


Growth remains at 6-7% 2016 -2019 2020-2023
Annual government transfers of 1-2% of GDP


·   Debt growth drops to 9-10%

·   Investment growth declines by 2-3 percentage points

·   Consumption growth rises by 2-3 percentage points

·   Growth in household income rises by 2-3 percentage points and household share of GDP rises slightly

·   Minimal rebalancing


·   Period begins with 10-15% higher debt-to-GDP ratio, and consumption exceeds investment as a source of growth

·   Debt growth rises to 11-13%

·   Investment growth declines by another percentage point

·   Consumption growth is steady

·   Growth in household income is steady and household share of GDP rises

·   Gradual rebalancing


Growth remains at 6-7% 2016 -2019 2020-2023    
Annual government transfers of 3-4% of GDP


·    Debt growth drops to 8-10%

·    Investment growth declines by 6-7 percentage points

·    Consumption growth rises by 6-7 percentage points

·    Growth in household income rises by 6-7 percentage points and household share of GDP is materially higher

·    Material rebalancing


·    Period begins with 5-10% higher debt-to-GDP ratio, and consumption significantly exceeds investment as a source of growth

·    Debt growth rises to 6-8%

·    Consumption growth declines by 1-2 percentage points

·    Growth in household income declines by 1-2 percentage points and household share of GDP is materially higher

·    Material rebalancing


Next, Pettis looks at the same scenarios adjusting growth lower:-

Growth drops to 3-4% 2016 -2019 2020-2023
No government transfers


·    Debt growth drops to 6-8%

·    Investment growth declines by 4-6 percentage points

·    Consumption growth declines by 2-4 percentage points

·    Growth in household income declines by 2-4 percentage points and household share of GDP is slightly higher

·    Material rebalancing


·    Period begins with 10-15% higher debt-to-GDP ratio, and consumption exceeds investment as a source of growth

·    Debt growth is steady at 6-8%

·    Investment growth is steady at current levels

·    Consumption growth is steady at current levels

·    Growth in household income is steady at current levels and household share of GDP is materially higher

·    Material rebalancing


Growth drops to 3-4% 2016 -2019 2020-2023
Annual government transfers of 1-2% of GDP


·   Debt growth drops to 5-6%

·   Investment growth declines by 7-9 percentage points

·   Consumption growth is flat

·   Growth in household income is flat and household share of GDP is higher

·   Material rebalancing


·   Period begins with slightly higher debt-to-GDP ratio, and consumption significantly exceeds investment as a source of growth

·   Debt growth is steady at 5-6%

·   Investment growth is steady at current levels

·   Consumption growth is steady at current levels

·   Growth in household income is steady at current levels and household share of GDP is materially higher

·   Material rebalancing


Growth drops to 3-4% 2016 -2019 2020-2023
Annual government transfers of 3-4% of GDP


·   Debt growth drops to close to zero

·   Investment growth is zero

·   Consumption growth rises from current levels

·   Growth in household income rises from current levels and household share of GDP is materially higher

·   Substantial rebalancing


·   Period begins with lower debt-to-GDP ratio, and consumption significantly exceeds investment as a source of growth

·   Debt growth drops to well below GDP growth

·   Investment growth is steady at current levels

·   Consumption growth is steady at current levels

·   Growth in household income is steady at current levels and household share of GDP is substantially higher

·   Substantial rebalancing


Pettis concludes:-

A massive debt burden significantly reduces the options available to policy-makers and a severely unbalanced structure of demand forces policy-makers to choose between rising unemployment, rising debt, or rising wealth transfers. Economists who do not understand how this fairly simply trade-off dominates all policymaking simply will not be able to provide useful policy advice.

Conclusion and Investment Opportunities

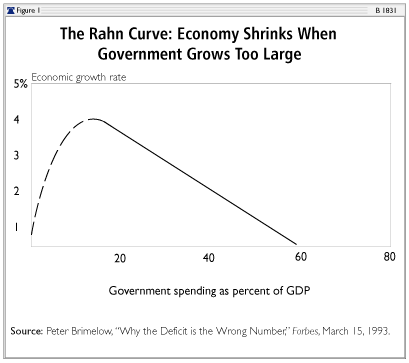
China, like many other countries has a problem with debt. The FT recently published an estimate that the Chinese debt to GDP ratio was only 237% (lower than the Economist’s 260%) and government debt to GDP is only 43.9%, whilst household debt to GDP is 39.5%. The Heritage Foundation – Index of Economic Freedom 2016 – estimates China’s government spending to GDP at 29.3%, below that of many developed nations. The Rahn curve below shows how government spending can help to accelerate growth but the diminishing return once it rises above 15% of GDP:-

1DFA0969D85ED690F4E4B05858404992

Source: The Heritage Foundation, Peter Brimelow

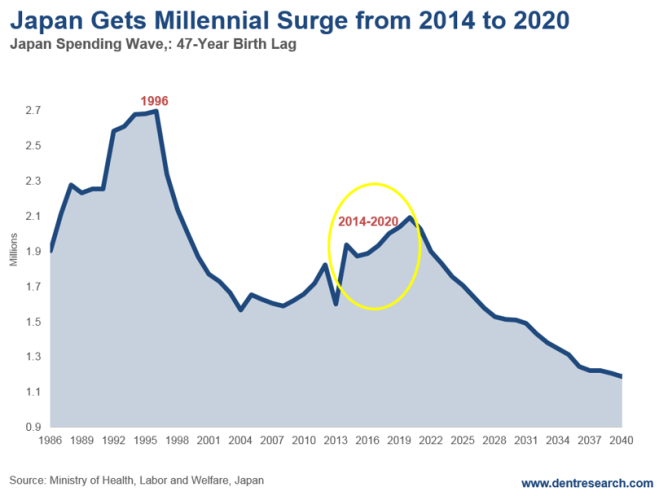
Nonetheless, China compares favourably with Japan where government spending is 40.2%.

Stocks, Bonds and the Currency

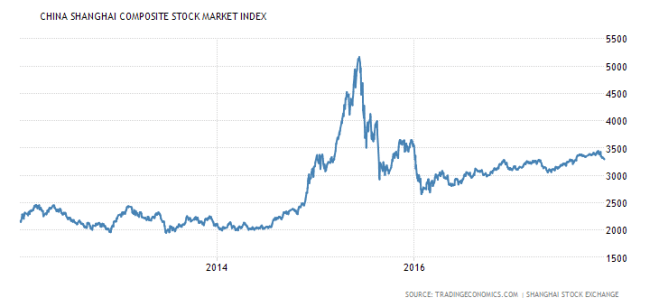
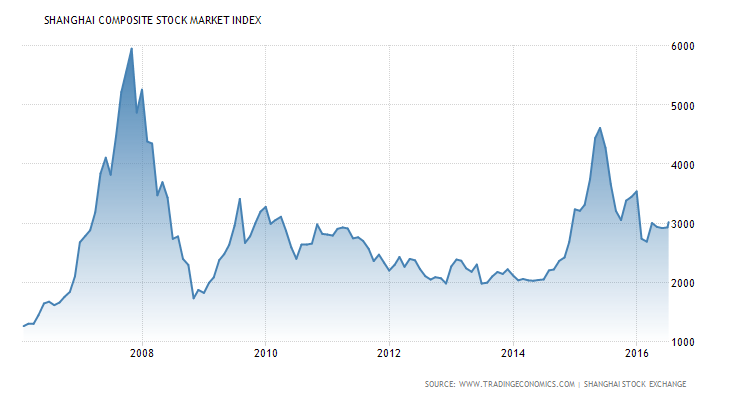
The Shanghai Composite, shown below, has turned higher since the middle of May. A break above 3,075 could see it retest the highs of 2015 but this is unlikely to be the policy of the Xi administration:-

china-stock-market 10 yr

Source: Trading Economics, Shanghai Stock Exchange


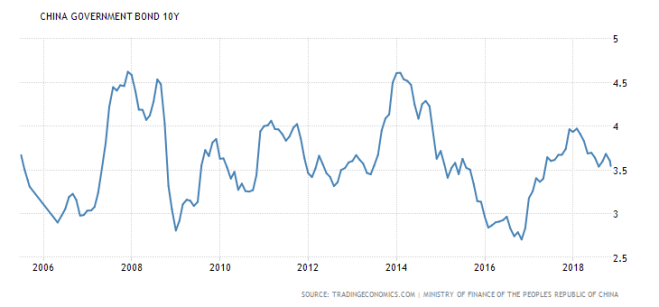
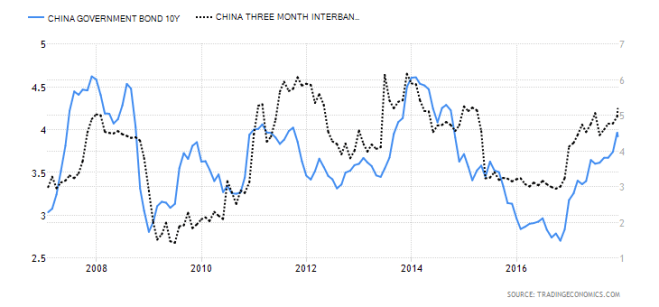
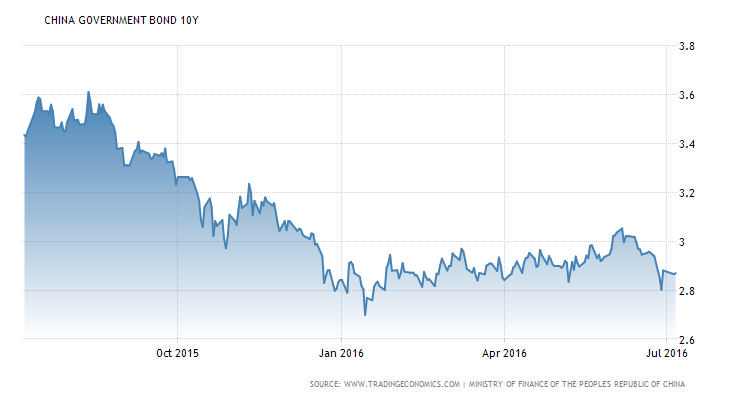
10 year Chinese Government bonds have declined in yield as a result of the international turmoil created by Brexit, but, unlike many of major, international government bonds, they have not made new lows so far:-

china-government-bond-yield 1 yr

Source: Trading Economics, Chinese Ministry of Finance

I believe the recent rally in stocks is a function of the lower yield on bonds. The Chinese government has the whip hand. During the rally and subsequent collapse in the stock market during 2015, the government did not respond in a coordinated manner. Amongst a plethora of initiatives, and I may well have missed some, they relaxed margin requirements, fuelling the speculative bubble,  then, as the shake out gathered momentum, suspended the trading in shares listed on multiple markets. As liquidity conditions became more severe they froze 38 individual trading accounts – including certain algorithmic liquidity providers. The regulators also banned short selling and margin loans enabling investors to sell short on T=) settlement. They forced certain brokers to execute buy orders; one broker was bailed out with a CNY 260bln cash injection.

The rules on insurance companies purchasing stock were relaxed, certain shareholders (specifically SOE’s) were prohibited from selling and, under Announcement 18, senior managers and major shareholder (ones holding a stake of 5 % or more) were threatened with “severe punishment” if they sold shares of any listed company during a period of six months. IPO issuance was also suspended – a recent article from the  FRBSF – China’s IPO Activity and Equity Market Volatility looks at possible reforms of the IPO market. The authorities will not want to make the same mistakes a second time.

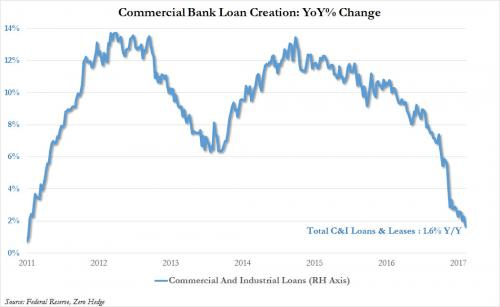
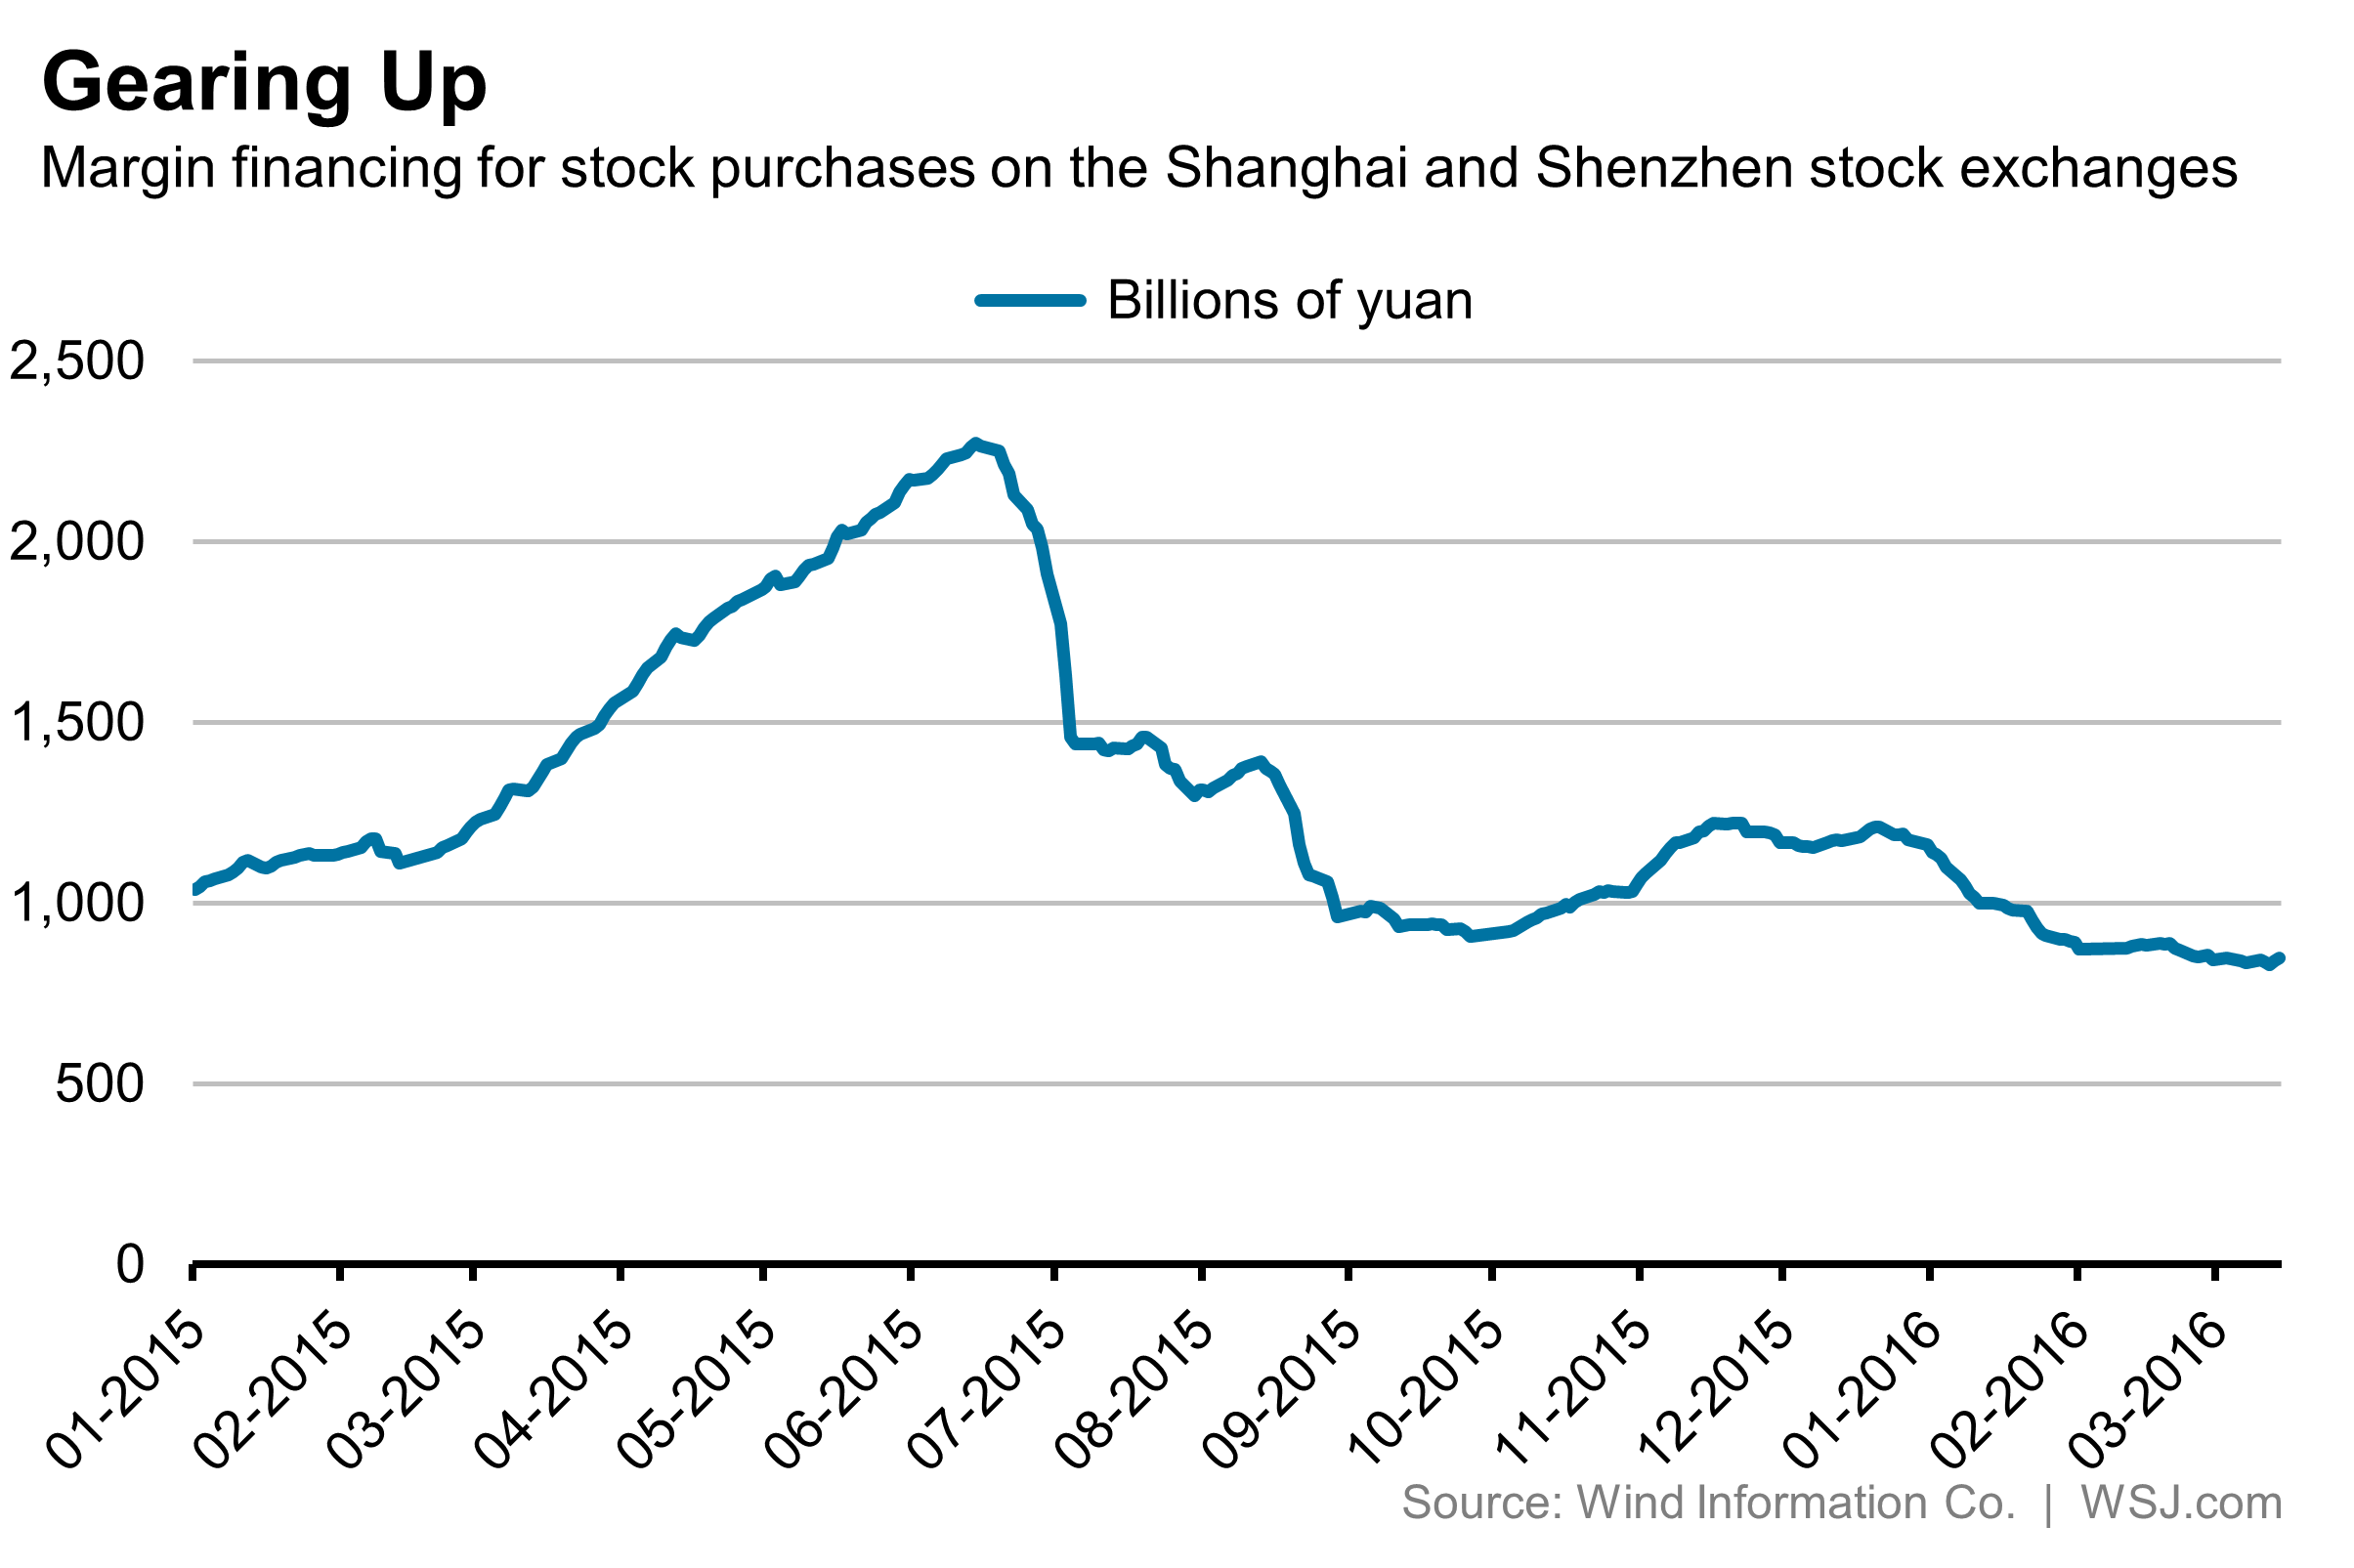
Margin lending has, so far, remained subdued. The chart below has data up to March 2016. Chinese investors were wounded last year but 10 year bond yields have fallen 80bp since June 2015:-

BN-NE269_CMARGI_G_20160321002958

Source: Wind Information Co, WSJ

Returning to the first chart, tracing the fortunes of the CNY, China appears to be exporting its way out of trouble at the expense of its trading partners. Its largest export market is the EU, US followed by Japan and South Korea.  Here is the US census bureau data for US-China trade since 2008:-

Month Exports Imports Balance
Jan-16 8212 37146 -28934
Feb-16 8049 36161 -28112
Mar-16 8952 29853 -20901
Apr-16 8667 32973 -24306
May-16 8518 37535 -29017
Month Exports Imports Balance
Jan-15 9482 38588 -29107
Feb-15 8759 31574 -22814
Mar-15 9882 41139 -31257
Apr-15 9307 36116 -26809
May-15 8763 39073 -30310
Jun-15 9622 41455 -31833
Jul-15 9514 41216 -31703
Aug-15 9169 44142 -34973
Sep-15 9424 45718 -36294
Oct-15 11410 44319 -32908
Nov-15 10618 41908 -31290
Dec-15 10122 37996 -27874
Year
2015 116072 483245 -367173
2014 123621 468484 -344863
2013 121746 440430 -318684
2012 110517 425619 -315103
2011 104122 399371 -295250
2010 91911 364953 -273042
2009 69497 296374 -226877
2008 69733 337773 -268040


Source: US Census Bureau

To help stem the decline in Chinese growth the National Bureau of Statistics has revised the way it calculates GDP. Zero Hedge – China To Boost “Economic Growth” By Changing Definition Of GDP quotes Yu Song of Goldman Sachs:-

Under the new method, the size of the economy is larger than previously estimated2015 GDP was revised up by 1.3% to 11tn USD, the Real growth rate was also revised up (rates vary from year to year and averaged 0.06% (6 bps) over the past 5 years). The upward revision is because China’s R&D expenditure growth has been consistently faster than that of overall GDP–though the difference the change makes to the GDP growth rate is small as R&D is a small part of the economy. The NBS announced 1Q real growth was revised up by 0.04% (4bps), but it did not specify whether the growth rate is now 6.8% yoy or remains at 6.7% yoy. We believe the latter case is slightly more likely as an upward revision would have been highlighted. A higher trend level would mean 2Q GDP growth should be higher as well. As a result, we revise our Q2 real GDP growth forecast to 6.7% yoy from 6.6% yoy previously with slight upside risk to our full-year forecast of 6.6% yoy.

Whether the markets are taken in by this sleight of hand remains to be seen, but, when statisticians are making comparisons in a couple of years from now, the higher growth rate will most likely be taken as gospel.

State Owned Enterprises are investing even as the private sector continues to withdraw – Reuters – China needs the private sector to step up. Residential and commercial construction continues to grow despite 718 M2 of vacant floor space. It is worth remembering that 75% of Chinese individual net worth is tied up in Real-Estate – in the US the figure is 28%. Lagarde’s second in command, David Lipton, of the IMF said China had made only “limited progress” in reducing its debt load but government bonds are near historic lows, making non-performing loans easier to extend. Back in the summer of 2014 I wrote about the importance of the housing market – Macro Letter – No 18 – 29-08-2014The second arrow of Likonomics and the Chinese property market, the stock market subsequently rallied but then collapsed. Now the policy of “rebalancing” seems to be taking a breather.

Chinese stocks, meanwhile, are cheap relative to many other markets. As at the end of June the CAPE was 12.4, PE 6.1 – the lowest of any major stock market globally, PC 3.2, PB 0.8, PS 0.6 and the dividend yield was 4.7%. Only the differential between the dividend yield and the 10 year bond yield (1.93%) looks unremarkable.

Chinese Q2 GDP data is released next week, an unnamed official suggested the PBoC might still have room to cut interest rates, although any further loosening of bank reserve requirements appears unlikely. As we head into the summer lull, Chinese stocks, especially those with an exposure to infrastructure, may offer an excellent buying opportunity.

Central Banks – Ah Aaaaahhh! – Saviours of the Universe?

400dpiLogo

Macro Letter – No 48 – 29-01-2016

Central Banks – Ah Aaaaahhh! – Saviours of the Universe?

Flash-Gordon-flash-gordon-23432257-1014-1600

Copryright: Universal Pictures

  • Freight rates have fallen below 2008 levels
  • With the oil price below $30 many US producers are unprofitable
  • The Fed has tightened but global QE gathers pace
  • Chinese stimulus is fighting domestic strong headwinds

Just in case you’re not familiar with it here is a You Tube video of the famous Queen song. It is seven years since the Great Financial Crisis; major stock markets are still relatively close to their highs and major government bond yields remain near historic lows. If another crisis is about to engulf the developed world, do the central banks (CBs) have the means to avert catastrophe once again? Here are some of the factors which may help us to reach a conclusion.

Freight Rates

Last week I was asked to comment of the prospects for commodity prices, especially energy. Setting aside the geo-politics of oil production, I looked at the Baltic Dry Index (BDI) which has been plumbing fresh depths this year – 337 (28/1/16) down from August 2015 highs of 1200. Back in May 2008 it touched 11,440 – only to plummet to 715 by November of the same year. How helpful is the BDI at predicting the direction of the economy? Not very – as this 2009 article from Business Insider – Shipping Rates Are Lousy For Predicting The Economy – points out. Nonetheless, the weakness in freight rates is indicative of an inherent lack of demand for goods. The chart below is from an article published by Zero Hedge at the beginning of January – they quote research from Deutsche Bank.

BDI_-_1985_-_2016 (4)

Source: Zerohedge

A “Perfect Storm Is Coming” Deutsche Warns As Baltic Dry Falls To New Record Low:

…a “perfect storm” is brewing in the dry bulk industry, as year-end improvements in rates failed to materialize, which indicates a looming surge in bankruptcies.

The improvement in dry bulk rates we expected into year-end has not materialized.

…we believe a number of dry bulk companies are contemplating asset sales to raise liquidity, lower daily cash burn, and reduce capital commitments. The glut of “for sale” tonnage has negative implications for asset and equity values. More critically, it can easily lead to breaches in loan-to-value covenants at many dry bulk companies, shortening the cash runway and likely necessitating additional dilutive actions.

Dry bulk companies generally have enough cash for the next 1yr or so, but most are not well positioned for another leg down in asset values.

China

The slowing and rebalancing of the Chinese economy may be having a significant impact on global trade flows. Here is a recent article on the subject from Mauldin Economics – China’s Year of the Monkees:-

China isn’t the only reason markets got off to a terrible start this month, but it is definitely a big factor (at least psychologically). Between impractical circuit breakers, weaker economic data, stronger capital controls, and renewed currency confusion, China has investors everywhere scratching their heads.

When we focused on China back in August (see “When China Stopped Acting Chinese”), my best sources said the Chinese economy was on a much better footing than its stock market, which was in utter chaos. While the manufacturing sector was clearly in a slump, the services sector was pulling more than its fair share of the GDP load. Those same sources have new data now, which leads them to quite different conclusions.

…Now, it may well be the case that China’s economy is faltering, but its GDP data is not the best evidence.

…To whom can we turn for reliable data? My go-to source is Leland Miller and company at the China Beige Book.

…China Beige Book started collecting data in 2010. For the entire time since then, the Chinese economy has been in what Leland calls “stable deceleration.” Slowing down, but in an orderly way that has generally avoided anything resembling crisis. 

…China Beige Book noticed in mid-2014 that Chinese businesses had changed their behavior. Instead of responding to slower growth by doubling down and building more capacity, they did the rational thing (at least from a Western point of view): they curbed capital investment and hoarded cash. With Beijing still injecting cash that businesses refused to spend, the liquidity that flowed into Chinese stocks produced the massive rally that peaked in mid-2015. It also allowed money to begin to flow offshore in larger amounts. I mean really massively larger amounts.

Dealing with a Different China

China Beige Book’s fourth-quarter report revealed a rude interruption to the positive “stable deceleration” trend. Their observers in cities all over that vast country reported weakness in every sector of the economy. Capital expenditures dropped sharply; there were signs of price deflation and labor market weakness; and both manufacturing and service activity slowed markedly.

That last point deserves some comment. China experts everywhere tell us the country is transitioning from manufacturing for export to supplying consumer-driven services. So if both manufacturing and service activity are slowing, is that transition still happening?

The answer might be “yes” if manufacturing were decelerating faster than services. For this purpose, relative growth is what counts. Unfortunately, manufacturing is slowing while service activity is not picking up all the slack. That’s not the combination we want to see.

Something else China Beige Book noticed last quarter: both business and consumer loan volume did not grow in response to lower interest rates. That’s an important change, and probably not a good one. It means monetary stimulus from Beijing can’t save the day this time. Leland thinks fiscal stimulus isn’t likely to help, either. Like other governments and their central banks, China is running out of economic ammunition.

Mauldin goes on to discuss the devaluation of the RMB – which I also discussed in my last letter – Is the ascension of the RMB to the SDR basket more than merely symbolic? The RMB has been closely pegged to the US$ since 1978 though with more latitude since 2005, this has meant a steady appreciation in its currency relative to many of its emerging market trading partners. Now, as China begins to move towards full convertibility, the RMB will begin to float more freely. Here is a five year chart of the Indian Rupee and the CNY vs the US$:-

INR vs RMB - Yahoo

Source: Yahoo finance

The Chinese currency could sink significantly should their government deem it necessary, however, expectations of a collapse of growth in China may be premature as this article from the Peterson Institute – The Price of Oil, China, and Stock Market Herding – indicates:-

A collapse of growth in China would indeed be a world changing event. But there is just no evidence of such a collapse. At most there is suggestive evidence of a mild slowdown, and even that is far from certain. The mechanical effects of such a mild decrease on the US economy should, by all accounts, and all the models we have, be limited. Trade channels are limited (US exports to China represent less than 2 percent of GDP), and so are financial linkages. The main effect of a slowdown in China would be through lower commodity prices, which should help rather than hurt the United States.

Peterson go on to suggest:-

Maybe we should not believe the market commentaries. Maybe it was neither oil nor China. Maybe what we are seeing is a delayed reaction to the slowdown in the world economy, a slowdown that has now gone on for a few years. While there has been no significant news in the last two weeks, maybe markets are only realizing that growth in emerging markets will be lower for a long time, that growth in advanced economies will be unexciting. Maybe…

I think the explanation is largely elsewhere. I believe that to a large extent, herding is at play. If other investors sell, it must be because they know something you do not know. Thus, you should sell, and you do, and so down go stock prices. Why now? Perhaps because we have entered a period of higher uncertainty. The world economy, at the start of 2016, is a genuinely confusing place. Political uncertainty at home and geopolitical uncertainty abroad are both high. The Fed has entered a new regime. The ability of the Chinese government to control its economy is in question. In that environment, in the stock market just as in the presidential election campaign, it is easier for the bears to win the argument, for stock markets to fall, and, on the political front, for fearmongers to gain popularity.

They are honest enough to admit that economics won’t provide the answers.

Energy Prices

The June 2015 BP – Statistical Review of World Energy – made the following comments:-

Global primary energy consumption increased by just 0.9% in 2014, a marked deceleration over 2013 (+2.0%) and well below the 10-year average of 2.1%. Growth in 2014 slowed for every fuel other than nuclear power, which was also the only fuel to grow at an above-average rate. Growth was significantly below the 10-year average for Asia Pacific, Europe & Eurasia, and South & Central America. Oil remained the world’s leading fuel, with 32.6% of global energy consumption, but lost market share for the fifteenth consecutive year.

Although emerging economies continued to dominate the growth in global energy consumption, growth in these countries (+2.4%) was well below its 10-year average of 4.2%. China (+2.6%) and India (+7.1%) recorded the largest national increments to global energy consumption. OECD consumption fell by 0.9%, which was a larger fall than the recent historical average. A second consecutive year of robust US growth (+1.2%) was more than offset by declines in energy consumption in the EU (-3.9%) and Japan (-3.0%). The fall in EU energy consumption was the second-largest percentage decline on record (exceeded only in the aftermath of the financial crisis in 2009).

The FT – The world energy outlook in five charts – looked at five charts from the IEA World Energy Outlook – November 2015:-

Demand_Growth_in_Asia

Source: IEA

With 315m of its population expected to live in urban areas by 2040, and its manufacturing base expanding, India is forecast to account for quarter of global energy demand growth by 2040, up from about 6 per cent currently.

India_moving_to_centre

Source: IEA

Oil demand in India is expected to increase by more than in any other country to about 10m barrels per day (bpd). The country is also forecast to become the world’s largest coal importer in five years. But India is also expected to rely on solar and wind power to have a 40 per cent share of non-fossil fuel capacity by 2030.

A_new_chapter_in_Chinas_growth_story

Source: IEA

China’s total energy demand is set to nearly double that of the US by 2040. But a structural shift in the Asian country away from investment-led growth to domestic-demand based economy will “mean that 85 per cent less energy is required to generate each unit of future economic growth than was the case in the past 25 years.”

A_new_balancing_item_in_the_oil_market

Source: IEA

US shale oil production is expected to “stumble” in the short term, but rise as oil price recovers. However the IEA does not expect crude oil to reach $80 a barrel until 2020, under its “central scenario”. The chart shows that if prices out to 2020 remain under $60 per barrel, production will decline sharply.

Power_is_leading_the_transformation

Source: IEA

Renewables are set to overtake coal to become the largest source of power by 2030. The share of coal in the production of electricity will fall from 41 per cent to 30 per cent by 2040, while renewables will account for more than half the increase in electricity generation by then.

The cost of solar energy continues to fall and is now set to “eclipse” natural gas, as this article from Seeking Alpha by Siddharth Dalal – Falling Solar Costs: End Of Natural Gas Is Near? Explains:-

A gas turbine power plant uses 11,371 Btu/kWh. The current price utilities are paying per Btu of natural gas are $3.23/1000 cubic feet. 1000 cubic feet of natural gas have 1,020,000 BTUs. So $3.23 for 90kWh. That translates to 3.59c/kWh in fuel costs alone.

A combined cycle power plant uses 7667 Btu/kWh, which translates to 2.42c/kWh.

Adding in operating and maintenance costs, we get 4.11c/kWh for gas turbines and 3.3c/kWh for combined cycle power plants. This still doesn’t include any construction costs.

…The average solar PPA is likely to go under 4c/kWh next year. Note that this is the total cost that the utility pays and includes all costs.

And the trend puts total solar PPA costs under gas turbine fuel costs and competitive with combined cycle plant total operating costs next year.

At this point it becomes a no brainer for a utility to buy cheap solar PPAs compared to building their own gas power plants.

The only problem here is that gas plants are dispatchable, while solar is not. This is a problem that is easily solved by batteries. So utilities would be better served by spending capex on batteries as opposed to any kind of gas plant, especially anything for peak generation.

The influence of the oil price, whilst diminishing, still dominates. In the near term the importance of the oil price on financial market prices will relate to the breakeven cost of production for companies involved in oil exploration. Oil companies have shelved more than $400bln of planned investment since 2014. The FT – US junk-rated energy debt hits two-decade lowtakes up the story:-

US-High Yield - Thompson Reuters

Source: Thomson Reuters Datastream, FT

The average high-yield energy bond has slid to just 56 cents on the dollar, below levels touched during the financial crisis in 2008-09, as investors brace for a wave of bankruptcies.

…The US shale revolution which sent the country’s oil production soaring from 2009 to 2015 was led by small and midsized companies that typically borrowed to finance their growth. They sold $241bn worth of bonds during 2007-15 and many are now struggling under the debts they took on.

Very few US shale oil developments can be profitable with crude at about $30 a barrel, industry executives and advisers say. Production costs in shale have fallen as much as 40 per cent, but that has not been enough to keep pace with the decline in oil prices.

…On Friday, Moody’s placed 120 oil and gas companies on review for downgrade, including 69 in the US.

…The yield on the Bank of America Merrill Lynch US energy high-yield index has climbed to the highest level since the index was created, rising to 19.3 per cent last week, surpassing the 17 per cent peak hit in late 2008.

More than half of junk-rated energy groups in the US have fallen into distress territory, where bond yields rise more than 1,000 basis points above their benchmark Treasury counterpart, according to S&P.

All other things equal, the price of oil is unlikely to rally much from these levels, but, outside the US, geo-political risks exist which may create an upward bias. Many Middle Eastern countries have made assumptions about the oil price in their estimates of tax receipts. Saudi Arabia has responded to lower revenues by radical cuts in public spending and privatisations – including a proposed IPO for Saudi Aramco. As The Guardian – Saudi Aramco privatisation plans shock oil sector – explains, it will certainly be difficult to value – market capitalisation estimates range from $1trln to $10trln.

Outright energy company bankruptcies are likely to be relatively subdued, unless interest rates rise dramatically – these companies locked in extremely attractive borrowing rates and their bankers will prefer to renegotiate payment schedules rather than write off the loans completely. New issuance, however, will be a rare phenomenon.

Technology

“We don’t want technology simply because it’s dazzling. We want it, create it and support it because it improves people’s lives.”

These words were uttered by Canadian Prime Minister, Justin Trudeau, at Davos last week. The commodity markets have been dealing with technology since the rise of Sumer. The Manhattan Institutes – SHALE 2.0 Technology and the Coming Big-Data Revolution in America’s Shale Oil Fields highlights some examples which go a long way to explaining the downward trajectory in oil prices over the last 18 months – emphasis is mine:-

John Shaw, chair of Harvard’s Earth and Planetary Sciences Department, recently observed: “It’s fair to say we’re not at the end of this [shale] era, we’re at the very beginning.” He is precisely correct. In recent years, the technology deployed in America’s shale fields has advanced more rapidly than in any other segment of the energy industry. Shale 2.0 promises to ultimately yield break-even costs of $5–$20 per barrel—in the same range as Saudi Arabia’s vaunted low-cost fields.

…Compared with 1986—the last time the world was oversupplied with oil—there are now 2 billion more people living on earth, the world economy is $30 trillion bigger, and 30 million more barrels of oil are consumed daily. The current 33 billion-barrel annual global appetite for crude will undoubtedly rise in coming decades. Considering that fluctuations in supply of 1–2 MMbd can swing global oil prices, the infusion of 4 MMbd from U.S. shale did to petroleum prices precisely what would be expected in cyclical markets with huge underlying productive capacity.

Shipbuilding has also benefitted from technological advances in a variety of areas, not just fuel efficiency. This article (please excuse the author’s English) from Marine Insight – 7 Technologies That Can Change The Future of Shipbuilding – highlights several, I’ve chosen five:-

3-D Printing Technology:…Recently, NSWC Carderock made a fabricated model of the hospital ship USNS Comfort (T-AH 20) using its 3-D printer, first uploading CAD drawings of ship model in it. Further developments in this process can lead the industry to use this technique to build complex geometries of ship like bulbous bow easily. The prospect of using 3-D printers to seek quick replacement of ship’s part for repairing purpose is also being investigated. The Economist claims use this technology to be the “Third Industrial Revolution“.

Shipbuilding Robotics: Recent trends suggest that the shipbuilding industry is recognizing robotics as a driver of efficiency along with a method to prevent workers from doing dangerous tasks such as welding. The shortage of skilled labour is also one of the reasons to look upon robotics. Robots can carry out welding, blasting, painting, heavy lifting and other tasks in shipyards.

LNG Fueled engines

…In the LNG engines, CO2 emission is reduced by 20-25% as compared to diesel engines, NOX emissions are cut by almost 92%, while SOX and particulates emissions are almost completely eliminated.

…Besides being an environmental friendly fuel, LNG is also cheaper than diesel, which helps the ship to save significant amount of money over time.

…Solar & Wind Powered Ships:

…The world’s largest solar powered ship named ‘Turanor’ is a 100 metric ton catamaran which motored around the world without using any fuel and is currently being used as a research vessel. Though exclusive solar or wind powered ships look commercially and practically not viable today, they can’t be ruled out of future use with more technical advancements.

Recently, many technologies have come which support the big ships to reduce fuel consumption by utilizing solar panels or rigid sails. A device named Energy Sail (patent pending) has been developed by Eco Marine Power will help the ships to extract power from wind and sun so as to reduce fuel costs and emission of greenhouse gases. It is exclusively designed for shipping and can be fitted to wide variety of vessels from oil carrier to patrol ships.

Buckypaper: Buckypaper is a thin sheet made up of carbon nanotubes (CNT). Each CNT is 50,000 thinner than human air. Comparing with the conventional shipbuilding material (i.e. steel), buckypaper is 1/10th the weight of steel but potentially 500 times stronger in strength  and 2 times harder than diamond when its sheets are compiled to form a composite. The vessel built from this lighter material would require less fuel, hence increasing energy efficiency. It is corrosion resistant and flame retardant which could prevent fire on ships. A research has already been initiated for the use of buckypaper as a construction material of a future aeroplane. So, a similar trend can’t be ruled out in case of shipbuilding.

Shipping has always been a cyclical business, driven by global demand for freight on the one hand and improvements in technology on the other. The cost of production continues to fall, old inventory rapidly becomes uncompetitive and obsolete. The other factor effecting the cycle is the cost of finance; this is true also of energy exploration and development. Which brings us to the actions of the CBs.

The central role of the central banks

Had $100 per barrel oil encouraged a rise in consumer price inflation in the major economies, it might have been appropriate for their CBs to raise interest rates, however, high levels of debt kept inflation subdued. The “unintended consequences” or, perhaps we should say “collateral damage” of allowing interest rates to remain unrealistically low, is overinvestment. The BIS – Self-oriented monetary policy, global financial markets and excess volatility of international capital flows – looks at the effect developed country CB policy – specifically the Federal Reserve – has had on emerging markets:-

A major policy question arising from these events is whether US monetary policy imparts a global ‘externality’ through spillover effects on world capital flows, credit growth and asset prices. Many policy makers in emerging markets (e.g. Rajan, 2014) have argued that the US Federal Reserve should adjust its monetary policy decisions to take account of the excess sensitivity of international capital flows to US policy. This criticism questions the view that a ‘self-oriented’ monetary policy based on inflation targeting principles represents an efficient mechanism for the world monetary system (e.g. Obstfeld and Rogoff, 2002), without the need for any cross-country coordination of policies.

…Our results indicate that the simple prescriptions about the benefits of flexible exchange rates and inflation targeting are very unlikely to hold in a global financial environment dominated by the currency and policy of a large financial centre, such as the current situation with the US dollar and US monetary policy. Our preliminary analysis does suggest however that an optimal monetary policy can substantially improve the workings of the international system, even in the absence of direct intervention in capital markets through macro-prudential policies or capital controls. Moreover, under the specific assumptions maintained in this paper, this outcome can still be consistent with national independence in policy, or in other words, a system of ‘self-oriented’ monetary policy making.

Whether CBs should consider the international implications of their actions is not a new subject, but this Cobden Centre article by Alisdair Macleod – Why the Fed Will Never Succeed – suggests that the Fed should be mandated to accept a broader role:-

That the Fed thinks it is only responsible to the American people for its actions when they affect all nations is an abrogation of its duty as issuer of the reserve currency to the rest of the world, and it is therefore not surprising that the new kids on the block, such as China, Russia and their Asian friends, are laying plans to gain independence from the dollar-dominated system. The absence of comment from other central banks in the advanced nations on this important subject should also worry us, because they appear to be acting as mute supporters for the Fed’s group-think.

This is the context in which we need to clarify the effects of the Fed’s monetary policy. The fundamental question is actually far broader than whether or not the Fed should be raising rates: rather, should the Fed be managing interest rates at all? Before we can answer this question, we have to understand the relationship between credit and the business cycle.

There are two types of economic activity, one that correctly anticipates consumer demand and is successful, and one that fails to do so. In free markets the failures are closed down quickly, and the scarce economic resources tied up in them are redeployed towards more successful activities. A sound-money economy quickly eliminates business errors, so this self-cleansing action ensures there is no build-up of malinvestments and the associated debt that goes with it.

When there is stimulus from monetary inflation, it is inevitable that the strict discipline of genuine profitability that should guide all commercial enterprises takes a back seat. Easy money and interest rates lowered to stimulate demand distort perceptions of risk, over-values financial assets, and encourages businesses to take on projects that are not genuinely profitable. Furthermore, the owners of failing businesses find it possible to run up more debts, rather than face commercial reality. The result is a growing accumulation of malinvestments whose liquidation is deferred into the future.

Macleod goes on to discuss the Cantillon effect, at what point we are in the Credit Cycle and why the Fed decided to raise rates now:-

We must put ourselves in the Fed’s shoes to try to understand why it has raised rates. It has seen the official unemployment rate decline for a prolonged period, and more recently energy and commodity prices have fallen sharply. Assuming it believes government unemployment figures, as well as the GDP and its deflator, the Fed is likely to think the economy has at least stabilised and is fundamentally healthy. That being the case, it will take the view the business cycle has turned. Note, business cycle, not credit-driven business cycle: the Fed doesn’t accept monetary policy is responsible for cyclical phenomena. Therefore, demand for energy and commodities is expected to increase on a one or two-year view, so inflation can be expected to pick up towards the 2% target, particularly when the falls in commodity and energy prices drop out of the back-end of the inflation numbers. Note again, inflation is thought to be a demand-for-goods phenomenon, not a monetary phenomenon, though according to the Fed, monetary policy can be used to stimulate or control it.

Unfortunately, the evidence from multiple surveys is that after nine years since the Lehman crisis the state of the economy remains suppressed while debt has continued to increase, so this cycle is not in the normal pattern. It is clear from the evidence that the American economy, in common with the European and Japanese, is overburdened by the accumulation of malinvestments and associated debt. Furthermore, nine years of wealth attrition through monetary inflation (as described above) has reduced the purchasing power of the average consumer’s earnings significantly in real terms. So instead of a phase of sustainable growth, it is likely America has arrived at a point where the economy can no longer bear the depredations of further “monetary stimulus”. It is also increasingly clear that a relatively small rise in the general interest rate level will bring on the next crisis.

So what will the Fed – and, for that matter, other major CBs – do? I look back to the crisis of 2008/2009 – one of the unique aspects of this period was the coordinated action of the big five: the Fed, ECB, BoJ, BoE and SNB. In 1987 the Fed was the “saviour of the universe”. Their actions became so transparent in the years that followed, that the phase “Greenspan Put” was coined to describe the way the Fed saved stock market investors and corporate creditors. CEPR – Deleveraging? What deleveraging? which I have quoted from in previous letters, is an excellent introduction to the unintended consequences of CB largesse.

Since 2009 economic growth has remained sluggish; this has occurred despite historically low interest rates – it’s not unreasonable to surmise that the massive overhang of debt, globally, is weighing on both demand pull inflation and economic growth. Stock buy-backs have been rife and the long inverted relationship between dividend yields and government bond yields has reversed. Paying higher dividends may be consistent with diversifying a company’s investor base but buying back stock suggests a lack of imagination by the “C” Suite. Or perhaps these executives are uncomfortable investing when interest rates are artificially low.

I believe the vast majority of the rise in stock markets since 2009 has been the result of CB policy, therefore the Fed rate increase is highly significant. The actions of the other CBs – and here I would include the PBoC alongside the big five – is also of significant importance. Whilst the Fed has tightened the ECB and the PBoC continue to ease. The Fed appears determined to raise rates again, but the other CBs are likely to neutralise the overall effect. Currency markets will take the majority of the strain, as they have been for the last couple of years.

A collapse in equity markets will puncture confidence and this will undermine growth prospects globally. Whilst some of the malinvestments of the last seven years will be unwound, I expect CBs to provide further support. The BoJ is currently the only CB with an overt policy of “qualitative easing” – by which I mean the purchasing of common stock – I fully expect the other CBs to follow to adopt a similar approach. For some radical ideas on this subject this paper by Professor Roger Farmer – Qualitative Easing: How it Works and Why it Matters – which was presented at the St Louis Federal Reserve conference in 2012 – makes interesting reading.

Investment opportunities

In comparison to Europe– especially Germany – the US economy is relatively immune to the weakness of China. This is already being reflected in both the currency and stocks markets. The trend is likely to continue. In the emerging market arena Brazil still looks sickly and the plummeting price of oil isn’t helping, meanwhile India should be a beneficiary of cheaper oil. Some High yield non-energy bonds are likely to be “tarred” (pardon the pun) with the energy brush. Meanwhile, from an international perspective the US$ remains robust even as the US$ Index approaches resistance at 100.

US_Index_-_5_yr_Marketwatch

Source: Marketwatch

Is the ascension of the RMB to the SDR basket more than merely symbolic?

400dpiLogo

Macro Letter – Supplemental – No 2 – 11-12-2015

Is the ascension of the RMB to the SDR basket more than merely symbolic?

  • Chinese rebalancing towards domestic consumption changes the balance of trade
  • China’s largest trading partner remains the EU, making a US$ peg sub-optimal
  • SDR currencies offer the best liquidity for intervention or speculation
  • International investment will be dramatically enhanced by full convertibility

I’ve changed my view of the importance of the RMBs inclusion in the SDR. Initially I thought this a purely symbolic action but, having discussed the issue with several economists and ex-Central Bankers (including one from the PBoC) I believe this a logical move towards free convertibility of the RMB.

For many years the RMB has been pegged to the US$. During the early part of this century it rose relative to its neighbours. This was not such a great imposition on the economy since annual GDP growth was still in double figures.

After the great financial recession of 2008 things changed. New economic policies focused on increasing domestic consumption. At the same time the Chinese economy began to slow dramatically as a result of over-investment, especially in primary industries, meanwhile, the benefits of cheap labour, which had driven China’s mercantilist expansion during the past 25 years, showed signs of fatigue.

After 2008, the US embarked on aggressive quantitative easing which eventually began to foster new domestic employment opportunities – in turn leading to a recovery of the fortunes of the US$. Earlier this year the PBoC devalued the RMB albeit to a small degree.

If you were the PBoC what would you do?

China is rebalancing towards domestic consumption at a pace which would be almost inconceivable in any other country. The implications of this shift include an increase in imports and a structural adjustment in the momentum of the trade surplus. China is moving on from simply being the world’s manufacturer to become a trading nation. A freely convertible currency would reduce frictions in trade and encourage foreign direct investment. The downside to this regime change is the volatility of the exchange rate.

At $3.5trln the PBoC has the largest foreign reserves of any Central Bank. This has primarily been a function of their peg against the US$, although they have actively sought to diversify in to EUR and even the “barbarous relic” gold. During the last 18 months the bank has drawn down on some of those reserves (they peaked at $3.9trln in May 2014) as it managed a devaluation versus the US$ which has fallen from RMBUSD 6.05 in January 2014 to RMBUSD 6.49 today (8-12-2015).

Has the benefit of the US$ peg now run its course? During the period of strong – export led – growth, China was under significant international political pressure to allow the RMB to rise against the US$. The perception is that they resisted international interference, but over the last 20 years the RMB has risen by around 30%. Nonetheless, market commentators immediately seized on the devaluation – especially since August – as a sign that the Chinese were engineering an export led recovery at the expense of the US. This 2013 paper from the Bundesbank – China‘s role in global inflation dynamics suggests there may be some substance to these concerns:-

The overall share of international inflation explained by Chinese shocks is notable (about 5 percent on average over all countries but not more than 13 percent in each region). This suggests that monetary policy makers should take macroeconomic developments in China into account when stabilizing domestic inflation rates; (ii) Direct channels (via import and export prices) and indirect channels (via greater exposure to foreign competition and commodity prices) both seem to matter; (iii) Differences in trade (overall and with China) and in commodity exposure help explaining cross-country differences in price responses.

Nonetheless, the authors note that, between 2002 and 2011, the “supply shock” from cheap Chinese goods explained only 1% of changes in consumer prices outside China, whilst the “demand shock”, from rapid Chinese, growth accounted for 3.6% of changes in global consumer prices. 95% of the variation in global inflation were due to non-Chinese factors.

As the Trans Pacific Partnership comes into effect, China needs to embark on a series of bilateral trade agreements. After the US, its largest trading partners are Japan, South Korea, Taiwan, Germany, Australia and Malaysia, however, as a currency trading block the Euro Area is preeminent.

There are two alternatives to a US$ peg, the first is to manage the RMB effective exchange rate, but this would be expensive due to the multiple currencies involved, the second option is to peg the RMB to the SDR basket. Both politically and economically this acknowledges China’s position as the second largest economy. It also heralds another incremental change in perception about the pre-eminence of the US$ as a reserve currency.

The RMB will be included in the SDR from October 2016. As the Chinese administration moves towards free-convertibility it is likely that they will start by widening the degree to which the currency can fluctuate. By managing the RMB versus the other SDR currencies they can take advantage of the liquidity these currencies provide and the lower volatility that the SDR basket has relative to its constituents. This will also allow the PBoC to intervene to stem the largest speculative currency flows. Table below shows the annual level of trade by region (2011):-

Region Exports Imports Total trade Trade balance
 European Union 356 211.2 567.2 144.8
 United States 324.5 122.2 446.7 202.3
 Hong Kong 268 15.5 283.5 252.5
 ASEAN 170.1 192.8 362.9 -22.7
 Japan 148.3 194.6 342.9 -46.3


Source: China National Statistics Bureau

Capital Flows

Trade is one aspect of China’s development, the other is capital; the Kansas City Federal Reserve Macro Bulletin – Global Capital Flows from China – takes up the story:-

In 2014-15, China experienced five consecutive quarters of capital outflows for the first time since 2000, and the annual volume of outflows is at a record level. If growth expectations continue to soften, this trend may continue in the near future.

China has been an active investor in Africa and other resource-rich regions, but, as its competitive advantages from labour dissipate, external investment will become far more important. Another reason to allow full convertibility.

Technical issues and challenges

The two requirements for joining the SDR are; being a larger exporter – which is no issue for China -and having a freely accessible currency. They still have some way to go on the latter, but China now has more than two dozen swap lines with foreign central banks, has promoted offshore trading and abolished quotas for foreign central banks and sovereign wealth funds investing in mainland bonds. 

RMB fixing – the PBoC as a participating SDR central bank, must provide the IMF with a daily fix. Currently there is a gap between domestic and the offshore RMB rate, closing that gap will be an operational challenge.

SDR currencies are weighted based on trade and reserve status – Marc Chandler – China And The Pull Of The SDR – elaborates:-

Given China’s export prowess, it suggests the yuan should be a major currency in the SDR. However, as a reserve asset, it is very small. The IMF estimates the yuan’s share of reserves at a minuscule 1.1%.

For more on the technical aspects of the SDR this paper from Europacifica – The RMB in the SDR and why Australia should care offers more insights.

In October China issued its first Treasury bill on the international market. Here is how it was reported by the FT – China completes first London debt sale:-

Spencer Lake, global head of capital financing at HSBC, one of the banks that arranged the sale, called the transaction a milestone in the internationalisation of the renminbi, noting that it was the first debt offering in any currency from the PBoC outside China.

“This strategic move demonstrates the clear commitment by the Chinese authorities to grow the offshore bond market and the confidence in the City of London as a leading renminbi hub for future activities,” he said.

“The PBoC bond will give a genuine boost to liquidity, market confidence and provide investors with the quality that they demand.”

Who will buy the non-performing loans?

Another reason China may want to move towards free convertibility is to encourage foreign investment. An article from Zero-Hedge – One Analyst Says China’s Banking Sector Is Sitting On A $3 Trillion Neutron Bomb explains:-

If one very conservatively assumes that loans are about half of the total asset base (realistically 60-70%), and applies an 20% NPL to this number instead of the official 1.5% NPL estimate, the capital shortfall is a staggering $3 trillion. 

That, as we suggested three weeks ago, may help to explain why round after round of liquidity injections (via RRR cuts, LTROs, and various short- and medium-term financing ops) haven’t done much to boost the credit impulse. In short, banks may be quietly soaking up the funds not to lend them out, but to plug a giant, $3 trillion, solvency shortfall. 

Conclusion

I believe the inclusion of the RMB in the SDR is more than simply symbolic. It will allow the PBoC to move away from a US$ peg, widen it trading bands and balance its currency more effectively relative to its main trading partners. PBoC Intervention can be generally confined to SDR currencies which, due to their high liquidity, will be the cross-currency pairs of choice for speculators.

An Autumn Reassessment – Will the fallout from China favour equities, bonds or the US Dollar?

400dpiLogo

Macro Letter – No 40 – 28-08-2015

An Autumn Reassessment – Will the fallout from China favour equities, bonds or the US Dollar?

  • The FOMC rate increase may be delayed
  • An equity market correction is technically overdue
  • Long duration bonds offer defensive value
  • The US$ should out-perform after the “risk-off” phase has run its course

It had been a typical summer market until the past fortnight. Major markets had been range bound, pending the widely-anticipated rate increase from the FOMC and the prospect of similar, though less assured, action from the BoE. The ECB, of course, has been preoccupied with the next Greek bailout, whilst EU politicians wrestle with the life and death implications of the migrant crisis.

What seems to have changed market sentiment was the PBoC’s decision to engineer a 3% devaluation in the value of the RMB against the US$. This move acted as a catalyst for global markets, commentators seizing on the news as evidence that the Chinese administration has lost control of its rapidly slowing economy. As to what China should do next, opinion is divided between those who think any conciliatory gesture is a sign of weakness and those who believe the administration must act swiftly and with purpose, to avoid an inexorable and potentially catastrophic deterioration in economic conditions. The PBoC reduced interest rates again on Wednesday by 25bp – 1yr Lending Rate to 4.6% and 1yr Deposit Rate to 1.75% – they also reduced the Reserve Ratio requirement from 18.5% to 18%. This is not exactly dramatic but it leaves them with the flexibility to act again should the situation worsen.

Markets, especially equities, have become more volatile. The largest bond markets have rallied as equities have fallen. This is entirely normal; that the move has occurred during August, when liquidity is low, has, perhaps, conspired to exacerbate the move – technical traders will await confirmation when new lows are seen in equity markets during normal liquidity conditions.

Has anything changed in China?    

The Chinese economy has been rebalancing since 2012 – this article from Michael Pettis – Rebalancing and long term growth – from September 2013 provides an excellent insight. The process still has a number of years to run. Meanwhile, pegging the RMB to the US$ has made China uncompetitive in certain export markets. Other countries have filled the void, Mexico, for example, now appears to have a competitive advantage in terms of labour costs whilst transportation costs are definitely in its favour when meeting demand for goods from the US. This April 2013 article from the Financial Times – Mexican labour: cheaper than China elaborates:-

Mexico_vs_China_-_wages_Merrill_Lynch

Source: BofA Merrill Lynch

China’s economy continues to slow, a lower RMB is not unexpected but how are the major economies faring under these conditions?

US growth and lower oil prices?

I recently wrote about the US economy – US Growth and employment – can the boon of cheap energy eclipse the collapse of energy investment? My conclusion was that US stock earnings were improving. The majority of Q2 earnings reports have been released and the improvement is broad-based. This article from Pictet – US and Europe Q2 Earnings Results: positive surprises but no game changer which was published last week, looks at both the US and Europe:-

US earnings: strong profit margins and strong financials

Almost all S&P500 (456) companies published their Q2 results. At the sales level, 46% of companies beat their estimates; meanwhile, the corresponding number was 54% at the net profit level. Companies beat their sales and net profit estimates by 1.2% and 2.2% respectively, thus demonstrating strong cost control. Financials were big contributors as sales and net profit surprises came out at +0.5% and 1.5% respectively excluding this sector. Banks (37% of financials) beat sales estimates by 9% sales surprises and 8.4% at the net profit level. This sector’s hit ratio was especially impressive with 92% of reporting companies ahead of the street estimates. Oil and gas companies, which suffered from very large downgrades in 2015, reported earnings in line with expectations. Sales of material-related sectors (basic resources, chemicals, construction materials) suffered from the decline in global commodity prices, but those companies were able to post better than expected net profits. While positive, these numbers were not sufficient to alter the general US earnings picture. Thus the 2015 expected growth remains anaemic at 1.6% for the whole S&P500 and at 9.1% excluding the oil sector.

Q2 GDP came out at 2.3% vs forecasts of 2.6%, nonetheless, this was robust enough to raise expectations of a September rate increase from the FOMC.

European growth – lower oil a benefit?

The European Q2 reporting season is still in train, however, roughly half the earnings reports have now been published; here’s Pictet’s commentary:-

European earnings: positive surprises, strong banks but no substantial currency impact

A little more than half of Stoxx Europe 600 constituents published their numbers. Sales and net earnings surprises came out at 4% and 4.3% respectively. Excluding financials, the beat was less impressive with 0.8% at the sales level and 2.7% at the net income level. Banks had a strong quarter on the back of a rebound in loan volumes and improvements in some peripheral economies. This sector’s published sales and net income were thus 33% and 11% higher respectively than estimates. One of the key questions going into the earnings season was whether the very weak euro would boost European earnings. Unfortunately, this element failed to impact Q2 earning in a meaningful way. Investors counting on the weaker currency to boost European companies’ profit margins were clearly disappointed as this process remains very gradual. Thus, European corporates’ profit margins remain well below their US counterparts (11% versus 15%).

The weakness of the oil price doesn’t appear to have had a significant impact on European growth. This video from Bruegel – The impact of the oil price on the EU economy from early June, suggests that the benefit of lower energy prices may still feed through to the wider European economy, however they conclude that the weakening of prices for industrial materials supports the view that the driver of lower oil prices is a weakening in the global economy rather than the result of a positive supply shock. The views expressed by Lutz Kilian, Professor of Economics at the University of Michigan, are particularly worth considering – he sees the oil price decline as being a marginal benefit to the global economy at best.

When attempting to gain a sense of how economic conditions are changing, I find it useful to visit a country or region. The UK appears to be in reasonably rude health by this measure, however, mainland Europe has been buffeted by another Greek crisis during the last few months, so my visit to Spain, this summer, provided a useful opportunity for observation. The country seems more prosperous than last year – albeit I visited a different province – despite the lingering problems of excess debt and the overhang of housing stock. The informal economy, always more flexible than its regulated relation, seems to be thriving, but most of the seasonal workers are non-Spanish – mainly of North African descent. This suggests that the economic adjustment process has not yet run its course – unemployment benefits are still sufficiently generous to make menial work unattractive, whilst unemployment remains stubbornly high:-

spain-unemployment- youth unemployment rate

Source: Trading Economics

Euro area youth unemployment remains stubbornly high at 22% – down from 24% in 2013 but well above the average for the period prior to the 2008 financial crisis (15%).

If structural reforms are working, Greece should be leading the adjustment process. Wages should be falling and, as the country regains competitiveness, and employment opportunities should rise:-

greece-german unemployment-rate

Source: Trading Economics

The chart above shows Greek vs German unemployment since the introduction of the Euro in 1999. Germany always had structurally lower unemployment and a much smaller “black economy”. During the early part of the 2000’s it suffered from a lack of competitiveness whilst other Eurozone countries benefitted from the introduction of the Euro. Between 2003 and 2005 Germany introduced the Hartz labour reforms. Whilst average earnings in Germany remained stagnant its economic competitiveness dramatically improved.

During the same period Greek wages increased substantially, the Greek government issued a vast swathe of debt and unemployment fell marginally – until the 2008 crisis. Since 2013 the adjustment process has begun to reduce unemployment, yet, with youth unemployment (see chart below) still above 50% and migrants arriving by the thousands, this summer, it appears as though the economic adjustment process has barely begun:-

greece-german youth-unemployment-rate

Source: Trading Economics

Japan – has Abenomics failed?

Japanese Q2 GDP was -1.6% y/y, Q1 was revised to an annualised +4.5% from 3.9% – itself a revision from 2.4%, so there may be room for some improvement in subsequent revisions. The weakness was blamed on lower exports to the US and China – despite policies designed to depreciate the JYP – and a weather related lack of domestic demand. The IMF – Conference Call from 23rd July urged greater efforts to stimulate growth by means of “third arrow” structural reform:-

In terms of the outlook for growth, we project growth at 0.8 percent in 2015 and 1.2 percent in 2016, and potential growth over the medium term under current policies we estimate to be about 0.6 percent. Although this near-term growth forecast looks modest, we would like to emphasize that it is above potential and, therefore, we think that the output gap will be closing by early 2017.

Still, we need to emphasize that the risks are on the downside, including from external developments, weaker growth in the United States and China, and global financial turbulence that could lead to safe haven appreciation of the yen, which would take the wind out of the recovery to some degree.

The key domestic risks include weaker than expected real wage growth in the short term and weak domestic demand and incomplete fiscal and structural reforms over the medium term. These scenarios could result in stagnation or stagflation and trigger a jump in JGB yields.


Conclusions and investment opportunities

I want to start by reviewing the markets; here are three charts comparing equities vs 10yr government bonds – for the Eurozone I’ve used German Bunds as a surrogate:-

Dow - T-Bond 2008-2015

Source: Trading Economics

Eurostoxx - Bunds - 2008-2015

Source: Trading Economics

Nikkei - JGB 2008-2015

Source: Trading Economics

With the exception of the Dow – and its pattern is similar on the S&P500 – the uptrend in stocks hasn’t been broken, nonetheless, a significant stock market correction is overdue. Below is a 10 year monthly chart for the S&P500:-

S&P500 10yr

Source: Barchart.com

US Stocks

Looking at the chart above, a retest of the November 2007 highs (1545) would not be unreasonable – I would certainly view this as a buying opportunity from a shorter term trading perspective. A break of the October 2014 low (1821) may presage a move towards this level, but for the moment I remain neutral. This is a change to my position earlier this year, when I had become more positive on the prospects for US stocks – earnings may have improved, but the recent price action suggests doubts are growing about the ability of US corporates to deliver sufficient multi-year growth to justify the current price-multiples in the face of potential central bank rate increases.

US Bonds

T-Bonds have been a short term beneficiary of “flight to quality” flows. A more gradual move lower in stocks will favour Treasuries but FOMC rate increases will lead to curve-flattening and may completely counter this effect. Should the FOMC relent – and the markets may well test their mettle – it will be a reactive, rather than a proactive move. The market will perceive the rate increases as merely postponed. Longer duration bonds will be less susceptible to the vagaries of the stock market and will offer a more attractive yield by way of recompense when a new tightening cycle begin in earnest.

Europe and Japan – stocks and bonds

Since the recent stock market decline and bond market rally are a reaction to the exogenous impact of China’s economic fortunes, I expect correlation between the major markets to increase – whither the US so goes the world.

The US$ – conundrum

Finally, I feel compelled to mention the recent price action of the US$ Index:-

US Dollar Index

Source: Barchart.com

Having been the beneficiary of significant inflows over the past two years, the US$ has weakened versus its main trading partners since the beginning of 2015, however, the value of the US$ has been artificially reduced over multiple years by the pegging of emerging market currencies to the world’s reserve currency – especially the Chinese RMB. The initial reaction to the RMB devaluation on 12th August was a weakening of the US$ as “risk” trades were unwound. The market correction this week has seen a continuation of this process. Once the deleveraging and risk-off phase has run its course – which may take some weeks – fundamental factors should favour the US$. The FOMC is still more likely to raise rates before other major central banks, whilst concern about the relative fragility of the economies of emerging markets, Japan and Europe all favour a renewed strengthening of the US$.