Macro Letter – No 26 – 19-12-2014
How the collapse in energy prices will affect US Growth and Inflation and what that means for stocks
- Oil prices have fallen by more than 40% in H2 2014
- Inflation expectations will be lowered further
- US Growth should be higher longer-term
- Near-term, contagion from the “energy bust” is under estimated by the market
With the recent collapse in the price of crude oil it seems appropriate to review the forecasts for inflation and growth in the US. Earlier this week, during an interview with CNBC, Bill Gross – ex-CIO of PIMCO – suggested that US growth would be around 2% going forward rather than the 3% to 4% seen in the recent past. The Atlanta Fed – Now GDP forecast for Q4 2014 was revised up to +2.2% from +2.1% on 11th December. This is higher than the Conference Board – Q4 GDP forecast of 2.0% from 10th December, here is their commentary:-
The U.S. growth momentum may pause in the fourth quarter, due to some special circumstances. The outlook for early 2015 shows some upside beyond the 2.5 percent pace. And this is despite continued slow economic growth around the world and a rise in the value of the dollar. The biggest disappointment right now is business spending on equipment which is slowing from an average pace of 11 percent over the past two quarters. But if final demand picks up as expected, business investment might also gain some momentum. One key driver of demand is continued improvement in the labor market. Job growth has been solid for the past year and the signal from the latest reading on The Conference Board Employment Trends Index™ (ETI) is that it will continue at least over the very near term. In fact, continued employment gains are likely to lead to better gains in wages in the first half of 2015. Job and income growth may provide some moderately positive momentum for the housing market. Low gasoline prices will also further support household spending. Finally, very low interest rates, at both the short and long end of the yield spectrum help consumers and businesses. The strengthening of domestic growth is intensifying pressures to increase the base interest rate, but speed and trajectory remain important questions.
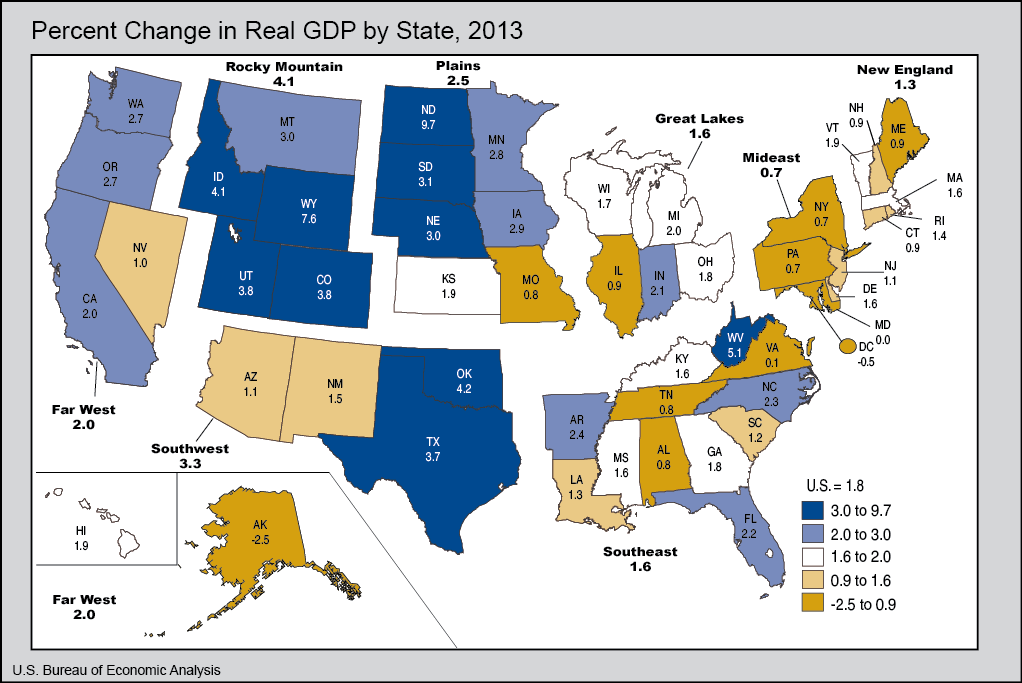
There is a brief mention of the fall in gasoline prices and hopes for increased domestic demand driven by a better quality of jobs. Thus far official expectations have failed to shift significantly in response to the fall in oil. If the price remains depressed I expect these forecasts to change. The geographic make-up of US growth is quite skewed. The map below shows the breakdown of GDP growth by state in 2013:-

Source: Bureau of Economic Analysis
The predominant feature of many high growth states is strength of their energy sector. One state which has been a major engine of US employment growth in absolute terms, since the Great Recession, is Texas. In 2013 Texas jobs growth slowed from 3.3% to 2.5%. In percentage terms, it slipped into third place behind the stellar growth seen in North Dakota and Florida. Florida is an interesting indication of the process by which the drivers of growth are gradually switching away from the energy related impetus seen over the past few years. This article from the Dallas Fed – Texas to Remain a Top State for Job Growth in 2014 looks more closely at some nascent growth trends:-
Oil- and gas-producing states—leaders in the early years of the U.S. recovery—no longer predominated. This reflects the energy sector’s slowing expansion, although two states with the strongest shale activity, Texas and North Dakota, remained near the top. Meanwhile, several Sunbelt states hit hard by the housing crisis—Florida, Georgia and Arizona, for instance—are beginning to bounce back. In these states, employment remains significantly below the prerecession peak; in Texas, it is significantly above.
Texas is vulnerable, as are other energy rich US states, due to the weakness in the price of oil, however, Texas is also reliant on trade with Mexico for more than half of its exports. The down-turn in Mexican growth due to the weaker oil price, is an additional headwind for the “lone star” state.
You might expect this to be cause for some relief on the part of Richard Fisher – President of the Dallas Fed, yet, writing in mid-October in the Dallas Fed – Economic Letter – he remained, consistently hawkish on the prospects for inflation:-
The point is not that wage growth has been worrisomely high (it hasn’t been) or that we’re in imminent danger of a wage-price spiral (we likely aren’t). Rather, there’s nothing in the behavior of wage inflation over the course of the recovery to suggest that the unemployment rate has been sending misleading signals about our progress toward full employment. A secondary point—a caution, really—is that when trying to draw inferences about labor-market slack from the behavior of wages, it’s important to recognize that wage inflation’s response to slack is both nonlinear and delayed.
…Do we keep the accelerator pedal to the floor right up to the point where we reach our destination? Or do we ease up as we near our goal? The answer depends on an assessment of the costs of possibly delaying achievement of our objectives versus the costs of overshooting those objectives. Proponents of a patient approach to removing accommodation emphasize the risk of having to backtrack on policy, should either real growth or inflation expectations falter. On the other hand, Fed policymakers successfully “tapped the brakes” in the middle of three of our longest economic expansions (in the 1960s, 1980s and 1990s), slowing—but not ending—the unemployment rate’s decline. By comparison, there are no instances where the Fed has successfully eased the unemployment rate upward after having first overshot full employment: When the economy goes into reverse, it has a pronounced tendency to lurch backward all the way into recession.
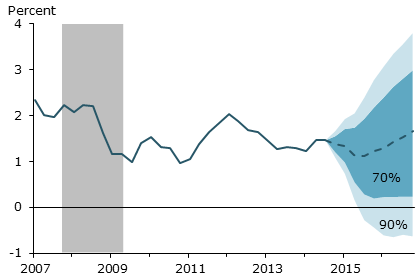
The Federal Reserve Bank of San Francisco – The Risks to the Inflation Outlook – November 17th – has a rather different view of the risks of inflation:-
Although inflation is currently low, some commentators fear that continued highly accommodative monetary policy may lead to a surge in inflation. However, projections that account for the different policy tools used by the Federal Reserve suggest that inflation will remain low in the near future. Moreover, the relative odds of low inflation outweigh those of high inflation, which is the opposite of historical projections. An important factor continuing to hold down inflation is the persistent effects of the financial crisis.
The chart below shows the wide range of PCE forecasts, interestingly the IMF WEO forecast is 1.8% for 2015:-

Source: FRBSF
The author goes on to conclude:-
Overall, this Letter suggests that inflation is not expected to surge in the near future. According to this model, the risks to the inflation outlook remain tilted to the downside. The financial crisis disrupted the credit market, leading to lower investment and underutilization of resources in the economy, causing slower growth, which in turn put downward pressure on inflation. My analysis suggests that these effects from the crisis explain a substantial part of the outlook for inflation. Monetary policy has played a stabilizing role in the recent past, preventing inflation from falling further below its 2% target. Moreover, the analysis suggests that monetary policy is not contributing to the risk of inflation being above the median projection in the near future.
The risk of high inflation in the next one to two years remains very low by historical standards. The analysis suggests that the factors keeping inflation low are expected to be transitory. However, differences between projected and realized inflation in the recent past suggest that those factors may in reality be more persistent than implied by the model.
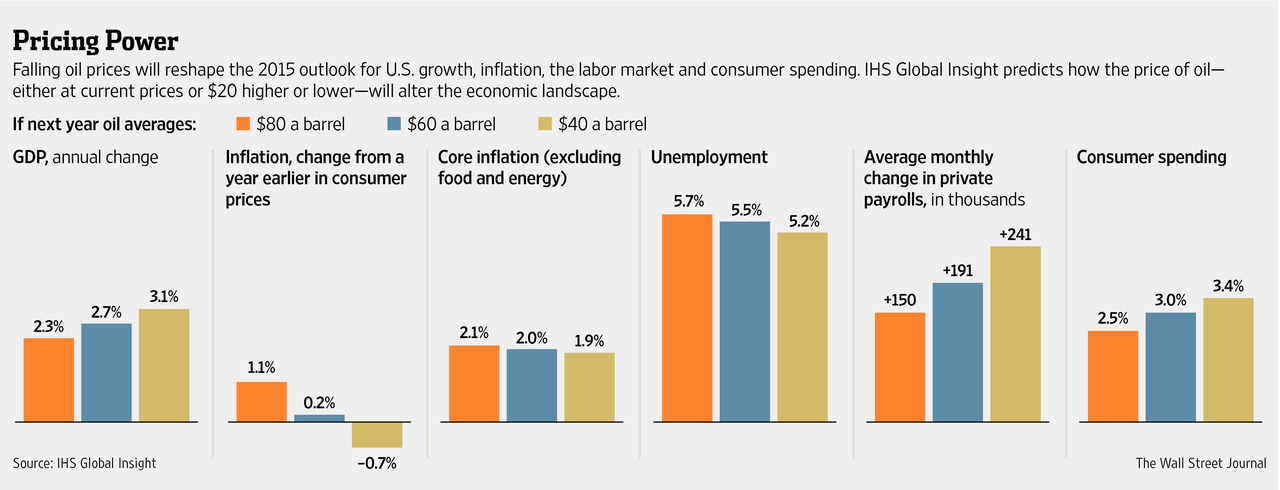
It would appear that even before the recent decline in the price of oil the Fed was not expecting a significant increase in inflationary pressure. What should they do in the current environment where the US$ continues to appreciate against its major trading partners and if the price of oil remains at or below $60/barrel? These are one-off external price shocks which are a boon to the consumer, however they make exports uncompetitive and undermine the longer term attractiveness of investment in the domestic energy sector. IHS Global Insight produced the following forecast for the Wall Street Journal earlier this month:-

Source: IHS Global Insight and WSJ
My concerns are two-fold; firstly, what if the oil price rebounds? The latest IEA report noted that global demand for oil increased 0.75% between 2013 and 2014 and is running 3.6% above the average level of the last five years (2009 – 2013) this leaves additional supply as the main culprit of the oil price decline. With oil at $60/barrel it is becoming uneconomic to extract oil from many of the new concessions – over-supply may swiftly be reversed. Secondly, the unbridled boon to the wider economy of a lower oil price is likely to be deferred by the process of rebalancing the economy away from an excessive reliance on the energy sector. In an excellent paper in their Power and Growth Initiative series, the Manhattan Institute – Where The Jobs Are: Small Businesses Unleash Energy Employment Boom– February 2014 conclude:-
According to a recent poll from the Washington Post Miller Center, American workers’ anxiety over jobs is at a four-decade record high. Meanwhile, the hydrocarbon sector’s contributions to America’s job picture and the role of its small businesses in keeping the nation out of a long recession are not widely recognized. Another recent survey found that only 16 percent of people know that an oil & gas boom has increased U.S. energy production—collaterally creating jobs both directly and indirectly.
America’s future, of course, is not exclusively associated with hydrocarbons or energy in general. Over the long term, innovation and new technologies across all sectors of the economy will revitalize the nation and create a new cycle of job growth, almost certainly in unexpected ways. But the depth and magnitude of job destruction from the Great Recession means that creating jobs in the near-term is vital. As former chair of the Council of Economic Advisers and Harvard professor Martin Feldstein recently wrote: “The United States certainly needs a new strategy to increase economic growth and employment. The U.S. growth rate has fallen to less than 2%, and total employment is a smaller share of the population now than it was five years ago.”
In a new report evaluating five “game changers” for growth, the McKinsey Global Institute concluded that the hydrocarbon sector has the greatest potential for increasing the U.S. GDP and adding jobs—with an impact twice as great as big data by 2020. McKinsey forecasts that the expanding shale production can add nearly $700 billion to the GDP and almost 2 million jobs over the next six years.
Other analysts looking out over 15 years see 3–4 million more jobs that could come from accelerating domestic hydrocarbon energy production. Even these forecasts underestimate what would be possible in a political environment that embraced growth-centric policies.
In November 2013, President Obama delivered a speech in Ohio on jobs and the benefits from greater domestic energy production. The president highlighted the role of improved energy efficiency and alternative fuels. But as the facts show, no part of the U.S. economy has had as dramatic an impact on short-term job creation as the small businesses at the core of the American oil & gas boom. And much more can be done.
A recent report by Deutsche Bank – Sinking Oil May Push Energy Sector to the Brink – estimated that of $2.8trln annual US private investment, $1.6trln is spent on equipment and software and $700bln on non-residential construction. Of the equipment and software sector, 25-30% is investment in industrial equipment for energy, utilities and agriculture. Non-residential construction is 30% energy related. With oil below $60/barrel much of that private investment will be postponed or cancelled. That could amount to a reduction in private investment of $500bln in 2015. This process is already underway; according to Reuters, new oil permits plummeted 40% in November.
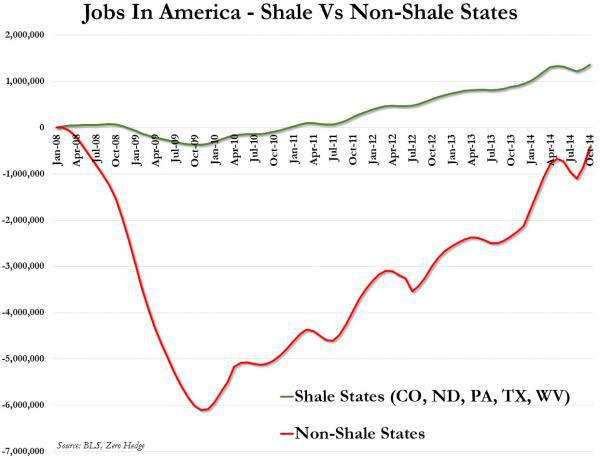
Since 2007 shale producing states have added 1.36mln jobs whilst the non-shale states have shed 424,000 jobs. The table below shows the scale of employment within the energy sector for key states:-
| State |
Hydro-carbon jobs 000’s |
| Texas |
1800 |
| California |
780 |
| Oklahoma |
350 |
| Louisiana |
340 |
| Pennsylvania |
330 |
| New York |
300 |
| Illinois |
290 |
| Florida |
280 |
| Ohio |
260 |
| Colorado |
210 |
| Virginia |
190 |
| Michigan |
180 |
| Kentucky |
170 |
| West Virginia |
170 |
| Georgia |
160 |
| New Jersey |
150 |
Source: Manhattan Institute
This chart from Zero Hedge shows the evolution of the US jobs market in shale vs non-shale terms since 2008:-

Source: Zero Hedge and BLS
2015 will see a correction in this trend, not just because investment stalls, but also as a result of defaults in the high-yield bond market.
Junk Bonds and Bank Loans
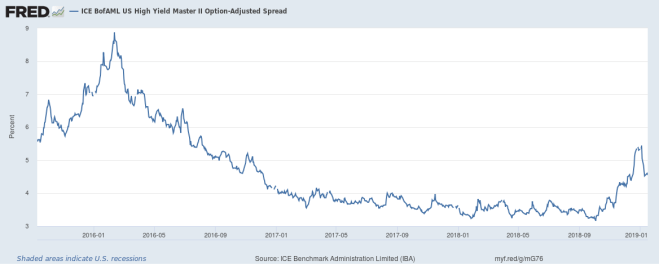
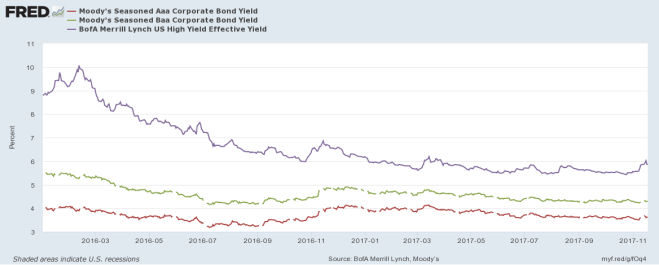
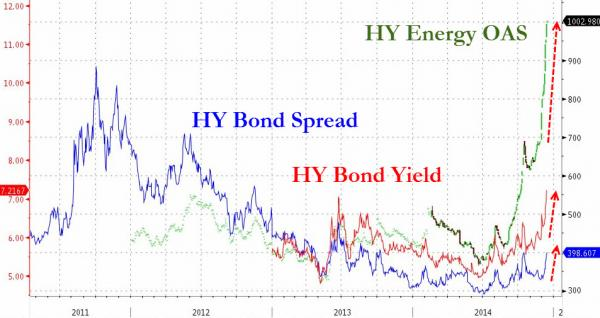
It is estimated that around 17% of the High-yield bond market in the US is energy related. The chart below is from Zero Hedge, it shows the evolution of high yield bonds over the last four years. The OAS is the option adjusted spread between High Yield Energy bonds and US Treasury bonds:-

Source: Zero Hedge and Bloomberg
Deutsche Bank strategists Oleg Melentyev and Daniel Sorid estimate that, with oil at $60/barrel, the default rate on B and CCC rated bonds could be as high as 30%. Whilst this is bad news for investors it is also bad news for banks which have thrived on the securitisation of these bonds. The yield expansion seen in the chart above suggests there is a liquidity short-fall at work here – perhaps the Fed will intervene.
As a result of the growth in the US energy sector, banks have become more actively involved in the energy markets. Here the scale of their derivative exposure may become a systemic risk to the financial sector. When oil was trading at its recent highs back in July the total open speculative futures contracts stood at 4mln: that is four times the number seen back in 2010. The banks will also be exposed to the derivatives market as a result of the loans they have made to commodity trading companies – some of whom may struggle to meet margin calls. Bad loan provisions will reduce the credit available to the rest of the economy. This will dampen growth prospects even as lower energy prices help the consumer.
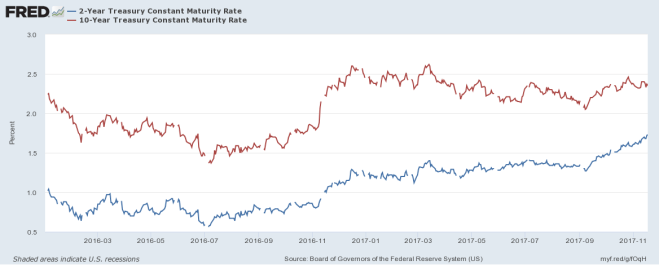
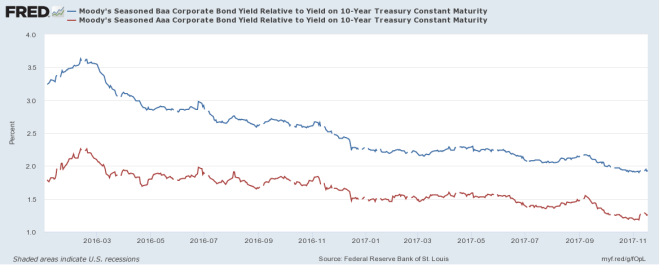
The US Treasury Bond yield curve has also “twisted” over the past month, with maturities of five years and beyond falling but shorter maturities moving slightly higher:-
| Maturity |
17-Nov |
17-Dec |
Change |
| 2yr |
0.504 |
0.565 |
0.061 |
| 3yr |
0.952 |
1.005 |
0.053 |
| 5yr |
1.607 |
1.534 |
-0.073 |
| 7yr |
2.019 |
1.863 |
-0.156 |
| 10yr |
2.317 |
2.078 |
-0.239 |
Source: Investing.com
On the 15th October, at the depths of the stock market correction, 2yr Notes yielded 0.308% whilst 10yr Notes yielded 2.07%. Since then the 2yr/10yr curve has flattened by 25bp. I believe this price move, in the short end of the market, is being driven by expectations that the Fed will move to “normalise” policy rates in the next 12 months. Governor Yellen’s change of emphasis in this weeks FOMC statement – from “considerable time” to “patient” – has been perceived by market pundits as evidence of more imminent rate increases. An additional factor driving short term interest rates higher is the tightening of credit conditions connected to the falling oil price.
Longer maturity Treasuries, meanwhile, are witnessing a slight “flight to quality” as fixed income portfolio managers switch out of High Yield into US government securities even at slightly negative real yields. According to an article in the Financial Times – Fall in oil price threatens high-yield bonds – 7th December $40bln was withdrawn from US High Yield mutual fund market between May and October. I expect this process to gather pace and breed contagion with other markets where the “carry trade” has been bolstered by leveraged investment flows.
Where next for stocks?
The New York Fed – Business Leaders Survey showed that, despite easing energy costs and benign inflation, business leaders expectations are not particularly robust:-
The Federal Reserve Bank of New York’s December 2014 Business Leaders Survey indicates that activity in the region’s service sector expanded modestly. The survey’s headline business activity index fell ten points to 7.8, indicating a slower pace of growth than in November. The business climate index inched down two points to -7.8, suggesting that on balance, respondents continued to view the business climate as worse than normal. The employment index climbed three points to 16.3, pointing to solid gains in employment, while the wages index drifted down five points to 25.6. After declining sharply last month, the prices paid index climbed four points to 42.2, indicating a slight pickup in the pace of input price increases, while the prices received index fell eight points to its lowest level in two years, at 5.4, pointing to a slowing of selling price increases. The current capital spending index declined ten points to 10.1, while the index for future capital spending rose six points to 25.0. Indexes for the six-month outlook for business activity and employment fell noticeably from last month, suggesting that firms were less optimistic about future conditions.
Set against this rather negative report from the Fed, is this upbeat assessment of the longer-term prospects for US manufacturing from the Peterson Institute – The US Manufacturing Base:
Four Signs of Strength it makes a compelling case for an industrial renaissance in the US. The four signs are:-
- US manufacturing output growth
- US manufacturing competitive performance relative to other sectors of the US economy
- US manufacturing productivity growth relative to other countries
- New evidence on outward expansion by US multinational corporations and economic activity by those same firms at home
Another factor supporting the stock market over the last few years has been the steady increase in dividends and share buybacks. According to Birinyi Associates, US corporations bought back $338.3bln of stock in H1 2014 – the most in any six month period since 2007. Here are some of the bigger names; although they account for less than half the H1 total:-
| Name |
Ticker |
Buyback $blns |
| Apple |
APPL |
32.9 |
| IBM |
IBM |
19.5 |
| Exxon Mobil |
XOM |
13.2 |
| Pfizer |
PFE |
10.9 |
| Cisco |
CSCO |
9.9 |
| Oracle |
ORCL |
9.8 |
| Home Depot |
HD |
7.6 |
| Wells Fargo |
WFC |
7.5 |
| Microsoft |
MSFT |
7.3 |
| Qualcomm |
QCOM |
6.7 |
| Walt Disney |
DIS |
6.5 |
| Goldman Sachs |
GS |
6.4 |
Source: Barclays and Wall Street Journal
Share buybacks are running at around twice their long run average and dividends have increased by 12% in the past year. On average, companies spend around 85% of their profits on dividends and share repurchases. This October 6th article from Bloomberg – S&P 500 Companies Spend 95% of Profits on Buybacks, Payouts goes into greater detail, but this particular section caught my eye:-
CEOs have increased the proportion of cash flow allocated to stock buybacks to more than 30 percent, almost double where it was in 2002, data from Barclays show. During the same period, the portion used for capital spending has fallen to about 40 percent from more than 50 percent.
The reluctance to raise capital investment has left companies with the oldest plants and equipment in almost 60 years. The average age of fixed assets reached 22 years in 2013, the highest level since 1956, according to annual data compiled by the Commerce Department.
I am cynical about share buybacks. If they are running at twice the average pace this suggests, firstly, that the “C suite” are more interested in their share options than their shareholders and, secondly, that they are still uncomfortable making capital expenditure decisions due to an utter lack of imagination and/or uncertainty about the political and economic outlook. Either way, this behaviour is not a positive long-term phenomenon. I hope it is mainly a response to the unorthodox policies of the Fed: and that there will be a resurgence in investment spending once interest rates normalise. This might also arrive sooner than expected due to a collapse in inflation rather than a rise in official rates.
The US economy will benefit from lower energy prices in the long term but the rebalancing away from the energy sector is likely to take time, during which the stock market will have difficulty moving higher. For the first time since 2008, the risks are on the downside as we head into 2015. Sector rotation is certainly going to feature prominently next year.
Last weeks National Association of Manufacturers – Monday Economic Report – 8th December 2014 shows the optimism of the manufacturing sector:-
Business leaders continue to reflect optimism about the coming months, with 91.2 percent of survey respondents saying they are either somewhat or very positive about their own company’s outlook. Moreover, manufacturers predict growth of 4.5 percent in sales and 2.1 percent in employment over the next 12 months, with both experiencing the strongest pace in at least two years.
These findings were largely consistent with other indicators released last week. Most notably, the U.S. economy added 321,000 nonfarm payroll employees on net in November. This was well above the consensus estimate, and it was the fastest monthly pace since April 2011. Hiring in the manufacturing sector was also strong, with 28,000 new workers during the month. Since January, manufacturers have hired almost 15,000 workers on average each month, or 740,000 total since the end of 2009. In other news, manufacturing construction spending was also up sharply, increasing 3.4 percent in October and a whopping 23.0 percent year-over-year.
These reports suggest that accelerating growth in demand and output is beginning to translate into healthier employment and construction figures, with businesses stepping up investments, perhaps as a sign of confidence. This should bode well for manufacturing employment as we move into 2015. In particular, the Institute for Supply Management’s (ISM) manufacturing Purchasing Managers’ Index (PMI) remains strong, despite edging marginally lower in November. For instance, the production index has now been 60 or higher, which indicates robust expansionary levels, for seven straight months. Similarly, the new orders index has been 60 or higher for five consecutive months, and the export measure also noted some improvements for the month.
Speaking of exports, the U.S. trade deficit changed little in October, edging marginally lower from the month before. Still, growth in goods exports was somewhat better than the headline figure suggested, with the value of petroleum exports declining on lower crude oil costs. The good news is that year-to-date manufactured goods exports have increased to each of our top-five trading partners so far this year.
They go on to temper this rosy scenario, which is why I anticipate the interruption to the smooth course of stock market returns during the next year :-
…growth in manufactured goods exports remains sluggish through the first 11 months of 2014, up just 1.1 percent relative to the same time frame in 2013. Not surprisingly, challenges abroad continue to dampen our ability to grow international sales. New factory orders have declined for the third straight month, a disappointing figure particularly given the strength seen in other measures. In addition, the NAM/IndustryWeek survey noted that the expected pace of exports decelerated once again, mirroring the slow growth in manufactured goods exports noted above.
This week saw the release of revised Industrial Production and Capacity Utilisation data – this was the commentary from the Federal Reserve:-
Industrial production increased 1.3 percent in November after edging up in October; output is now reported to have risen at a faster pace over the period from June through October than previously published. In November, manufacturing output increased 1.1 percent, with widespread gains among industries. The rise in factory output was well above its average monthly pace of 0.3 percent over the previous five months and was its largest gain since February. In November, the output of utilities jumped 5.1 percent, as weather that was colder than usual for the month boosted demand for heating. The index for mining decreased 0.1 percent. At 106.7 percent of its 2007 average, total industrial production in November was 5.2 percent above its year-earlier level. Capacity utilization for the industrial sector increased 0.8 percentage point in November to 80.1 percent, a rate equal to its long-run (1972–2013) average.
This paints a positive picture but, with Capacity Utilisation only returning to its long-run trend rate, I remain concerned that the weakness of the energy sector will undermine the, still nascent, recovery in the broader economy in the near-term.
Conclusion and investment opportunities
The decline in the oil price, if it holds, should have a long-term benign effect on US growth and inflation. In the shorter term, however, the rebalancing of the economy away from the energy sector may take its toll, not just on the energy sector, but also on financial services – both the banks, which have lent the energy companies money, and the investors, who have purchased energy related debt. This will breed contagion with other speculative investment markets – lower quality bonds, small cap growth stocks and leveraged derivative investments of many colours.
Where the US stock market leads it is difficult for the rest of the world not to follow. The table below from March 2008 shows the high degree of monthly correlation of a range of stock indices to the Nasdaq Composite. In a QE determined world, I would expect these correlations to have risen over the last six years: –
| Ticker |
Index |
Country |
10 years |
5 years |
1 year |
| ^IXIC |
Nasdaq Composite |
USA |
1 |
1 |
1 |
| ^GSPC |
S&P 500 |
USA |
0.8 |
0.86 |
0.83 |
| ^DWC |
Wilshire 5000 |
USA |
N/A |
0.9 |
0.85 |
| ^AORD |
All Ords |
Australia |
0.64 |
0.6 |
0.93 |
| ^BVSP |
Bovespa |
Brazil |
0.62 |
0.53 |
0.83 |
| ^GSPTSE |
TSX |
Canada |
N/A |
0.66 |
0.83 |
| 399300.SZ |
Shanghai Composite |
China |
N/A |
N/A |
0.68 |
| ^GDAXI |
DAX |
Germany |
N/A |
0.73 |
0.83 |
| ^HSI |
Hang Seng |
Hong Kong |
0.6 |
0.54 |
0.79 |
| ^BSESN |
BSE Sensex |
India |
0.44 |
0.5 |
0.75 |
| ^N225 |
Nikkei 225 |
Japan |
0.51 |
0.49 |
0.87 |
| ^MXX |
IPC |
Mexico |
0.67 |
0.56 |
0.33 |
| RTS.RS |
RTS |
Russia |
N/A |
N/A |
0.53 |
| ^KS11 |
Kospi |
South Korea |
0.57 |
0.59 |
0.8 |
| ^FTSE |
FTSE100 |
UK |
N/A |
0.57 |
0.87 |
Source: Timingcube.com
A decline in the S&P 500 will impact other developed markets, especially those reliant on the US for exports. 2015 will be a transitional year if oil prices remain depressed at current levels, yet the longer term benefit of lower energy prices will feed through to a recovery in 2016/2017. A crisis could ensue next year, but, with China, Japan and the EU continuing to provide quantitative and qualitative support, I do not believe the world’s “saviour” central banks are “pushing on a string” just yet. Inflation is likely to fall, global growth will be higher, but US stocks will, at best, mark time in 2015.
In bond markets, credit will generally be re-priced to reflect the increased risk of corporate defaults due to mal-investment in the energy sector. Carry trades will be unwound, favouring government bonds to some degree.
Recently heightened expectations of higher short term interest rates will recede. This should be supportive for the Real-Estate market. With a presidential election due in 2016 both the Democrats and the Republicans will be concocting policies to support house prices, jobs, average wages and the value of 401k’s. After three years of deliberation, the introduction of watered down QRM – Qualified Residential Mortgage – rules in October suggests this process is already in train.
Many investors have been waiting to enter the stock market, fearing that the end of QE would herald a substantial correction. 2015 might provide the opportunity but by 2016 I believe this window will have closed.