The Beginning of the End of Uncertainty for the UK

The Beginning of the End of Uncertainty for the UK

In the Long Run - small colour logo

Macro Letter – No 124 – 20-12-2019

The Beginning of the End of Uncertainty for the UK

  • The UK election result was a clear mandate for Brexit
  • A UK/EU free-trade agreement may not be ready by December 2020
  • Uncertainty remains but real economic progress can now begin

For traders and investors in financial markets, risk and reward are two sides of a single coin. There are, of course, exceptions and geopolitical risk is one of them. The difficulty with geopolitical risk is that it is really geopolitical uncertainty. As Frank Knight observed back in 1921 in Risk, Uncertainty and Profitrisk is can be measured and forecast, uncertainty, cannot: –

Uncertainty must be taken in a sense radically distinct from the familiar notion of Risk, from which it has never been properly separated…. The essential fact is that ‘risk’ means in some cases a quantity susceptible of measurement, while at other times it is something distinctly not of this character; and there are far-reaching and crucial differences in the bearings of the phenomena depending on which of the two is really present and operating…. It will appear that a measurable uncertainty, or ‘risk’ proper, as we shall use the term, is so far different from an unmeasurable one that it is not in effect an uncertainty at all.

I have kept this in mind throughout my investing career and it is for this reason that I have avoided investing in the UK stock market since the Brexit referendum. The uncertainty surrounding Brexit has not disappeared, but I now have sufficient confidence in the decisiveness of the incumbent administration to believe that progress can at last be made. To judge by the immediate reaction of financial markets in the wake of the UK election result, I am not alone in my optimism.

To begin, here is a chart of G7 GDP since Q2 2016: –

GDP comparison since 2016

Source: OECD

The UK has fared better than Japan and Italy but its momentum has diminished relative to the remainder of G7.

A more nuanced view of the relative underperformance of the UK is revealed by comparison with Eurozone growth. The chart below, which starts in 2014, shows the switch from UK outperformance to underperformance which began even before the Brexit referendum in mid-2016: –

GDP UK v EU

Source: Eurostat, Full Fact

Whilst there are many factors which have contributed to this change in the UK growth rate, the principal factor has been uncertainty relating to Brexit.

Of course, the direct impact of the Brexit referendum was felt by Sterling. The chart below shows the (Trade-weighted) Sterling Effective Exchange Rate since 2016: –

Sterling Effective Exchange Rate since 2016

Source: Bank of England

The rise since August 2019 appears to predict the outcome of the election, but the currency still has far to rise if it is to return to pre-financial crisis levels, as this 20 year chart reveals: –

Sterling Effective Exchange Rate since 2000

Source: Bank of England

The strong upward momentum which began in 2012 was swiftly terminated by the political morass which culminated in the UK referendum. The unexpected outcome of the 2016 Brexit vote only served to exacerbate the malaise.

The weakness of Sterling merely accelerated the deterioration in the UK terms of trade. The UK has run a continuous trade deficit since 1998 but, as the chart below reveals, the deficit has become structural: –

UK Trade Balance

Source: ONS

Any significant imbalance in trade makes an economy sensitive to changes in the value of its currency. The fall in Sterling since 2016 has had a knock on effect on the rate of UK inflation: –

united-kingdom-inflation-cpi since 2016

Source: ONS, Trading Economics

Viewed from a 10 year perspective, the reversal is even more pronounced. UK interest rates would probably have been substantially lower during the last four years had it not been for the uncertainty surrounding Brexit: –

united-kingdom-inflation-cpi since 2010

Source: ONS, Trading Economics

Is optimism now justified?

Aside from the trade balance, the charts above are a reflection of the discount financial markets have imposed on the UK. This month’s election justifies a rerating. Whilst the markets have not been overly enamoured with the latest Tory Brexit deal they have been craving certainty. A working majority of 80 allows room for any Conservative dissenters to be quashed. Then there is the ‘Corbyn Factor.’ Promises of widespread nationalisation, without clarity about the price with which private investors would be compensated, did not sit well. Neither did the proposed tax increases required to fuel the £80bln increase in fiscal spending. That threat has now passed.

Finally there was clarification of the nation’s opinion on Brexit itself. Labour lost ground almost everywhere; to Tories and the Brexit party in England and Wales, whilst in Scotland they ceded ground to the SNP.

This summation of the UK situation is an over-simplification, but from a financial market perspective the UK political landscape has improved. Suffice to say, there remain many challenges ahead, not least the Brexit transition period (end 2020) during which a free-trade agreement (FTA) needs to be agreed to avert unnecessary trade disruption. After four years, one might hope there has been behind the scenes preparation and that much of the deal will be a slight amendment to current access arrangements. In reality to complete a deal by year-end 2020 it will have to be an ‘FTA-lite’ affair, which may prove less than satisfactory. A swift trade deal should, nonetheless, reduce uncertainty which is also in the interests of the EU. I remain sceptical, there may be many a slip twixt cup and lip.

Conclusions and Investment Opportunities

Four years of deferred investment and consumption will now gradually be unleashed. This should bolster Sterling. As the Pound rises inflation should fall. Assuming they do not give up on their inflation target, currency strength should prompt the Bank of England to ease monetary conditions. Gilt yields will decline, forcing investors to seek longer duration bonds or higher credit risk to compensate for the shortfall in returns. Companies will find it easier to issue debt in order to fuel capital expenditure: although I expect it may lead to more share buybacks too. UK equity markets will rise, driven by an improved outlook for inflation, a lowering of interest rates and expectations of stronger economic growth.

For equity investors, this rising tide will float most ships, but not all companies will benefit equally. Those firms which were at risk of nationalisation have been immediate beneficiaries. The chart below tracks their relative underperformance: –

UK Nationalisation Tragets v FTSE 350

Source: Bloomberg, The Economist

A longer term investment opportunity should be found in the FTSE 250. The four year picture is found below (FTSE 100 in blue, FTSE 250 in red): –

FTSE 100 vs 250 - 4yr

Source: AJ Bell

It might appear as if the FTSE 250 has already caught up with the FTSE 100, but this next chart reveals a rather different picture: –

FTSE 100 vs 250 10yr

Source: AJ Bell

The FTSE 250 is much more closely entwined with the fortunes of the domestic UK economy. For the past four years many business plans in the UK have been on hold, awaiting clarity on Brexit. Now that a deal will be done and an FTA with the EU will follow, we may have finally reached the beginning of the end of uncertainty.

Robots, employment and the mis-measurement of productivity

Robots, employment and the mis-measurement of productivity

In the Long Run - small colour logo

Macro Letter – No 97 – 18-05-2018

Robots, employment and the mis-measurement of productivity

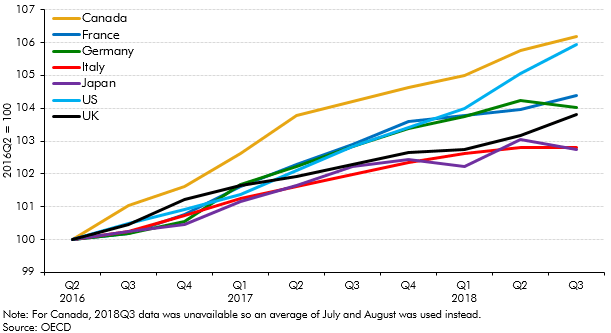
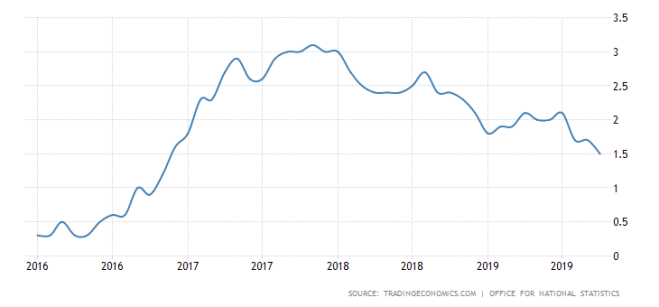
  • UK productivity – output/hour has risen 1.5% in a decade
  • UK unemployment, at 4.2%, is the lowest since April 1975
  • UK real-wages have risen by 1.1% per annum over the last four years
  • Robots may be coming but it’s not showing up in the data

The subject matter of this Macro Letter is broad, so I shall confine my investigation to the UK. It was, after all, one of the first countries where services became a larger percentage of GDP than manufacturing. The crossover between manufacturing and services is estimated to have happened around 1881. When Napoleon Bonaparte described England as, ‘A nation of shopkeepers,’ his intension may have been derisive, but his observation was prescient. Of course, M. Bonaparte was actually quoting Adam Smith, who first coined the phrase in his magnum opus, An Inquiry into the Nature and Causes of the Wealth of Nations, published in 1776: now, he really was prescient.

As we stare into the abyss, anticipating the huge percentage of manufacturing – and now, many services – jobs which are expected to be replaced by machines, it behoves us to begin by reviewing the accuracy with which we measure services in general. A recent paper from the Centre for Economic and Business Research does just that for one sub-sector, although it suggests that mis-measurement of economic activity in services, always difficult to define, may be a factor in the poor productivity record of the UK. I have often described Britain as a post-industrial nation but this research, into one of the most vibrant corners of the economy, makes fascinating reading – The True Value of Creative Industries Digital Exports – CIC, CBER – March 2018 – finds, among other things that: –

The UK’s creative industries exports are: –

£46bn in goods and services – 24% higher than the official figure

£31bn of total creative exports are services – 41% higher than the official figure

£21bn of these creative services are digital services – 40% higher than the official figure

The CEBR goes on to point out other weaknesses in current measurements of economic activity: –

…estimated official figures for 2016 highlight that the majority of creative industries sub-sectors are exporting digital services. The IT, software and computer services sector, for example, exports £8.95bn in digital services. However, according to these figures, the crafts and museums, galleries and libraries sectors’ digital services exports are zero – which we know is not the case.

Many UK YouTube channels, for example, are watched by millions of viewers across the world. It is through these types of platforms that the creative industries export audiovisual content, music, and tutorials. Such platforms and the content they offer, however, may not be registered as a service export. This is due to difficulties capturing data for business models such as those offering free content and based on advertising revenues.

There are also structural challenges with collecting data on such exports. Often, it is difficult for digital intermediaries to determine the point of sale and purchase. The borderless way in which many global firms operate presents additional complications and the origin of the creative content, and of those who consume it, is frequently hard to track.

This brings me to the vexed question of productivity growth in the new machine age. In the Deloitte – Monday Briefing – Thoughts on the global economy – from 30th April, the author reflects on the discussions which occurred at the annual global gathering of Deliotte’s economic experts. I’m cherry picking, of course, the whole article is well worth reading: –

Despite discussion of recession risks I was struck by a cautious optimism about the long-term outlook. There was a general view that the slowdown in productivity growth in the West has been overstated, partly because of problems in capturing gains from technological change and quality improvements. As a result most of us felt that Western economies should be able to improve upon the lacklustre growth rates seen in the last ten years.

We agreed too that apocalyptic media stories about new technologies destroying work were overcooked; technology would continue to create more jobs than it destroys. The challenge would be to provide people with the right skills to prosper. The question was, what skills? We had a show of hands on what we would recommend as the ideal degree subjects for an 18-year-old planning for a 40-year career. Two-thirds advocated STEM subjects, so science, technology, engineering and maths. A third, myself included, opted for humanities/liberal arts as a way of honing skills of expression, creativity and thinking.

Mr Stewart ends by referring to a letter to the FT from Dr Lawrence Haar, Associate Professor at the University of Lincoln, in which he argues that poor UK productivity is a function of the low levels of UK unemployment. In other words, when everyone, even unproductive workers, are employed, productivity inevitably declines:-

…it does not have to be this way. Some economies, including Singapore, Switzerland and Germany, combine low unemployment and decent productivity growth. The right training and education can raise productivity rates for lower skilled workers. 

This theme of productivity growth supported by the right education and training is at the heart of a recent paper written by Professor Shackleton of the IEA – Current Controversies No. 62 – Robocalypse Now? IEA – May 2018 – the essay cautions against the imposition of robotaxes and makes the observation that technology has always created new jobs, despite the human tendency to fear the unknown: why should the adoption of a new swath of technologies be different this time? Here is his introduction: –

It is claimed that robots, algorithms and artificial intelligence are going to destroy jobs on an unprecedented scale.

These developments, unlike past bouts of technical change, threaten rapidly to affect even highly-skilled work and lead to mass unemployment and/or dramatic falls in wages and living standards, while accentuating inequality.

As a result, we are threatened with the ‘end of work’, and should introduce radical new policies such as a robot tax and a universal basic income.

However the claims being made of massive job loss are based on highly contentious technological assumptions and are contested by economists who point to flaws in the methodology.

In any case, ‘technological determinism’ ignores the engineering, economic, social and regulatory barriers to adoption of many theoretically possible innovations. And even successful innovations are likely to take longer to materialise than optimists hope and pessimists fear.

Moreover history strongly suggests that jobs destroyed by technical change will be replaced by new jobs complementary to these technologies – or else in unrelated areas as spending power is released by falling prices. Current evidence on new types of job opportunity supports this suggestion.

The UK labour market is currently in a healthy state and there is little evidence that technology is having a strongly negative effect on total employment. The problem at the moment may be a shortage of key types of labour rather than a shortage of work.

The proposal for a robot tax is ill-judged. Defining what is a robot is next to impossible, and concerns over slow productivity growth anyway suggest we should be investing more in automation rather than less. Even if a workable robot tax could be devised, it would essentially duplicate the effects, and problems, of corporation tax.

Universal basic income is a concept with a long history. Despite its appeal, it would be costly to introduce, could have negative effects on work incentives, and would give governments dangerous powers.

Politicians already seem tempted to move in the direction of these untested policies. They would be foolish to do so. If technological change were to create major problems in the future, there are less problematic policies available to mitigate its effects – such as reducing taxes on employment income, or substantially deregulating the labour market.

Professor Shackleton provides a brief history of technological paranoia. Riccardo added a chapter entitled ‘On Machinery’ to the third edition of his ‘Principles of Political Economy and Taxation,’ stating: –

‘I am convinced that the substitution of machinery for human labour is often very injurious to the interests of the class of labourers’.

While Marx, writing only a few decades later, envisaged a time when man would be enabled to: –

‘…to hunt in the morning, fish in the afternoon, rear cattle in the evening, criticise after dinner… without ever becoming hunter, fisherman, herdsman or critic.’

As for Keynes essay on the, ‘Economic Possibilities for our Grandchildren’, his optimism is laudable if laughable – 15 hour working week anyone?

The paranoia continues, nonetheless – The Economist – A study finds nearly half of jobs are vulnerable to automation – April 2018 – takes up the story:-

A wave of automation anxiety has hit the West. Just try typing “Will machines…” into Google. An algorithm offers to complete the sentence with differing degrees of disquiet: “…take my job?”; “…take all jobs?”; “…replace humans?”; “…take over the world?”

Job-grabbing robots are no longer science fiction. In 2013 Carl Benedikt Frey and Michael Osborne of Oxford University used—what else?—a machine-learning algorithm to assess how easily 702 different kinds of job in America could be automated. They concluded that fully 47% could be done by machines “over the next decade or two”.

A new working paper by the OECD, a club of mostly rich countries, employs a similar approach, looking at other developed economies. Its technique differs from Mr Frey and Mr Osborne’s study by assessing the automatability of each task within a given job, based on a survey of skills in 2015. Overall, the study finds that 14% of jobs across 32 countries are highly vulnerable, defined as having at least a 70% chance of automation. A further 32% were slightly less imperilled, with a probability between 50% and 70%. At current employment rates, that puts 210m jobs at risk across the 32 countries in the study.

For a robust analysis, if not refutation, of the findings of Frey and Osborne, I refer you back to Professor Shackleton’s IEA paper. He is more favourably disposed towards the OECD research, which is less apocalyptic in its conclusions. He goes on to find considered counsel in last year’s report from McKinsey Global Institute (2017) A Future that Works: Automation Employment and Productivity.

The IEA paper highlights another factor which makes it difficult to assess the net impact of technological progress, namely, the constantly changing nature of the labour market. As the table below reveals it has hardly been in stasis since the turn of the millennium: –

Percentage change in employment 2001-2017, selected occupations

Percentage change in employment 2001 - 2017 - IEA,ONS, Shackleton

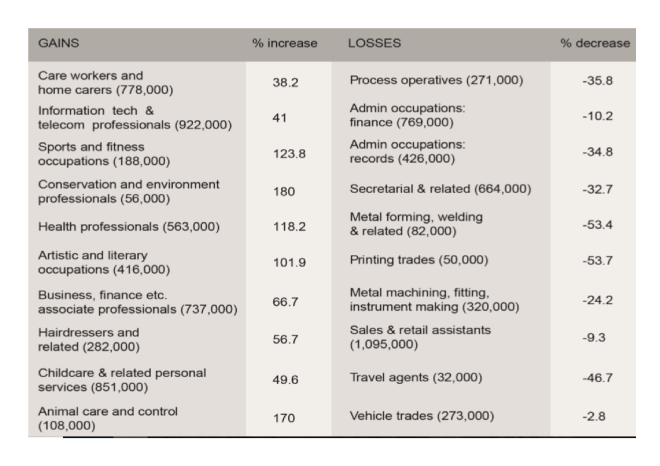
Notes: April-June of years. Figures in brackets are April-June 2017 levels of employment.

Source: Author’s calculation from ONS

The job losses are broadly predictable; that technology has usurped the role of the travel agent is evident to anyone who booked a flight, hotel or hire-car online recently.  For economists there are always challenges in capturing the gains; back in 1987 Robert Solow, a recipient of the Nobel prize from economics,  famously observed, ‘You can see the computer age everywhere but in the productivity statistics’ – perhaps the technology has been creating more jobs than thought. Does the 170% rise in Animal Care and Control owe a debt to technology? You might be inclined to doubt it but the 400,000 Uber drivers of London probably do. We are still seeking signs in the economic data for something we know instinctively should be evident.

Between the mis-measurement of economic activity (if technology is being under-estimated to the tune of 24% in the creative industries sector to what extent are productivity gains from technology being underestimated elsewhere?) and the ever changing employment landscape, I believe the human race will continue to be employed in a wide and varied range of increasingly diverse roles. If some of the more repetitive and less satisfying jobs are consigned to robots and machine learning computer code, so much the better for mankind. For more on, what is sometimes termed, the routinisation of work, this working paper from Bruegel – The impact of industrial robots on EU employment and wages: A local labour market approach – April 2018 is inciteful. They examine six EU countries and make comparisons, or highlighting contrasts, with the patterns observed in the US. Their conclusions are somewhat vague, however, which appears to be a function of the difficulty of measurement: –

We only find mixed results for the impact of industrial robots on wage growth, even after accounting for potential endogeneity and potential offsetting effects across different population or sectoral groups.

…We believe that future research on the topic should focus on exploiting more granular data, to explore whether insignificant aggregate effects (on wages) are to the result of counterbalancing developments happening at the firm level.

Bruegel refrain from proposing cuts to personal taxation as favoured by the IEA, suggesting that a more complex policy response may be required, however, their conclusions are only marginally negative. I am inclined to hope that market forces may be allowed to deal with the majority of the adjustment; they have worked well if history is any guide.

Conclusions and investment opportunities

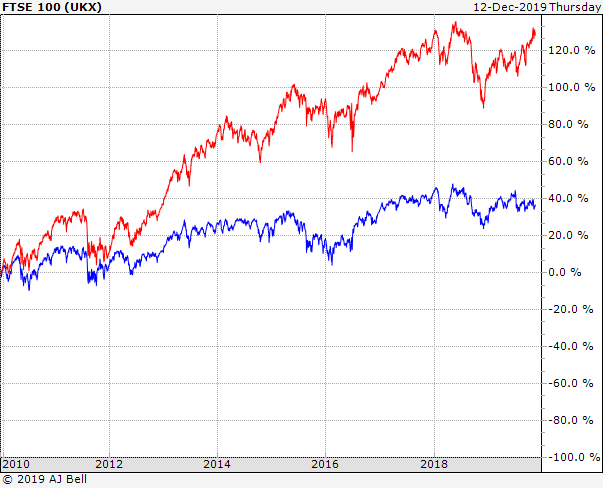
Ignoring the fact that we are nine years into an equity bull market and that interest rates are now rising from their lowest levels ever recorded, the long term potential for technology remains supportive for equity markets, for earnings growth and for productivity. If history repeats, or even if it simply rhymes, it should also be good for employment.

With interest rates looking more likely to rise than fall over the next few years, companies will remain reticent to invest in capital projects. Buying back stock and issuing the occasional special dividend will remain the policy du jour. Assuming we do not suffer a repeat of the great financial recession of 2008 – and that remains a distinct possibility – the boon of technology will create employment with one invisible hand as it creatively destroys it with the other (with apologies to Smith and Schumpeter). If governments can keep their budgets in check and resist the temptation to siphon off investment from the productive sectors of the economy (which, sadly, I doubt) then, in the long run, the capital investment required to create the employment opportunities of the future will materialise.

A safe place to hide – inflation and the bond markets

In the Long Run - small colour logo

Macro Letter – No 91 – 16-02-2018

A safe place to hide – inflation and the bond markets

  • US bond yields have risen from historic lows, they should rise further, they may not
  • The Federal Reserve is beginning to reduce its balance sheet other CBs continue QE
  • US bonds may still be a safe haven but a hawkish Fed makes short duration vulnerable
  • Short dated UK Gilts make be a safe place to hide, come the correction in stocks

US Bonds

I used to think if there was reincarnation, I wanted to come back as the president or the pope or a .400 baseball hitter. But now I want to come back as the bond market. You can intimidate everybody – James Carville 1993

Back in the May 1981 US official interest rates hit 20% for the third time in 14 months, the yield on US 10yr Treasury Bond yields lagged somewhat and only reached their zenith in September of that year, at 15.82%. In those days the 30yr Bond was the global bellwether for fixed income securities; its yield high was only 15.20%, the US yield curve was inverted and America languished in the depths of a deep recession.

More than a decade later in 1993 James Carville, then advisor to President Bill Clinton, was still in awe of the power of the bond market. But is that still the case today? Back then, inflation was the genie which had escaped from the bottle with the demise of the Bretton Woods agreement. Meanwhile, Paul Volker, then Chairman of the Federal Reserve was putting into practice what William McChesney Martin, one of his predecessors, had only talked about, namely taking away the punch bowl. Here, for those who are unfamiliar with the speech, is an extract; it was delivered, by Martin, to the New York Bankers Association on 19th October 1955:-

If we fail to apply the brakes sufficiently and in time, of course, we shall go over the cliff. If businessmen, bankers, your contemporaries in the business and financial world, stay on the sidelines, concerned only with making profits, letting the Government bear all of the responsibility and the burden of guidance of the economy, we shall surely fail. … In the field of monetary and credit policy, precautionary action to prevent inflationary excesses is bound to have some onerous effects–if it did not it would be ineffective and futile. Those who have the task of making such policy don’t expect you to applaud. The Federal Reserve, as one writer put it, after the recent increase in the discount rate, is in the position of the chaperone who has ordered the punch bowl removed just when the party was really warming up.

Back in the October 1955 the Discount rate was 2.30% and the 10yr yield was 2.88%. The economy had just emerged from a recession and would not embark on its next downturn until mid-1957.

Today the US yield curve is also unusually flat, especially by comparison with the inflationary era of the 1970’s, 1980’s and 1990’s. In some ways, however, (barring the inflationary blip in 1951-52) it looks similar to the 1950’s. Here is a chart showing the 10yr yield (blue – LHS) and US inflation (dotted – RHS):-

US Inflation and 10yr bond yield 1950 to 1973

Source: Trading Economics

I believe that in order to protect the asset markets (by which I mean, principally, stocks and real estate) the Federal Reserve (charged as it is with the twin, but not mutually exclusive, objectives of full-employment and stable prices) may decide to focus on economic growth and domestic harmony at the expense of a modicum of, above target, inflation. When Fed Chairman, Martin, talked of removing the punch bowl back in 1955, inflation had already subsided from nearly 10% – mild deflation was actually working its way through the US economy.

Central Bank balance sheets

Today there are several profound differences with the 1950’s, not least, the percentage of the US bond market which is held by Central Banks. As the chart below shows, Central Banks balance sheet expansion continues, at least, at the global level: it now stands at $14.6trn:-

CB_Balance_Sheets_-_Yardeni

Source: Haver Analytics, Yardeni Research

Like the Fed, the BoJ and ECB have been purchasing their own obligations, by contrast the PBoC’s modus operandi is rather different. The largest holders of US public debt (principally T-Bonds and T-Bills) are foreign institutions. Here is the breakdown as at the end of 2016:-

US_debt_ownership_Dec_2016

Source: US Treasury

As of November 2017 China has the largest holding of US debt – US$1.2trn (a combination of the PBoC and state owned enterprises), followed by Japan -US$1.1trn, made up of both private and public pension fund investments. It is not in the interests of China or Japan to allow a collapse in the US bond market, nor is it in the interests of the US government; their ability borrow at historically low yields during the last few years has not encouraged the national debt to decline, nor the budget to balance.

Bond Markets in Europe and Japan

The BoJ continues its policy of yield curve control – targeting a 10bp yield on 10yr JGBs. Its balance sheet now stands at US$4.8trn, slightly behind the ECB and PBoC which are vying for supremacy mustering US$5.5trn apiece. Thanks to the persistence of the BoJ, JGB yields have remained between zero and 10bp since November 2016. As of December 2017 the BoJ owned 46.2% of the total issuance. The ECB, by contrast, holds a mere 19.2% of Eurozone debt.

Another feature of the Eurozone bond market, during the last couple of years, has been the continued convergence in yields between the core and periphery. The chart below shows the evolution of the yield of 10yr Greek Government Bonds (LHS) and German Bunds (RHS). The spread is now at almost its lowest level ever. This may be a reflection of the improved performance of the Greek economy but it is more likely to be driven by fixed income investors continued quest for yield:-

Germany vs Greece 10yr yields

Source: Trading Economics

By contrast with Greece (where yields have fallen) and Germany (where they are on the rise) 10yr Italian BTPs and Spanish Bonos have remained broadly unchanged, whilst French OATs have seen yields rise in sympathy with Germany. Hopes of a Eurobond backed by the EU, to replace the obligations of peripheral nation states, whilst vehemently denied in official circles, appears to remain high.

Japanese and European economic growth, which has surprised on the upside over the past year, needs to prove itself more than purely cyclical. Both regions are reliant on the relative strength of US the economic recovery, together with the continued structural expansion of China and India. The jury is out on whether either Japan or the EU can achieve economic terminal velocity without strong export markets for their goods and services.

The one country in the European area which is behaving differently is the UK; yields have risen but, it stands apart from the rest of the Eurozone; UK Gilts dance to a different tune. Uncertainty about Brexit caused Sterling to decline, especially against the Euro, import prices rose in response, pushing inflation higher. 10yr Gilt yields bottomed in August 2016 at 50bp. Since then they have risen to 1.64% – this is still some distance from the highs of January 2014 when they tested 3.09%. 2yr Gilts are different matter, with a current yield of 71bp they are 63bp from their lows but just 22bp away from the 2014 high of 93bp.

Conclusions and Investment Opportunities

From a personal investment perspective, I have been out of the bond markets since 2013. My reasoning (which proved expensive) was that the real-yields on the majority of markets was already extremely negative and the notional yields were uncomfortably close to zero. Of course these markets went much, much further than I had anticipated. Now I am tempted by the idea of reallocating, despite yields being lower than they were when I exited previously. Inflation in the US is 2.1%, in the Euro Area it is 1.3% whilst in Japan it is still just 1%.

As a defensive investment one should look for short duration bonds, but in the US this brings the investor into conflict with the hawkish policy stance of the Fed; that is, what my friend Ben Hunt of Epsilon Theory dubs, the Inflation Narrative. For a contrary view this Kansas City Fed paper may be of interest – Has the Anchoring of Inflation Expectations Changed in the United States during the Past Decade?

In Japan yields are still too near the zero bound to be enticing. In Germany you need to need to go all the way out to 6yr maturity Bunds before you receive a positive yield. There is an alternative to consider – 2yr Gilts:-

united-kingdom-2-year-note-yield - 5yr

Source: Trading Economics

UK inflation is running at 3% – that puts it well above the BoE target of 2%. Rate increases are anticipated. 2yr Gilt yields have recently followed the course steered by the US and Germany, taking out the highs last seen in December 2015, however, if (although I really mean when) a substantial stock market correction occurs, 2yr Gilt yields have the attraction of being near the top of their five year range – unlike 2yr Schatz which are nearer the bottom of theirs. 2yr Gilts will benefit from a slowdown in Europe and any uncertainty surrounding Brexit. The BoE will be caught between the need to quell inflation and the needs of the economy as a whole. 2yr Gilts also offer the best roll-down on the UK yield curve. The 1yr maturity yields 49bp, whilst the 3yr yields 83bp.

With inflation fears are on the rise, especially in the US and UK, 2yr Gilts make for an uncomfortable investment today, however, they are a serious contender as a safe place to hide, come the real stock market correction.

Hard Brexit maths – walking away

400dpiLogo

Macro Letter – No 77 – 19-05-2017

Hard Brexit maths – walking away

  • The UK’s NIESR estimate the bill for Hard Brexit to the UK at EUR 66bln
  • I guesstimate the cost of Hard Brexit to the EU at EUR 62bln
  • Legal experts for both sides suggest UK obligations cease on Brexit
  • A Free-trade deal with the EU may not begin until after March 2019

…How selfhood begins with a walking away…

C. Day-Lewis

It has been estimated that if the UK accedes to EU demands for a further EUR 100bln in order to begin the process of establishing a bi-lateral trade deal with the EU post-Brexit, it will cost the UK economy 4.4% of GDP. According to estimates from the NIESR, to revert to WTO Most Favored Nation terms (the Hard Brexit option) would only cost between -2.7% and -3.7% of GDP (EUR 61bln to EUR 84bln).

In January UK MP May stated:-

No deal is better than a bad deal.

It looks, on this basis, as though the UK may indeed walk away from its purported EU obligations.

A more considered analysis from, the politically influential Brussels based thin-tank Bruegel – Divorce settlement or leaving the club? A breakdown of the Brexit bill – suggests a more modest final bill:-

Depending on the scenario, the long-run net Brexit bill could range from €25.4 billion to €65.1 billion, possibly with a large upfront UK payment followed by significant EU reimbursements later.

This substantial price range is due to the way the UK’s share of liabilities is calculated. At 12% (the UK’s rebate-adjusted share of EU commitments) it is EUR 25.4bln. At 15.7% (the UK’s gross contributions without a rebate adjustment) it rises to EUR 65.1bln.

The House of Lords legal interpretation – Brexit and the EU budget:-

Article 50 provides for a ‘guillotine’ after two years if a withdrawal agreement is not reached unless all Member States, including the UK, agree to extend negotiations. Although there are competing interpretations, we conclude that if agreement is not reached, all EU law—including provisions concerning ongoing financial contributions and machinery for adjudication—will cease to apply, and the UK would be subject to no enforceable obligation to make any financial contribution at all.

This suggests all of the UK’s commitments to the EU are linked to membership. If that legal interpretation is correct, there would be no Brexit bill at the moment of departure. Apparently EU legal experts have arrived at similar conclusions. The Telegraph – €100bn Brexit bill is ‘legally impossible’ to enforce, European Commission’s own lawyers admit has more on this contentious subject.

Setting aside the legal obligations in favour of a diplomatic solution, what is the price range where a potential agreement may lie? The cost to the UK appears to be capped at EUR 84bln in a worst case scenario. One may argue that the ability of Sterling to decline, thus improving the UK’s terms of trade, makes this scenario unrealistically high, but as I discussed in – Uncharted British waters – the risk to growth, the opportunity to reform historic evidence doesn’t support the case very well at all:-

Another factor to consider, since the June vote, is whether the weakness of Sterling will have a positive impact on the UK’s chronic balance of payments deficit. This post from John Ashcroft – The Saturday Economist – The great devaluation myth suggests that, if history even so much as rhymes, it will not:-

If devaluation solved the problems of the British Economy, the UK would have one of the strongest trade balances in the global economy…. the depreciation of sterling in 2008 did not lead to a significant improvement in the balance of payments. There was no “re balancing effect”. We always argued this would be the case. History and empirical observation provides the evidence.

There was no improvement in trade as a result of the exit from the ERM and the subsequent devaluation of 1992, despite allusions of policy makers to the contrary. Check out our chart of the day and the more extensive slide deck below.

Seven reasons why devaluation doesn’t improve the UK balance of payments …

1 Exporters Price to Market…and price in Currency…there is limited pass through effect for major exporters

2 Exporters and importers adopt a balanced portfolio approach via synthetic or natural hedging to offset the currency risks over the long term

3 Traders adopt a medium term view on currency trends better to take the margin boost or hit in the short term….rather than price out the currency move

4  Price Elasticities for imports are lower than for exports…The Marshall Lerner conditions are not satisfied…The price elasticities are too limited to offset the “lost revenue” effect

5  Imports of food, beverages, commodities, energy, oil and semi manufactures are relatively inelastic with regard to price. The price co-efficients are much weaker and almost inelastic with regard to imports

6 Imports form a significant part of exports, either as raw materials, components or semi manufactures. Devaluation increases the costs of exports as a result of devaluation

7 There is limited substitution effect or potential domestic supply side boost

8 Demand co-efficients are dominant


But what is the economic impact on the EU? CIVITAS – Potential post-Brexit tariff costs for EU-UK trade postulates some estimates:-

Our analysis shows that if the UK leaves the EU without a trade deal UK exporters could face the potential impact of £5.2 billion in tariffs on goods being sold to the EU. However, EU exporters will also face £12.9 billion in tariffs on goods coming to the UK.

Exporters to the UK in 22 of the 27 remaining EU member states face higher tariffs costs when selling their goods than UK exporters face when selling goods to those countries.

German exporters would have to deal with the impact of £3.4 billion of tariffs on goods they export to the UK. UK exporters in return would face £0.9 billion of tariffs on goods going to Germany.

French exporters could face £1.4 billion in tariffs on their products compared to UK exporters facing £0.7 billion. A similar pattern exists for all the UK’s major EU trading partners.

The biggest impact will be on exports of goods relating to vehicles, with tariffs in the region of £1.3 billion being applied to UK car-related exports going to the EU. This compares to £3.9 billion for the EU, including £1.8 billion in tariffs being applied to German car-related exports.

The net Trade Effect of a Hard Brexit on the basis of these calculations is EUR 7.7bln in favour of the UK.

Then we must consider the UK contribution to the EU budget, which, if the House of Lords assessment is confirmed, will be zero after Brexit. This will cost the EU EUR7.8bln, based on the 2017 net EU budget of EUR 134bln, to which the UK is currently the second largest contributor at 5.8%.

Next there is the question of the impact on EU27 economic growth. These headwinds will be felt especially in the Netherlands, Ireland and Cyprus but the largest absolute cost will be borne by Germany.

According to a February 2016 study by DZ Bank, a Hard Brexit would be to reduce German economic growth by -0.5%, from 1.7% to 1.4% – EUR 18.5bln. Credit Agricole published a similar study of the impact on the French economy in June 2016. They estimated that French GDP would be reduced by -0.4% in the event of a free-trade agreement and -0.6% in the event of a Hard Brexit – EUR 13.2bln. The Netherlands Bureau for Economic Policy Analysis (CPB) estimated the cost to the Netherlands at -1.2% – EUR 8.2bln. Italian Government forecasters estimate the impact at -0.5 to -1% – taking the best case scenario – EUR 8.3bln. A leaked Spanish Government report from March 2017 (interestingly, the only estimate I have been able to uncover since the Brexit vote) indicates a cost of between -0.17% and -0.34% of GDP – again, taking the best case – EUR 2bln. Ireland, given its geographic position, shared language and border, has, perhaps the closest ties with the UK of any EU27 country. Back in 2016 the Irish ERSI estimated the impact on Ireland at only -1%, I suspect it might be greater but I will take them at their word – EUR 2.6bln.

In the paragraph above I have looked at just five out of the EU27. Added together the cost to just these five countries is EUR 52.8bln, but I believe it to be representative, they accounted for 84.74% of EU GDP in 2016. From this I arrive at an extrapolated cost to the EU of a Hard Brexit of EUR 62.3bln.

The European Commission has indicated that the cost for the UK to begin negotiating the terms of a new free-trade agreement with the EU may be as much as EUR 100bln. The cost to the UK, of simply walking away – Hard Brexit – is estimated at between EUR 61bln and EUR 84bln per annum. The cost of Hard Brexit to the EU is estimated (I should probably say guesstimated, since there are so many uncertainties ahead) at EUR 62bln. A simple cost benefit analysis suggests that both sides have relatively similar amounts to lose in the short term. And I hate to admit it, but looked at from a negative point of view, in the long run, the UK, with its structural current account and trade deficit, may have less to lose from simply walking away.

Conclusion and Investment Opportunities

Brexit negotiations are already and will remain deeply political. From a short-term economic perspective it makes sense for the UK to walk away and re-establish its relationships with its European trading partners in the longer run. Given the UK trade deficit with the EU it has the economic whip-hand. Working on the assumption that Jean Claude Junker is not Teresa May’s secret weapon (after all, suggesting ever higher costs for negotiating a free-trade deal makes it more likely that the UK refuses to play ball) one needs to step back from the economics of the situation. The politics of Brexit are already and will probably become even more venal. For the sake of the UK economy, and, for that matter the economies of the EU, I believe it is better for the UK to walk away To those of you who have read my previous articles about Brexit, I wish to make clear, this is a change of opinion, politics has trumped economic common sense.

The implications for the UK financial markets over the next 22 months is uncertainty, although May’s decision to adopt a Hard Brexit starting point has mitigated a substantial part of these risks. Sterling is likely to act as the principle safety valve, however, a fall in the trade-weighted value of the currency will feed through to higher domestic inflation. Short term interest rates, and in their wake Gilt yields, are likely to rise in this scenario. Domestic stocks are also likely to be vulnerable to the negative impact of currency weakness and higher interest rates on economic growth. The FTSE 100, however, with 70% of its earnings derived from outside the UK, should remain relatively immune.

What are the prospects for UK financial markets in 2016?

400dpiLogo

Macro Letter – No 47 – 04-12-2015

What are the prospects for UK financial markets in 2016?

  • The EU referendum may take place as early at as June next year
  • Financial markets appear to be ignoring the vote at present
  • The tightening of bank capital requirements is almost over
  • Higher tax receipts have tempered the pace of fiscal tightening

In assessing the prospects for UK financial markets next year I will focus on three areas, the EU referendum, the stability of the financial system and the state of government finances.

The EU Referedum

As we head into 2016 political and economic commentators are beginning to focus on the potential impact of a UK exit from the EU would have on the British economy. Given the size and importance of the financial services sector to the economy, I want to investigate claims that a UK exit would be damaging to growth and lead to a rise in unemployment. For a more general overview of the referendum please see my July 3rd post – Which way now – FTSE, Gilts, Sterling and the EU referendum?

In February a report by the UK Parliament – Financial Services: contribution to the UK economy opened with the following statement:-

In 2014, financial and insurance services contributed £126.9 billion in gross value added (GVA) to the UK economy, 8.0% of the UK’s total GVA. London accounted for 50.5% of the total financial and insurance sector GVA in the UK in 2012. The sector’s contribution to UK jobs is around 3.4%. Trade in financial services makes up a substantial proportion of the UK’s trade surplus in services. In 2013/14, the banking sector alone contributed £21.4 billion to UK tax receipts in corporation tax, income tax, national insurance and through the bank levy.

The GVA was down from a 2009 high of 9.3%. For London the GVA was 18.6%. In international terms the UK ranks fourth, behind Luxembourg, Australia and the Netherlands in terms of the size of its financial services sector. As at September 2014, 1.1mln people were employed in the sector. According to research by PWC financial services accounted for £65.6bln or 11.5% of total government tax receipts in 2013-14.

Last week the Evening Standard – ‘Brexit’ would lead to loss of 100,000 bank jobs, says City – cited senior banking figures warning of the potential impact of the UK leaving the EU:-

Mark Boleat, policy chairman at the City of London Corporation, said: “If as a country we were to vote to leave, then London’s position as a leading financial centre would remain but without doubt there would be an impact on our relative size and the jobs we support.”

Confidential client research from analysts at US investment bank Morgan Stanley, seen by the Standard, warned that “firms for whom the EU market is important” would need to “adjust their footprint” in London if the Eurosceptic cause was victorious.

Sir Mike Rake, deputy chair of Barclays and chairman of BT, said: “It is extremely difficult to quantify the number of jobs that would be lost and the time frame over which that might happen but leaving the EU would severely damage London’s competitiveness and our financial services sector.”

There have been growing hints from financial institutions that they are starting to plan for Britain quitting the 28 member club.

Both HSBC, which announced a review of the location of its global headquarters in April, and JP Morgan are reportedly in talks about moving sections of their businesses to Luxembourg in part because of the threat of Brexit.

Deutsche Bank, which employs 9,000 people in Britain, has set up a working group to review whether to move parts of its business from Britain in the event of a UK withdrawal. 

US asset management group Vanguard, which has a City office, has admitted that Brexit would have a “significant impact” on its operation across Europe and has already started planning for it.

Many senior bankers are concerned that they would lose the financial services “passporting” rights enjoyed by fellow EU members.

A fascinating historic assessment of the opinion of the UK electorate towards the EU is contained in this week’s Deloitte – Monday Briefing, they  anticipate a referendum date of either June or September 2016, in order to avoid coinciding with a French (March/April) or German (September) election in 2017:-

Since Ipsos MORI started polling on this issue in 1977 on average 53% of voters in a simple yes/no poll have supported membership and 47% have opposed it. The yes vote reached a low of 26% in 1980 rising, over the following decade, to a peak of 63% in 1991, shortly before the pound’s ejection from the European Exchange Rate Mechanism.

In June of this year Ipsos MORI showed UK public support for the EU, again on a straight yes/no poll, at an all-time peak of 75%. Since then it has fallen away in parallel with heightened UK public concerns about immigration. The most recent Ipsos MORI poll, from mid-October, showed the yes vote at 59%.

More recent polls suggest a further narrowing of the yes lead. Across eight polls carried out in November the yes vote averaged 52% and the no vote 48%.  

The yes vote is, by and large, younger and more affluent than the no. Opposition to the EU rises sharply among the over 40s, an important consideration given that voter turnout is higher among older voters. Conservative voters tend to be more eurosceptic than Labour voters; white voters tend to be more sceptical than non-white voters.

… “don’t knows” averaged around 15% of all voters, more than enough to tip the vote decisively.  

The last referendum on UK membership of what was then the European Economic Community (EEC) was held in 1975, just two years after the UK joined the EEC. The vote was an overwhelming victory for EEC membership, with the electorate voting by 67.2% to 32.8% to stay in.

… In an intriguing paper economists David Bowers and Richard Mylles of Absolute Strategies Research (ASR) outline how the political landscape has shifted in the last 40 years.

… in 1975 the debate was about membership of a trading bloc, the Common Market. For sure, the commitment to “ever closer union” was in the Treaty of Rome, but in 1975 few in the UK, especially in the yes campaign, paid much attention to it. Since then the EU has grown from 9 to 28 members, expanded into Central and Eastern Europe, created the Single Currency and acquired more characteristics of a federal union.

…In 1975 the UK economy was in a shambles, slipping into the role of sick man of Europe. In the previous three years the UK had endured a recession, double digit inflation, endemic industrial unrest and the imposition of a three-day working week to save scarce energy supplies. British voters in 1975 looked enviously to the prosperity and stability of Germany. Today the UK is seeing decent growth, while the euro area grapples with the migration crisis, sluggish activity and the difficulties of building a durable monetary union. On a relative basis the performance of the UK economy looks, for now at least, pretty good.

…The Maastricht Treaty of 1992 established the right of people to live and work anywhere in the EU, but… it was EU enlargement into Central and Eastern Europe in 2004 that caused immigration into the UK to rise markedly, pushing migration up the list of UK voter concerns. More recent migration from North Africa and the Middle East, and the growing problems facing the Schengen nations, have added new concerns.  

The final factor…was the enthusiasm of the majority of the press for the Common Market in 1975. The press gave the then Prime Minister, Harold Wilson, largely uncritical coverage of his negotiations for a “better deal” in Britain’s relationship with the Community. (Historians tend to the view that Wilson actually achieved little in his negotiations with the Community; but he deftly turned meagre result into a public relations triumph). The lone dissenting voice in a general mood of press enthusiasm for the EEC was the Communist Morning Star. This time round it seems likely that a number of major papers will take a euro sceptic line.

The most recent poll, published by ORB last week in the wake of the Paris attacks, found 52% in favour of exit.

Financial Stability

This week saw the release of the Bank of England – Financial Stability Report – December 2015 – it suggests that the UK economy has moved beyond the post-crisis phase, the risks are, once again, external in nature:-

The global macroeconomic environment remains challenging. Risks in relation to Greece and its financing needs have fallen from their acute level at the time of the publication of the July 2015 Report. But, as set out in July, risks arising from the global environment have rotated in origin from advanced economies to emerging market economies. Since July, there have been further downward revisions to emerging market economy growth forecasts. In global financial markets, asset prices remain vulnerable to a crystallisation of risks in emerging market economies. More broadly, asset prices are currently underpinned by the continued low level of long-term real interest rates, which may in part reflect unusually compressed term premia. As a consequence, they remain vulnerable to a sharp increase in market interest rates. The impact of such an increase could be magnified, at least temporarily, by fragile market liquidity.

Domestically, the FPC judges that the financial system has moved out of the post-crisis period. Some domestic risks remain elevated. Buy-to-let and commercial real estate activity are strengthening. The United Kingdom’s current account deficit remains high by historical and international standards, and household indebtedness is still high.

Against these elevated risks some others remain subdued, albeit less so than in the post-crisis period to date. Comparing credit indicators to the past alone cannot provide a full risk assessment of the level of risk today, but can be informative. Aggregate credit growth, though modest compared to pre-crisis growth, is rising and is close to nominal GDP growth. Spreads between mortgage lending rates and risk-free rates have fallen back from elevated levels.

They go on to note that the Tier 1 capital position of major UK banks was 13% of risk-weighted assets in September 2015, below the levels advocated by the Vicker’s Commission but above Basel requirements. The Financial Policy Committee (FPC) are expected to impose a 1% counter-cyclical capital buffer in the near future, but otherwise the fiscal tightening, which has been in train since the aftermath of the financial crisis has finally run its course.

The other risks which concern the Bank are cyber-risks of varying types and, of course, the uncertainty surrounding the EU referendum.

Autumn Statement and Spending Review

Last week saw the publication of the UK Chancellor’s Autumn Statement and Spending Review. Mr Osborne was fortunate; the OBR found an additional £27bln in tax receipts which allowed him to reverse some of the more unpopular spending cuts previously announced. He still hopes to balance the government budget by 2020/2021. Public spending will rise from £757bln this year to £857bln in 2020/21. Assuming the economy grows as forecast, public spending to GDP ratio should fall from 39.7% to 36.5%.

Writing in the Telegraph Mark Littlewood of the IEA said:-

George Osborne has today made a one-way bet. His announcements are based on two predictions: continually low interest rates and sustained strong economic growth, making our debt repayments lower than anticipated and tax revenues higher than expected. These are not unrealistic assumptions, but if either go off course, the savings announced today will not go nearly far enough.

Market Performance

Stocks

Financial markets abhor uncertainty. Concern about collapsing FDI and Scottish devolution due to Brexit, will hang over the markets until the outcome of the vote is known: meanwhile rising rhetoric will discourage investment. Regardless of economic performance UK stocks are likely to underperform.

Back in July I believed the uncertainty about the UK position on the EU would have minimal effect:-

Unless the UK joins the EZ, currency fluctuations will continue whether they stay or go. Gilt yields will continue to reflect inflation expectations and estimates of credit worthiness; being outside the EU might impose greater fiscal discipline on subsequent UK governments – in this respect the benefits of EU membership seem minimal. The UK stock market will remain diverse and the success of UK stocks will be dependent on their individual businesses and the degree to which the regulatory environment is benign.

Here’s how the markets have evolved since the summer. Firstly the FTSE100 vs EuroStox50 and S&P500 – six month chart, at first blush, I was wrong, the FTSE  has underperformed EutoStoxx and the S&P:-

FTSE vs STOX vs SPX 6month

Source: Yahoo Finance

However, the FTSE250 tells a different story:-

FTSE100 vs 250 - 6m

Source: Yahoo Finance

This divergence has been in place for several years as the five year chart below shows:-

FTSE100 vs 250 - 5 yr

Source: Yahoo Finance

Here is the FTSE250 compared to EuroStox50 and the S&P500 – over the same five year period. The mid cap Index has followed the S&P, although in US$ terms its performance has been less impressive:-

FTSE250 vs EurStox and S&P - 5yr

Source: Yahoo Finance

Gilts and Bunds

During the period since the beginning of July the spread between 10yr Gilts and Bunds has ranged between 112bp and 145bp reaching its narrowest during the fall in equity markets in August and widening amid concerns about European growth last month. UK Inflation expectations remain subdued; this is how the MPC – November Inflation Report described it:-

All members agree that, given the likely persistence of the headwinds weighing on the economy, when Bank Rate does begin to rise, it is expected to do so more gradually and to a lower level than in recent cycles.

Sterling

The Sterling Effective Exchange Rate has traded in a relatively narrow range (please excuse the date axis, vagaries of the Bank of England’s data format – this is a one year chart):-

GiltBund JulNov

Source: Bank of England

During  stock market weakness in the summer Sterling strengthened. After weakening in October it rebounded, following the US$, in November.

Back in July I anticipated a weakening of Sterling:-

Ahead of the referendum, uncertainty will lead to weakness in Sterling, higher Gilt yields and relative underperformance of UK stocks. If the UK electorate decide to remain in the EU, there will be a relief rally before long-term trends resume. If the UK leaves the EU, Sterling will fall, inflation will rise, Gilt yields will rise in response and the FTSE will decline. GDP growth will slow somewhat, until an export led recovery kicks in as a result of the lower value of Sterling. The real cost to the UK is in policy uncertainty.

It may be that capital outflows are about to begin in earnest but I start to question my assumptions – the market seems to be caught between the uncertainty surrounding UK membership of the EU and doubts about the longevity of the “European Experiment” as a whole.

Conclusion

Gilts remain below their long run average spread over Bunds but the interest rate environment is exceptionally benign, making any pick up in yield attractive. The FTSE250 index appears to be ignoring concerns about collapsing commodities, slowing emerging markets – especially China – and the prospect of Brexit, but it may struggle to remain detached for much longer. Sterling also appears to have ignored the referendum debate so far. Or perhaps, the UK market is a relative “safe haven” offering exposure to European markets without the angst of Euro membership – either way I remain cautious until the political uncertainties dissipate.