Macro Letter – No 131 – 21-08-2020
When does a recession become a depression?
- Defining a depression as opposed to a recession is open to wide interpretation
- Recessions are a natural part of the credit cycle
- Depressions are destroyers of a nation’s wealth
- Fiscal policy can help ease the pain of ‘creative destruction’ but long-term planning is key
There is a tide in the affairs of men
Which, taken at the flood, leads on to fortune.
William Shakespeare (Julius Caesar)
When your neighbour loses their job, it’s a recession.
When you lose your job, that’s a depression!
Harry S. Truman (33rd President of the Unites States)
The common knowledge definition above is grim and highly specific, but its banality serves to highlight the fact that the recession/depression question is not that simple to answer. Back in 2007 The Federal Reserve Bank of San Francisco – What is the difference between a recession and a depression? – attempted to reach a conclusion. They embraced the NBER definition of a recession: –
A recession is a significant decline in economic activity spread across the economy, lasting more than a few months, normally visible in real GDP, real income, employment, industrial production, and wholesale-retail sales. A recession begins just after the economy reaches a peak of activity and ends as the economy reaches its trough. Between trough and peak, the economy is in an expansion. Expansion is the normal state of the economy; most recessions are brief and they have been rare in recent decades.
And turned to Gregory Mankiw to distinguish between the two states of economic contraction: –
There are repeated periods during which real GDP falls, the most dramatic instance being the early 1930s. Such periods are called recessions if they are mild and depressions if they are more severe.
Despite the Federal Reserve’s valiant efforts, the simpler and more commonly accepted definition of a recession is a consecutive two quarters of decline in GDP. When it comes to depressions, however, there is little consensus; the two most common descriptions are: –
- A decline in GDP of more than 20%
- A period of more than two years of declining GDP
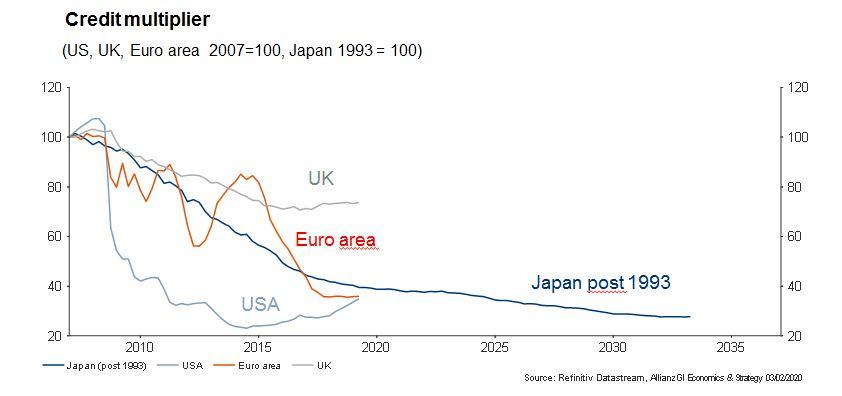
Whilst the two definitions are not mutually exclusive, they are broadly different. I believe the difference between a recession and a depression is more nuanced. A recession is a natural part of the business (or perhaps we should say credit) cycle, a depression, by contrast, involves the physical destruction of the economy – businesses are irreparably broken, employment opportunities terminally destroyed, investment has to be totally written off.
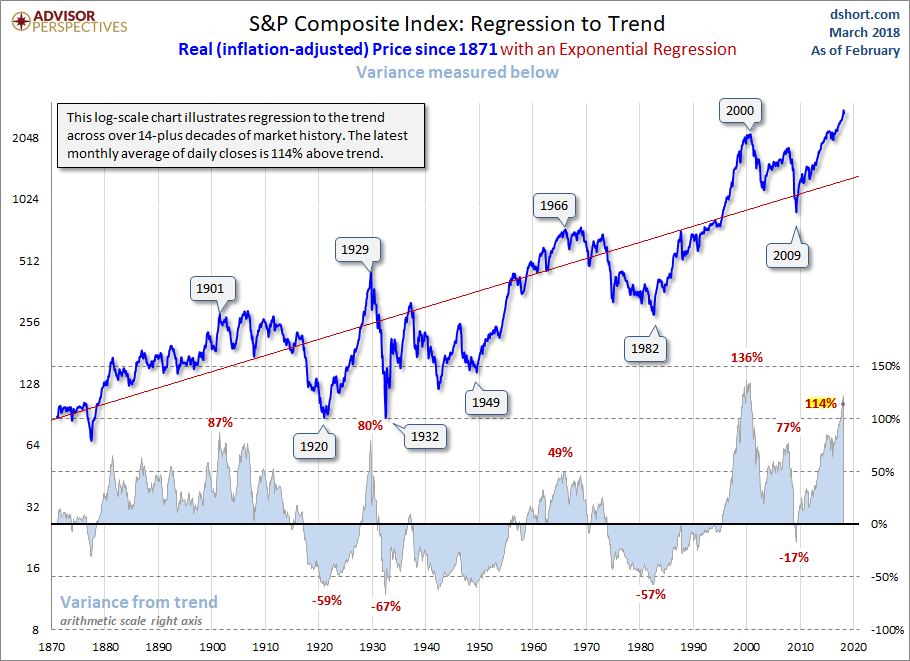
An alternative approach is to examine previous great depressions. Alas, this method proves equally inconsistent, for example the Great Depression of the 1930’s is generally considered to have lasted from 1929 to 1941 and yet, as the chart below reveals, there were only two distinct periods of declining GDP growth between 1930 and 1933 and again between 1937 and 1938: –
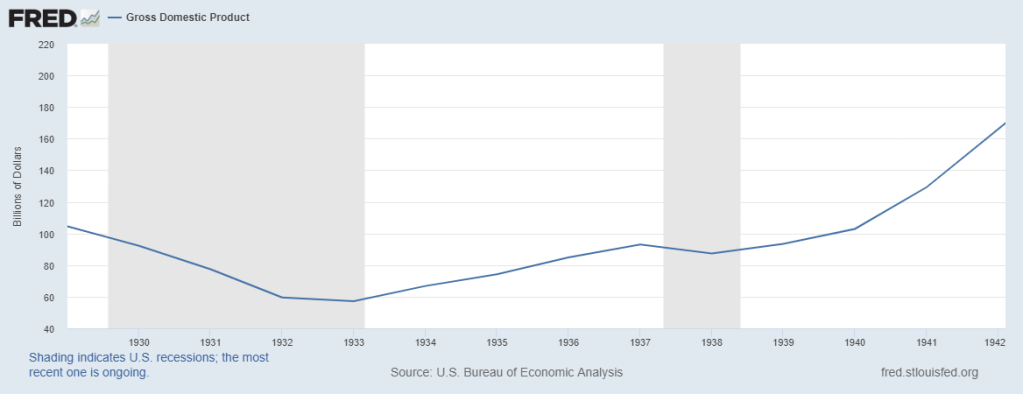
Source: Federal Reserve Bank of St Louis
Notwithstanding my more prosaic definition above, I favour the two year plus definition over that of a sharp decline in GDP. A recession hurts some parts of an economy, a depression is more widespread.
Another factor often associated with recessions and depressions is a rise in the rate of unemployment. Historically, rising unemployment has preceded the onset of recessions and only once recessions have become protracted have they been dubbed depressions.
A further differentiator relates to the absolute level of inflation. In general, as inflation rises, central banks respond by raising short-term interest rates. This helps to cool overheating economies, however, if they tighten too aggressively they may prompt a recession as the credit cycle is forced into a sharp contraction. By contrast a depression is often accompanied by an absolute fall in the price level, caused by an excessive overhang of domestic or corporate debt.
As an investor, why does a depression definition matter? Because financial markets are forward looking. If investors believe the recovery from the Covid-19 pandemic will be ‘V’ Shaped, then, even a 20% decline in GDP, together with zero interest rates, price support for government bonds and a fiscal expansion on a scale not witnessed since the ‘New Deal’ of FDR, will rapidly translate inot a sharply rising stock market. If, by contrast, it becomes clear that a tsunami of creative destruction is sweeping away entire industries, then even the most lavish of New New Deals may be insufficient to hold back the tide of stock liquidation as market participates rush to the safety of cash.
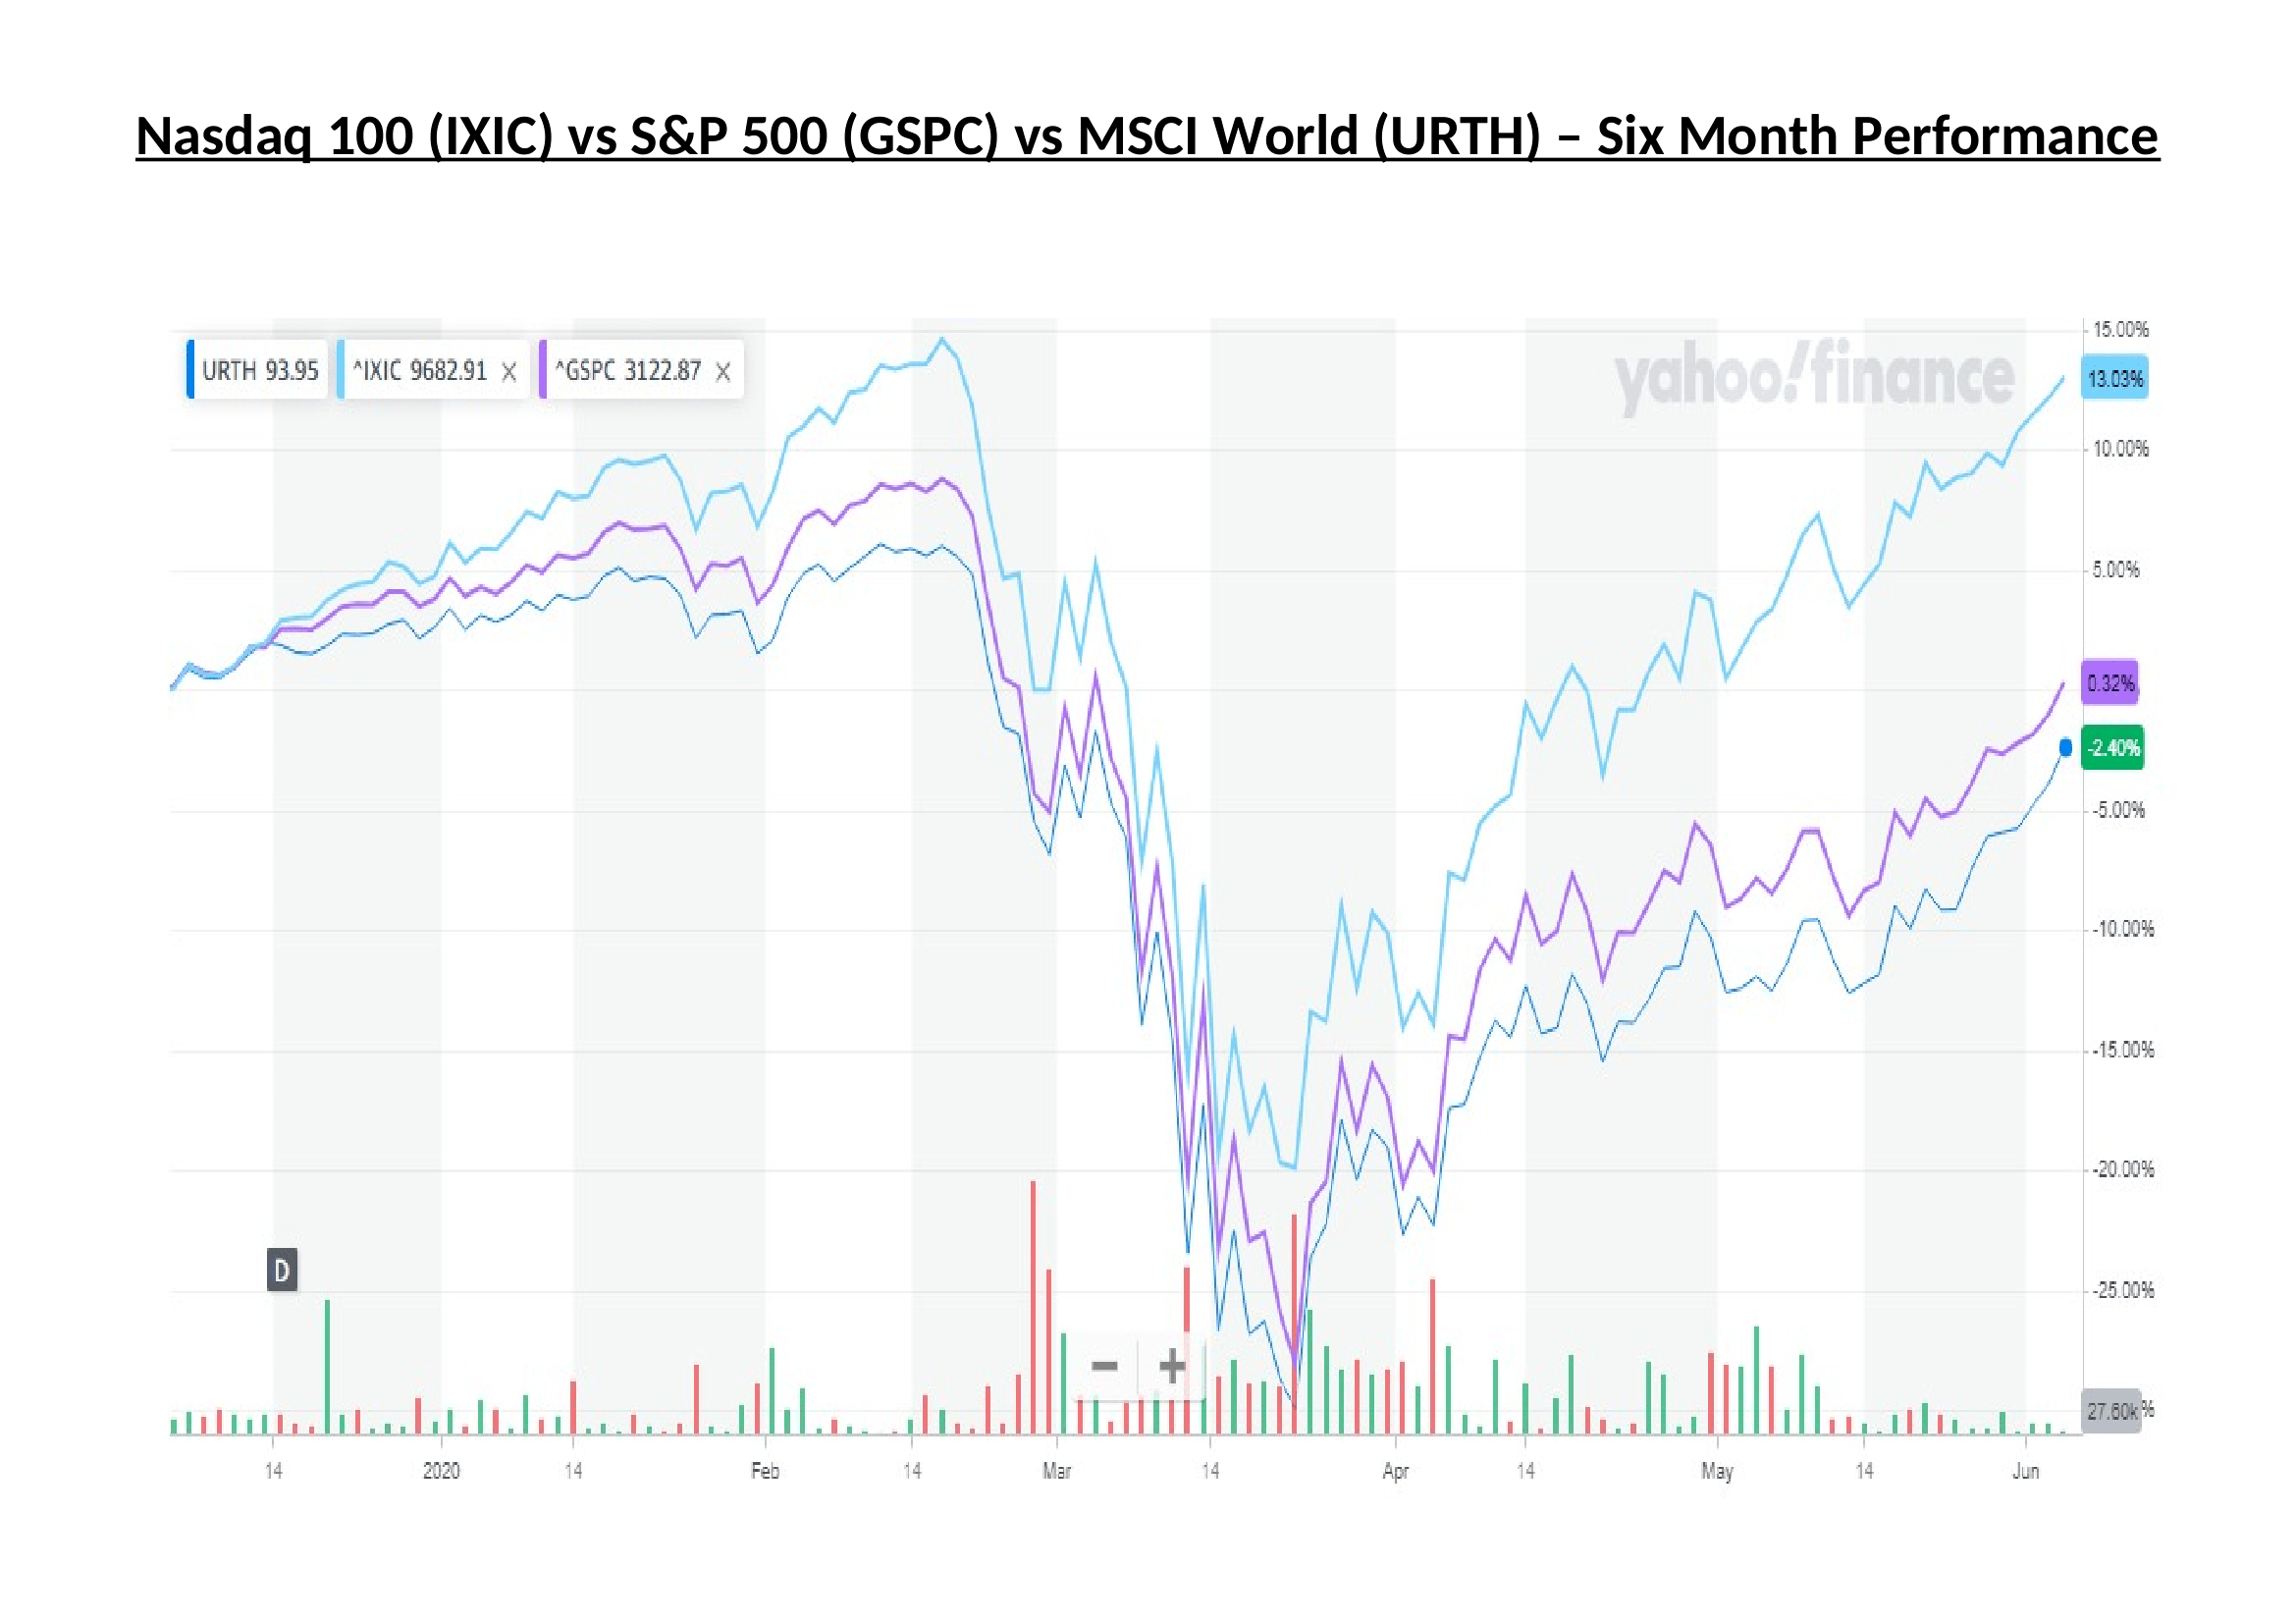
So far the official policy response has been sufficient to convince investors that a depression will be avoided. Scratch the surface of the S&P 500, however, and a rather different picture appears. The chart below shows market performance up to the end of May. The same five technology stocks have continued to drive S&P 500 index performance since then: –
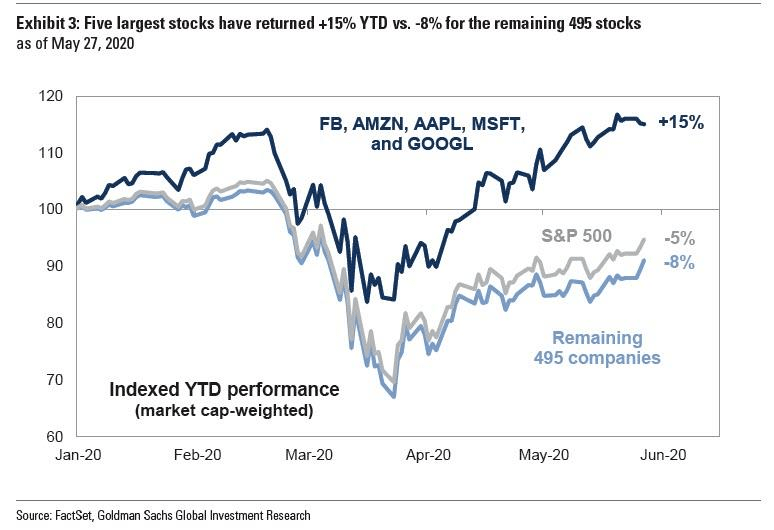
Source: FactSet, Goldman Sachs
Technology has been the top performing sector. One argument for such elevated valuations rests on the premise that the pandemic has accelerated a wide range of technology trends bringing with it the potential for much swifter profits. In finance parlance, the net present value of future technology cash-flows has been brought forward by, some analysts suggest, several years. No wonder, they argue, that these stocks have broken to new all-time highs: and will continue, higher.
Since May, the broader stock market has hung of tech coattails (at the time of writing – 19-8-2020 -the MSCI World Index is up 1.73% YTD). For the present, hope triumphs over fear, yet vaccines remain many months from being widely available, meanwhile, for the Northern hemisphere, autumn – and fears of a second wave of infections – draws imminently near.
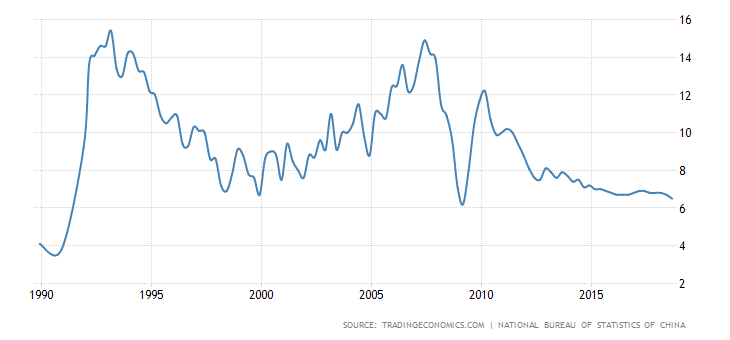
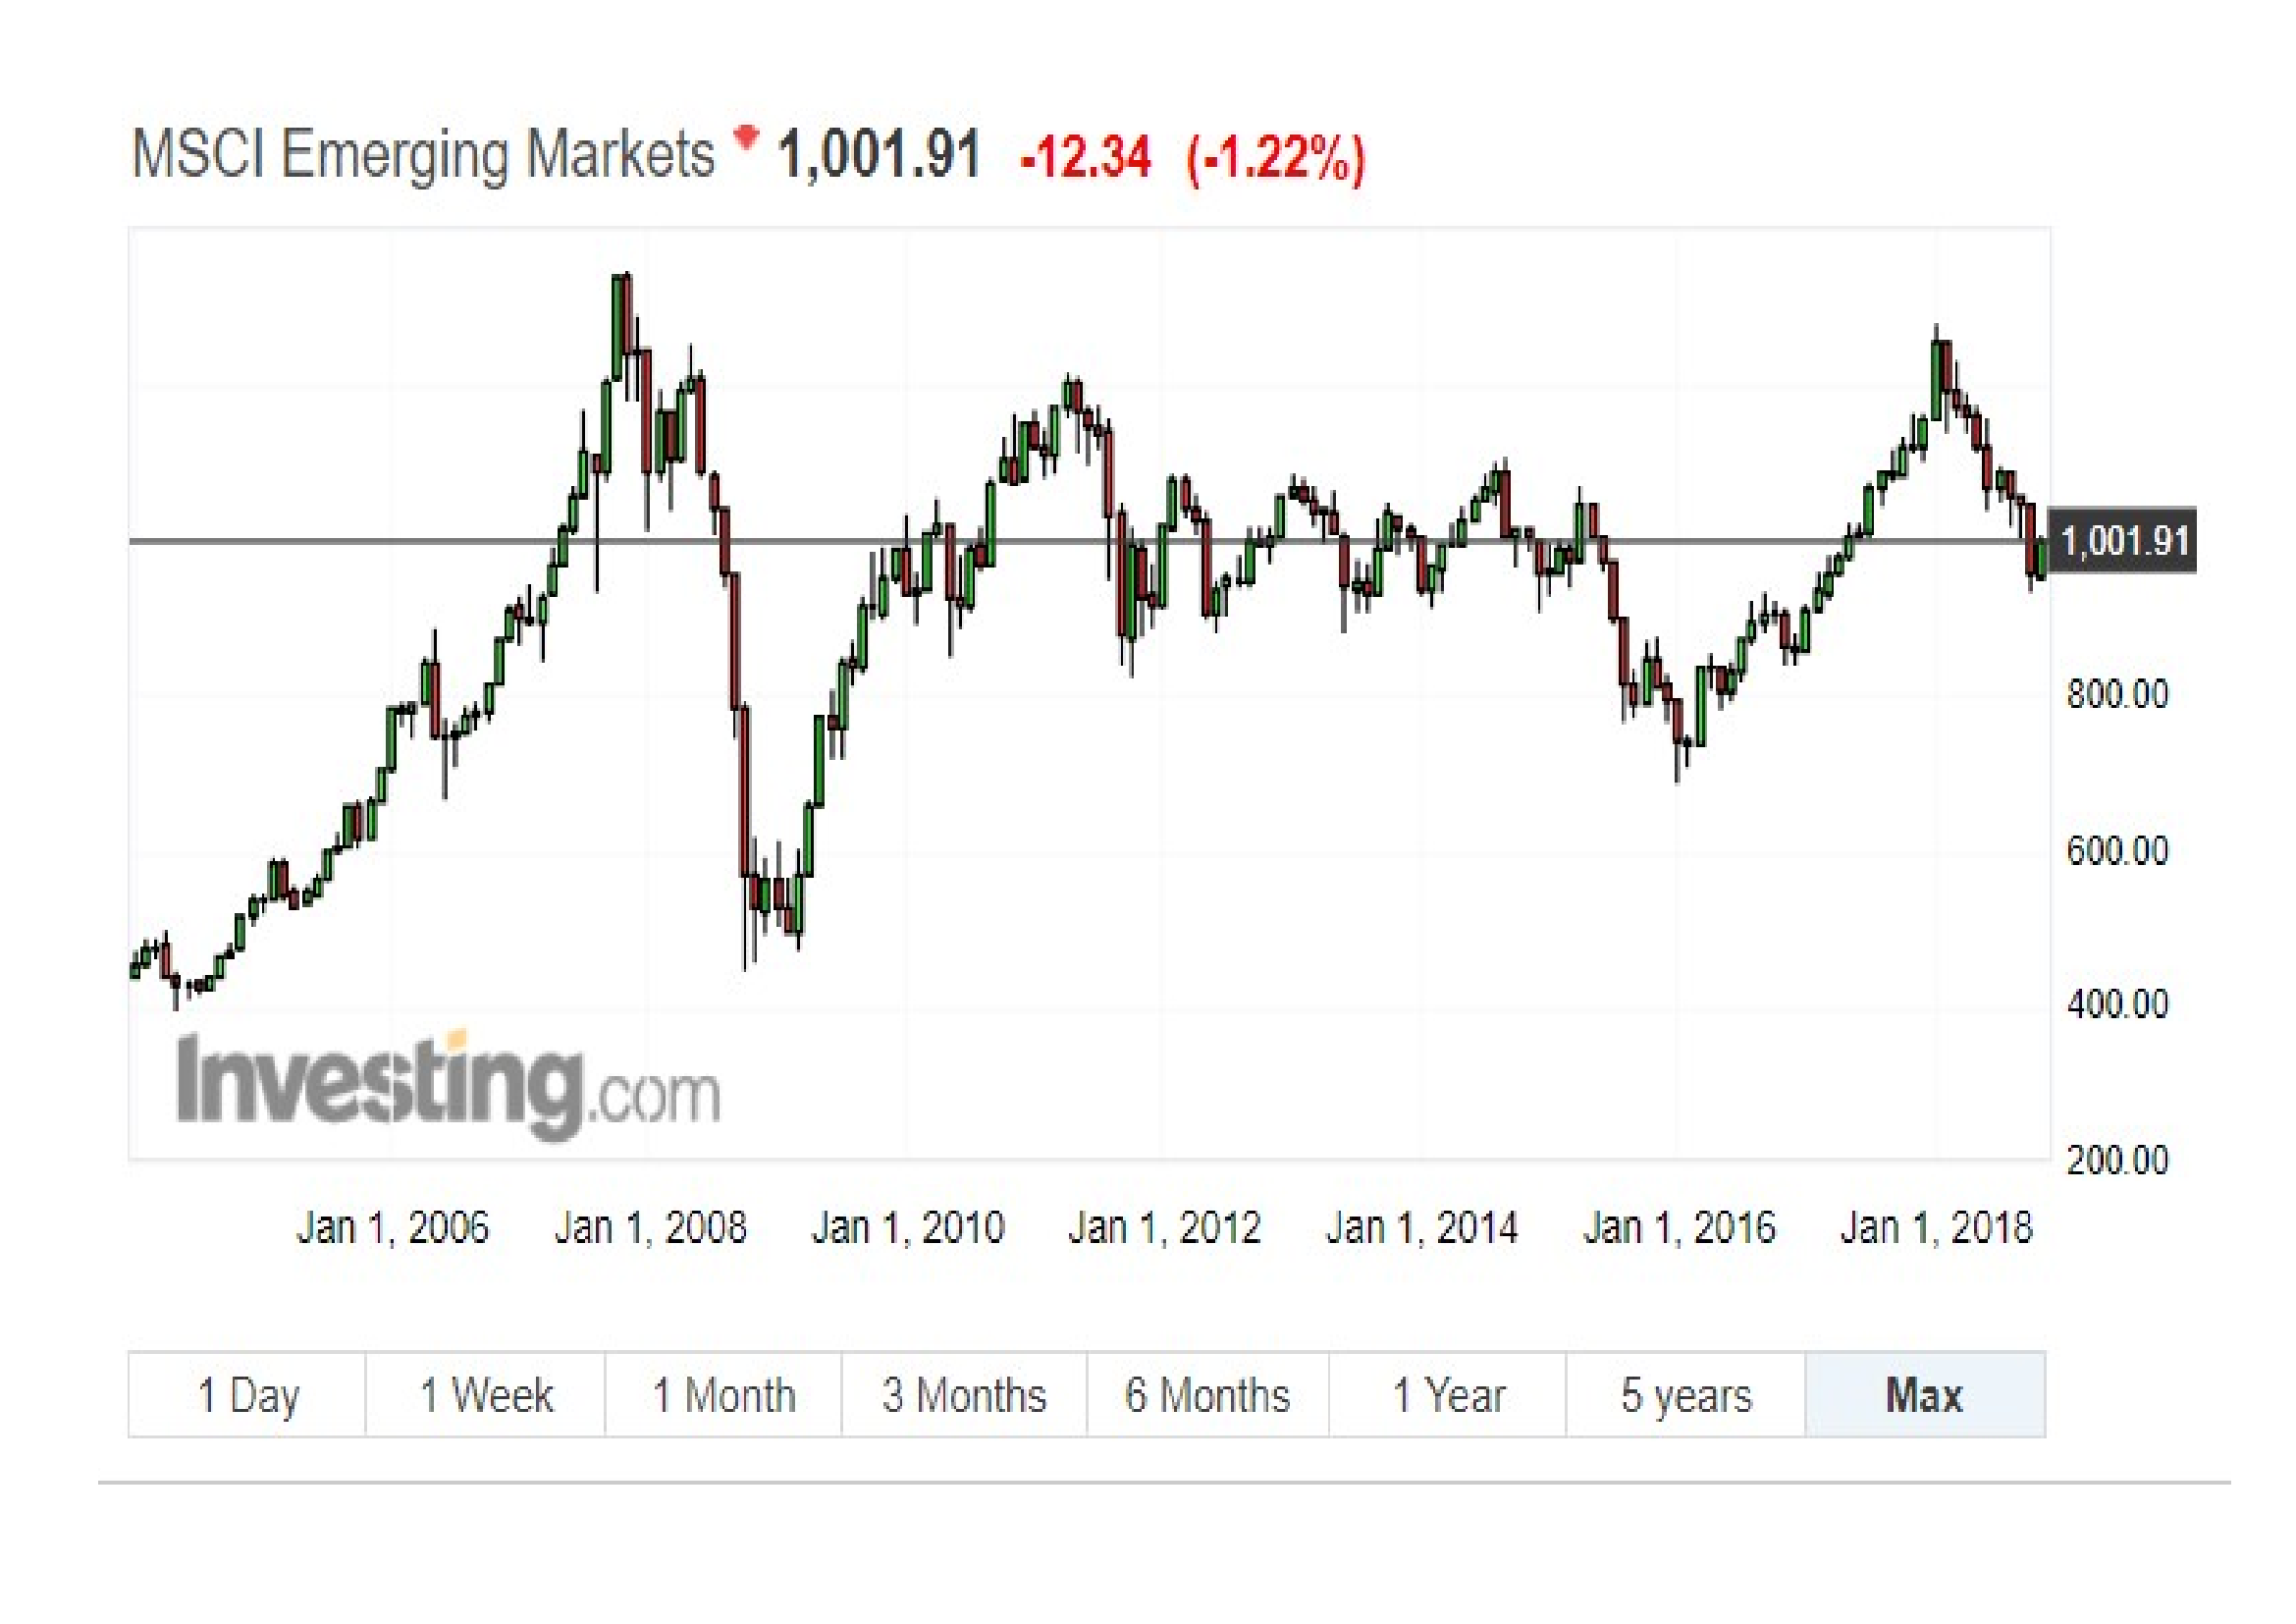
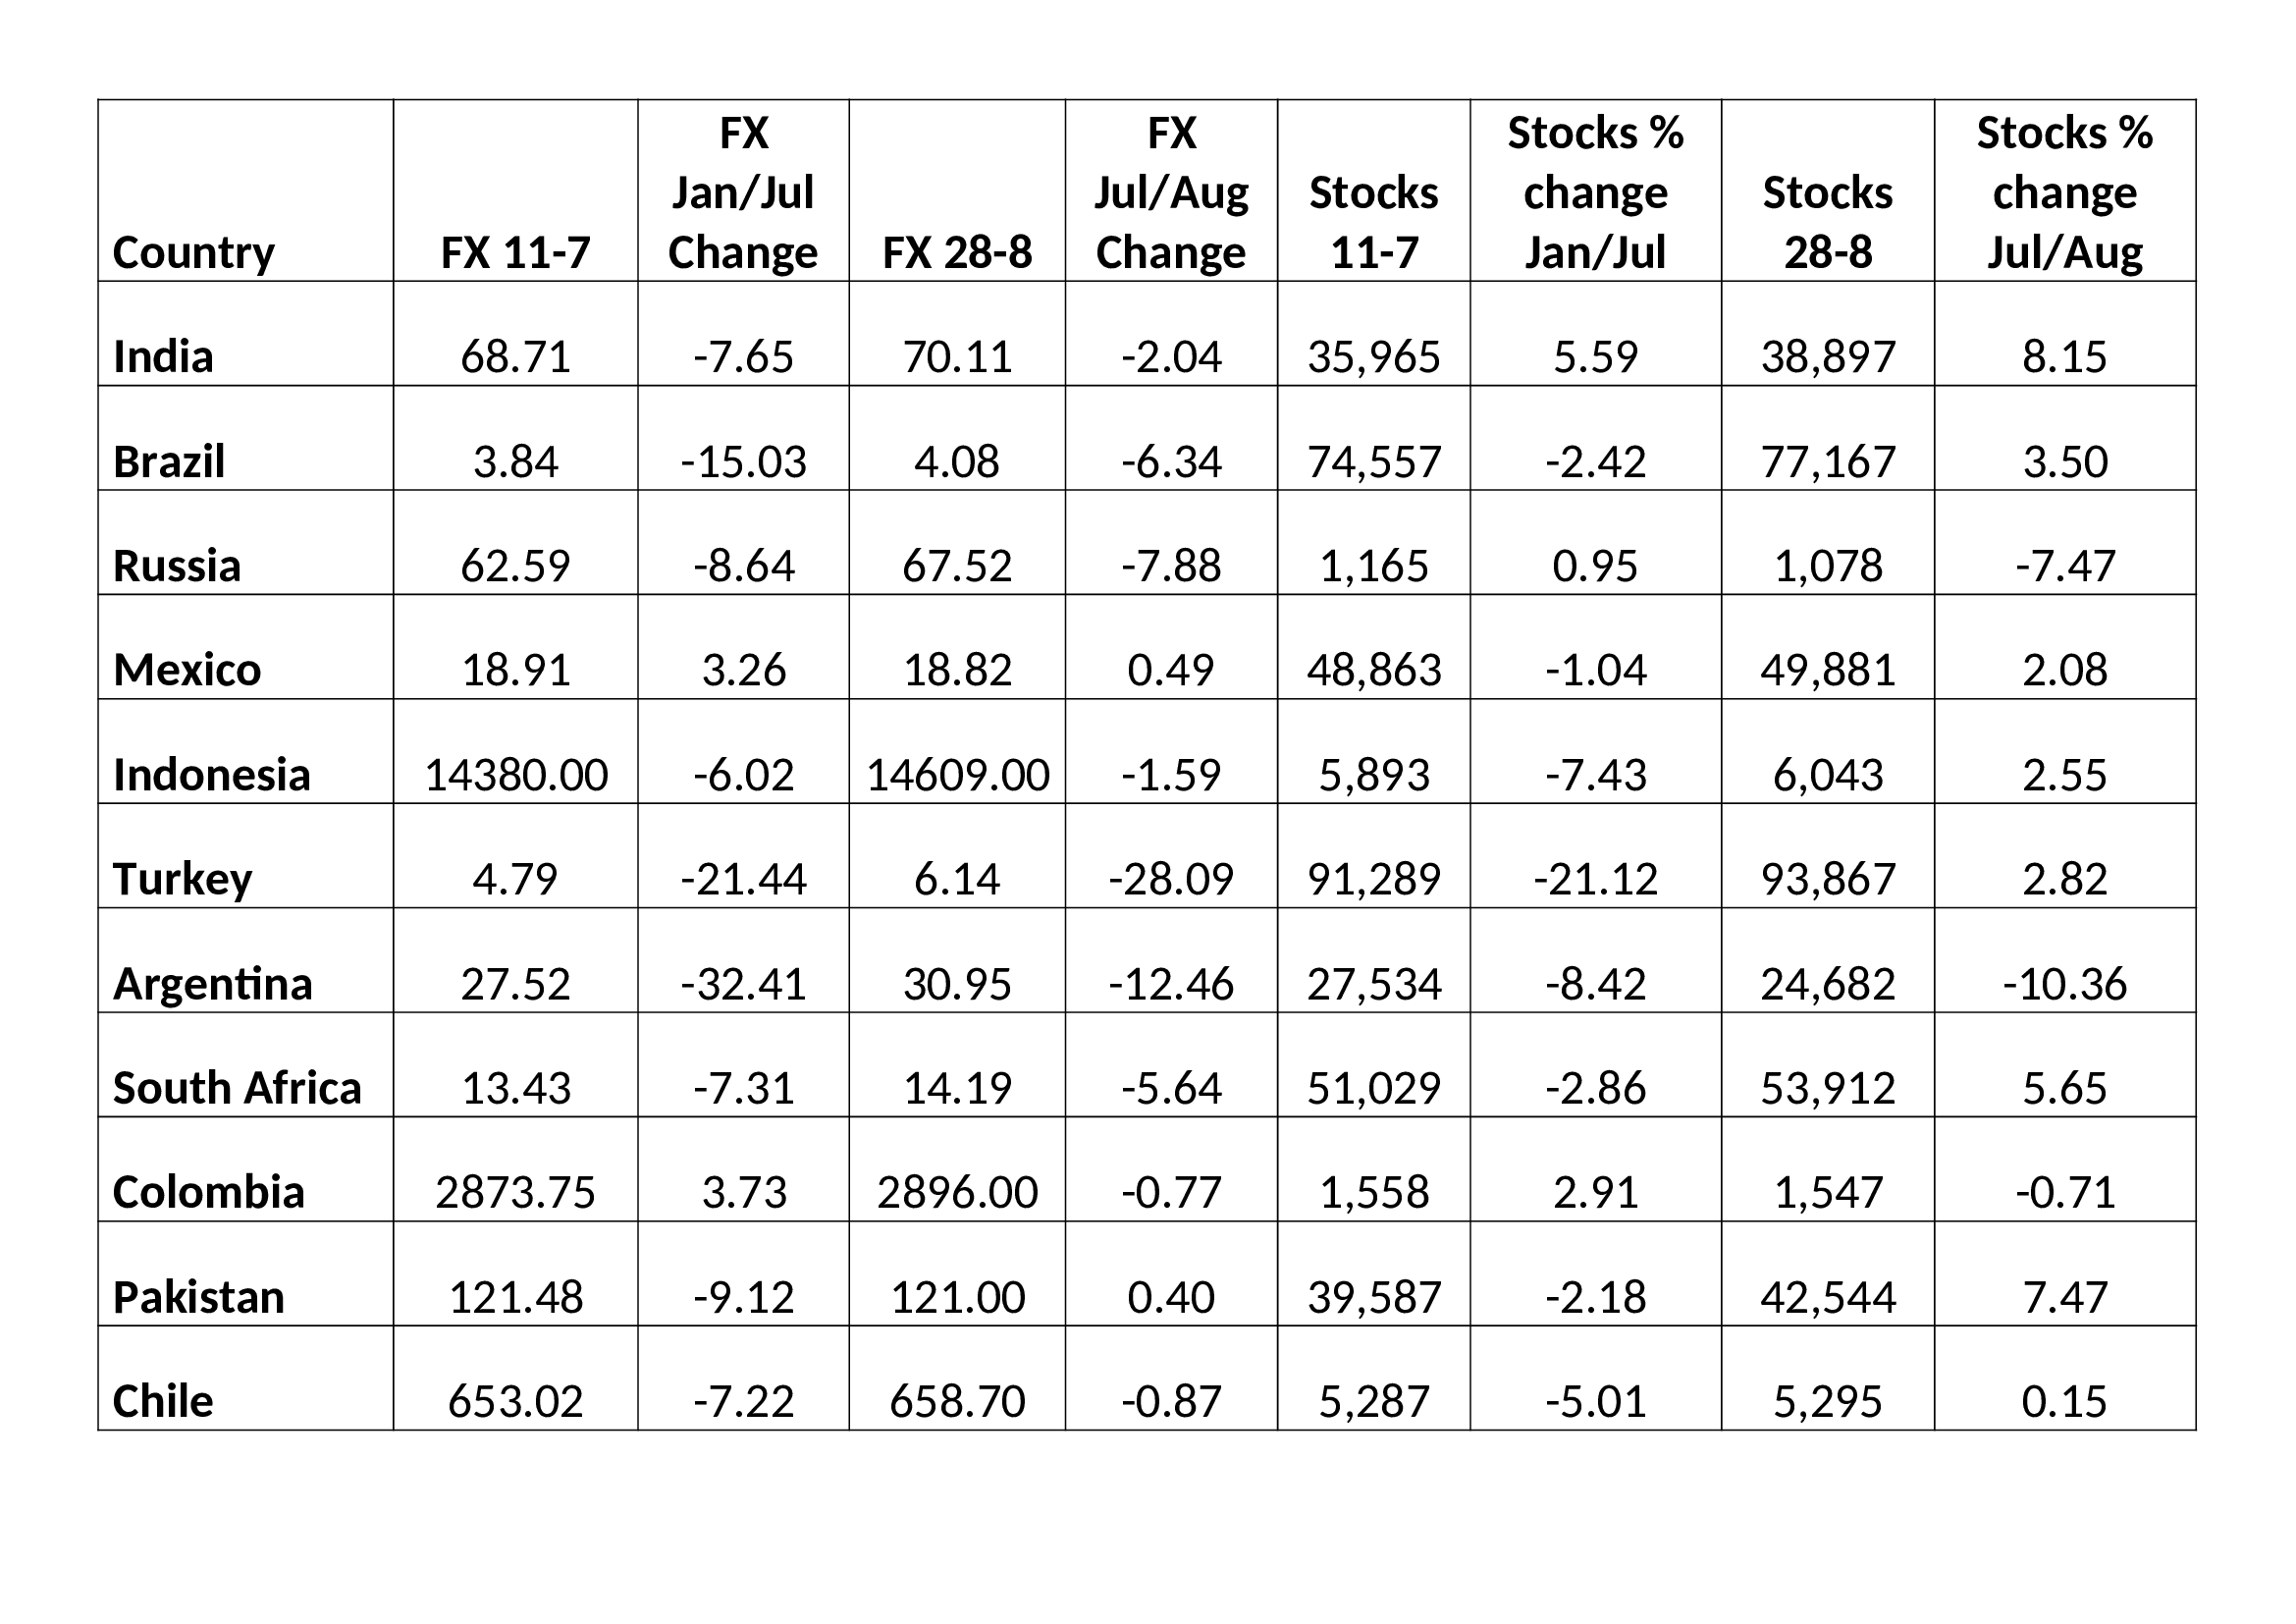
For emerging markets the situation is worse still. As Carmen and Vincent Reinhart, writing in Foreign Affairs – The Pandemic Depression– put it: –
Although dubbed a “global financial crisis,” the downturn that began in 2008 was largely a banking crisis in 11 advanced economies. Supported by double-digit growth in China, high commodity prices, and lean balance sheets, emerging markets proved quite resilient to the turmoil of the last global crisis. The current economic slowdown is different. The shared nature of this shock—the novel coronavirus does not respect national borders—has put a larger proportion of the global community in recession than at any other time since the Great Depression. As a result, the recovery will not be as robust or rapid as the downturn. And ultimately, the fiscal and monetary policies used to combat the contraction will mitigate, rather than eliminate, the economic losses, leaving an extended stretch of time before the global economy claws back to where it was at the start of 2020.
The World Bank estimates globally more than 60mln people will be pushed into severe poverty. Meanwhile, in developed countries, bankruptcies, which have been postponed by government intervention, may meet their personal epiphanies as fiscal largesse is suddenly withdrawn. Unless the lockdown restrictions are lifted and people feel safe, both medically and financially, to venture out and spend, the destruction of large swathes of developed market economies has simply been deferred.
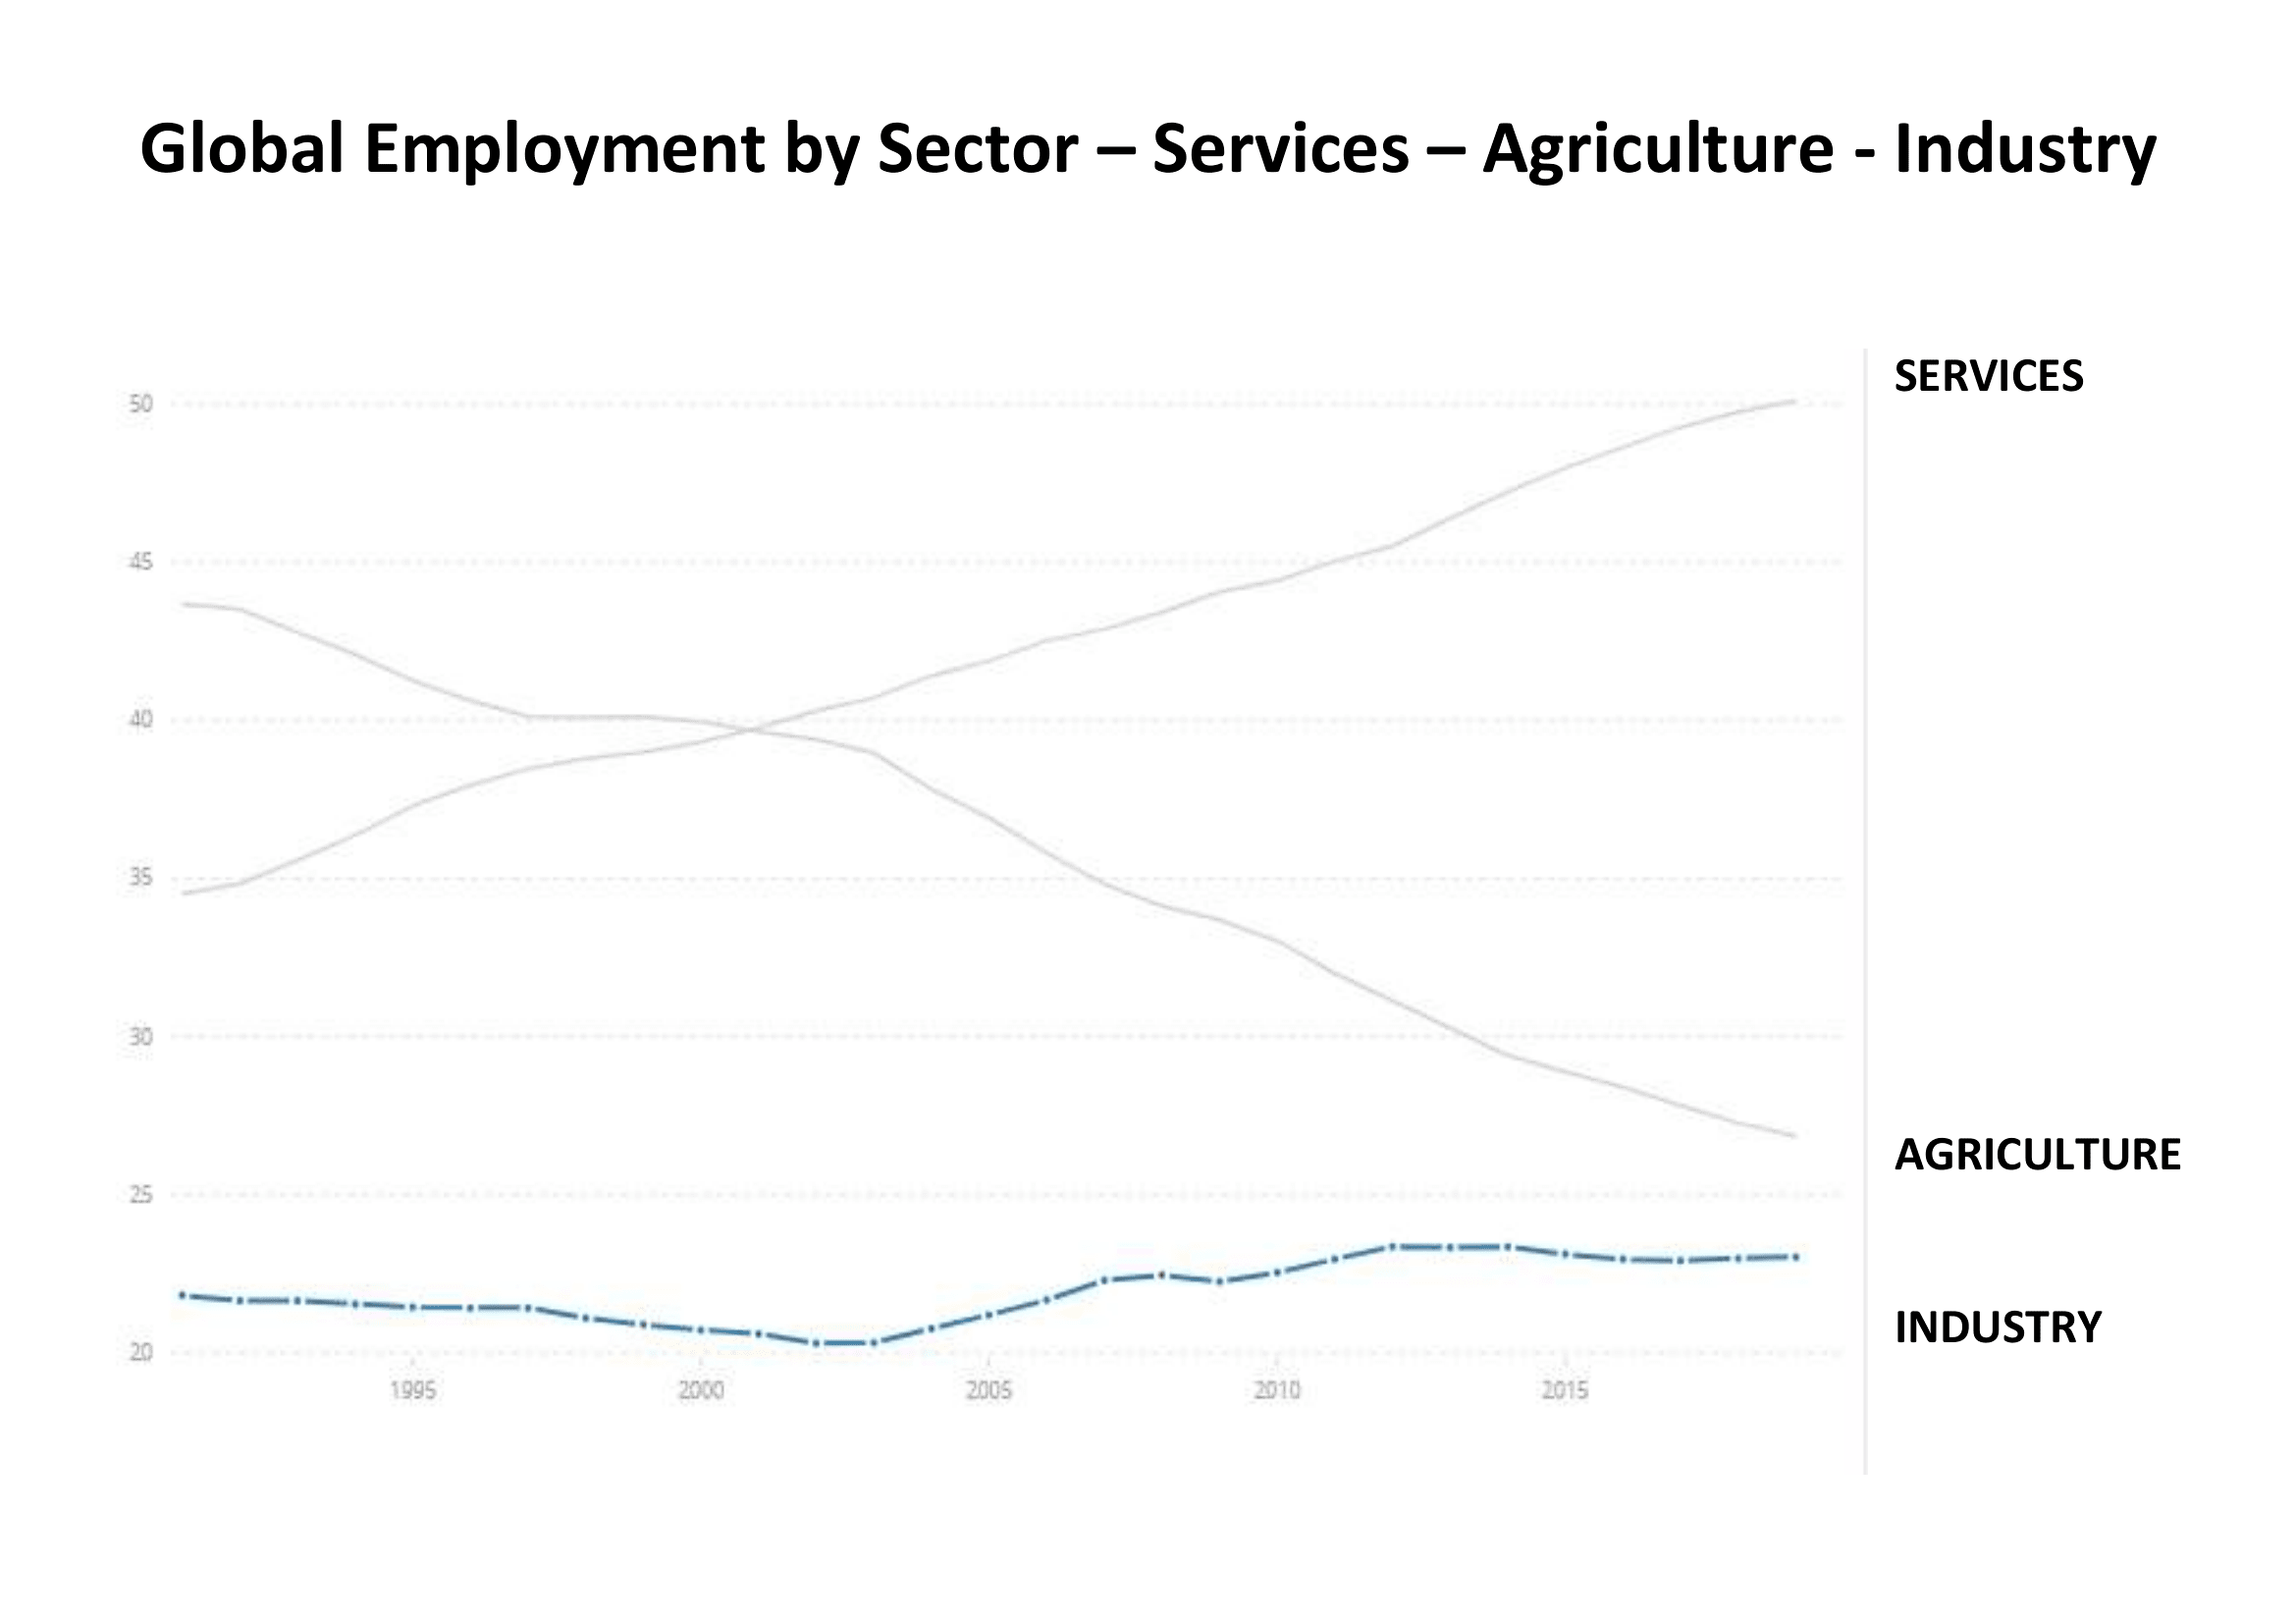
By next month we will have experienced two quarters of diminished growth – this is a deep recession already. Swathes of the economy have been permanently altered, making a depression highly likely. Millions of workers have been displaced, it will take more than a handful of months for them to be retrained. Without the consumption demand from these erstwhile workers, it will be difficult for new and existing companies to create the growth they need to hire new employees.
Fiscal spending will need to be undertaken on a much larger scale, and for much longer, than has been envisaged so far. In all the major financial crises since 1850, the average time for per capita GDP to recover to the pre-crisis level was eight years. To date it is estimated that the G20 response to the pandemic has amounted to $11trln. Most of these measures have been ‘temporary’ or ‘short-term.’ It is quickly becoming clear, the disruption to employment, business and sectors of the economy will be protracted and, in many cases, permanent, The IMF estimate that for advanced economies the deficit-to-GDP ratio will rise from 3.3% in 2019 to 16.6% this year. For emerging economies, where the capacity for fiscal expansion is more limited, the ratio is expected to swell from 4.9% last year to 10.6% in 2020. Whilst for advanced economies the cost of borrowing has remained low in emerging markets financing costs have risen. The burden of fiscal stimulus will inevitably fall most heavily upon the treasuries of the advanced economies.
Conclusion
As Sir Winston Churchill once said: –
Now this is not the end. It is not even the beginning of the end. But it is, perhaps, the end of the beginning.
In the aging societies of the West (and elsewhere) the individual need for income remains key. Developed nation governments are fortunate in their ability to borrow more cheaply than at any time in economic history. Whilst it is at odds with my Austrian, free-market instincts, I am forced to admit that fiscal policy is the least panful weapon available to combat the economic catharsis created by the pandemic. Economically, there will be a heavy price to pay, but the alternative is a dangerous cocktail of political fragmentation and polarisation.
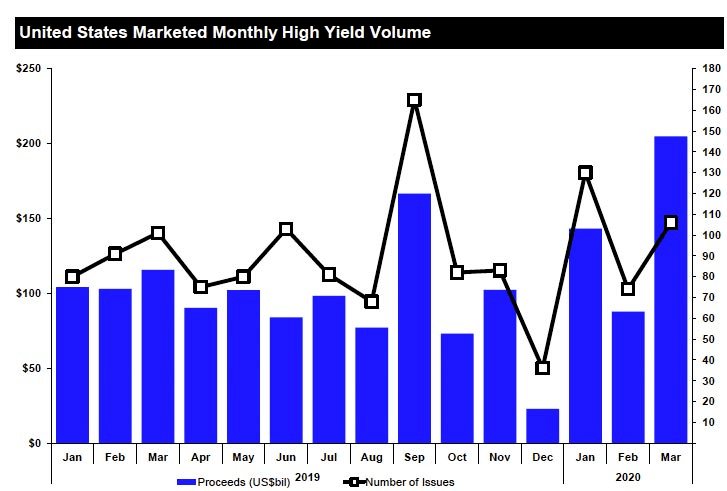
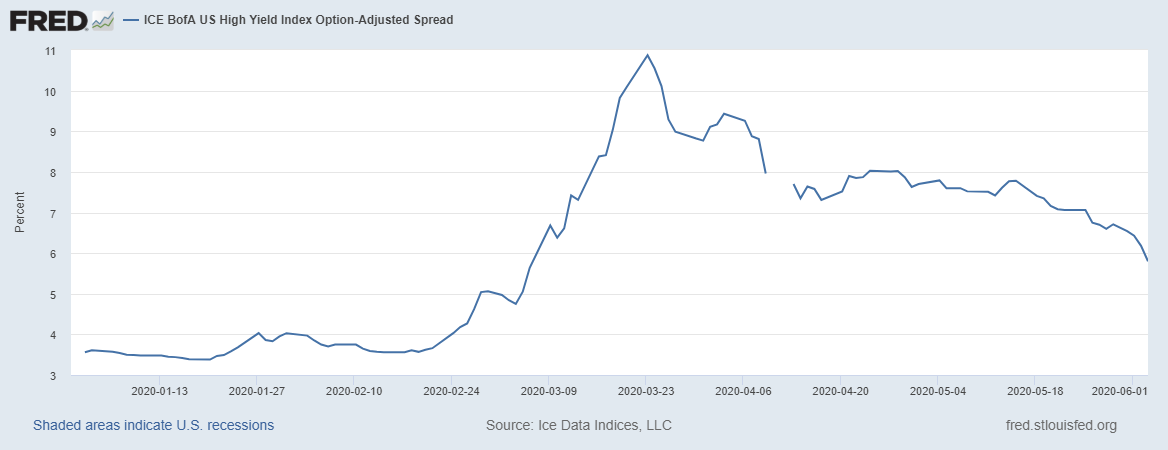
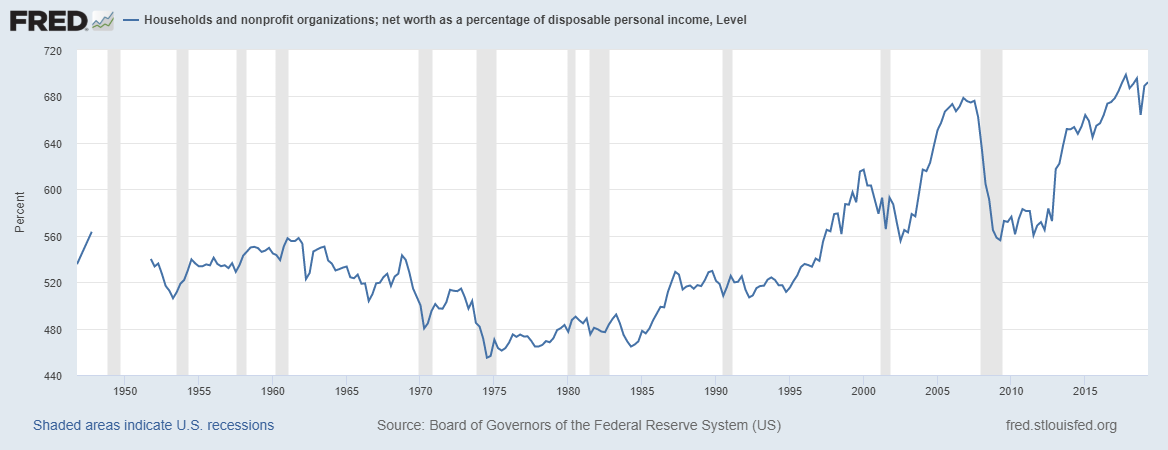
For investors the task of securing steady real income remains challenging. Private debt and asset backed lending, which offers high yield, comes with both default and liquidity risk. The chart below looks at some of the public market options, financial repression is rife across the credit spectrum: –
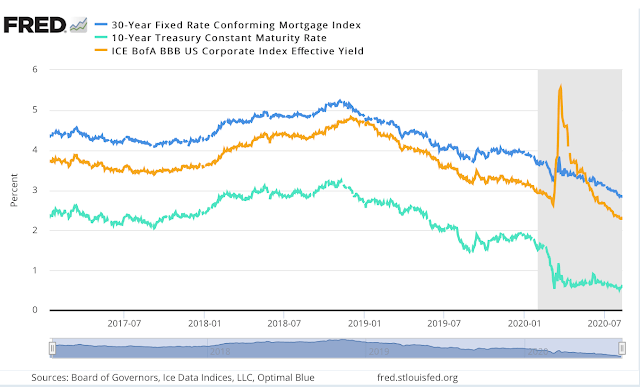
Source: Federal Reserve Bank of St Louis
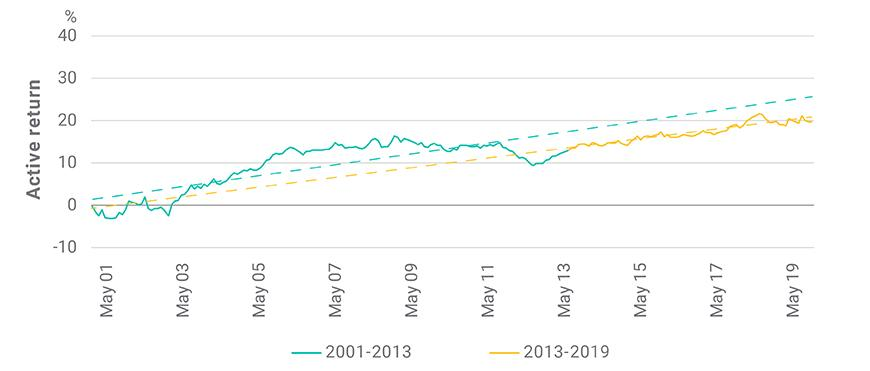
High income stocks might be an alternative but they offer no guarantee, no matter how ‘blue-chip’ the name. An addition to the acceleration in technology trends, growth stocks in general are benefitting from the exceptionally low interest environment, but there will be a greater number of failures because the cost of speculative finance is also at an historical low. Active management has been unfashionable for at least a decade but looking ahead preservation of capital is going to be more important than capturing out-sized gains.
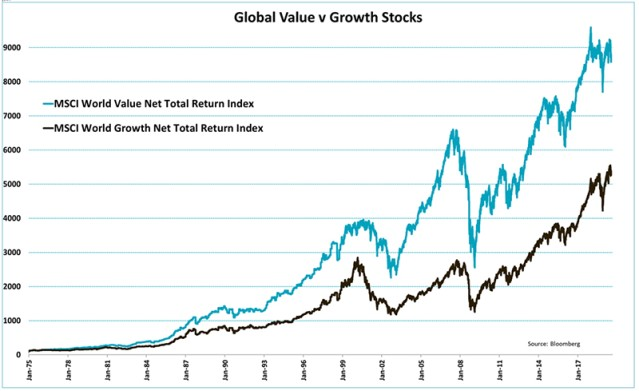
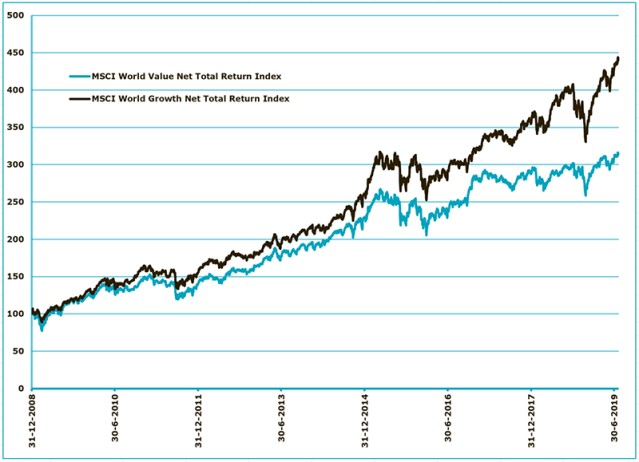
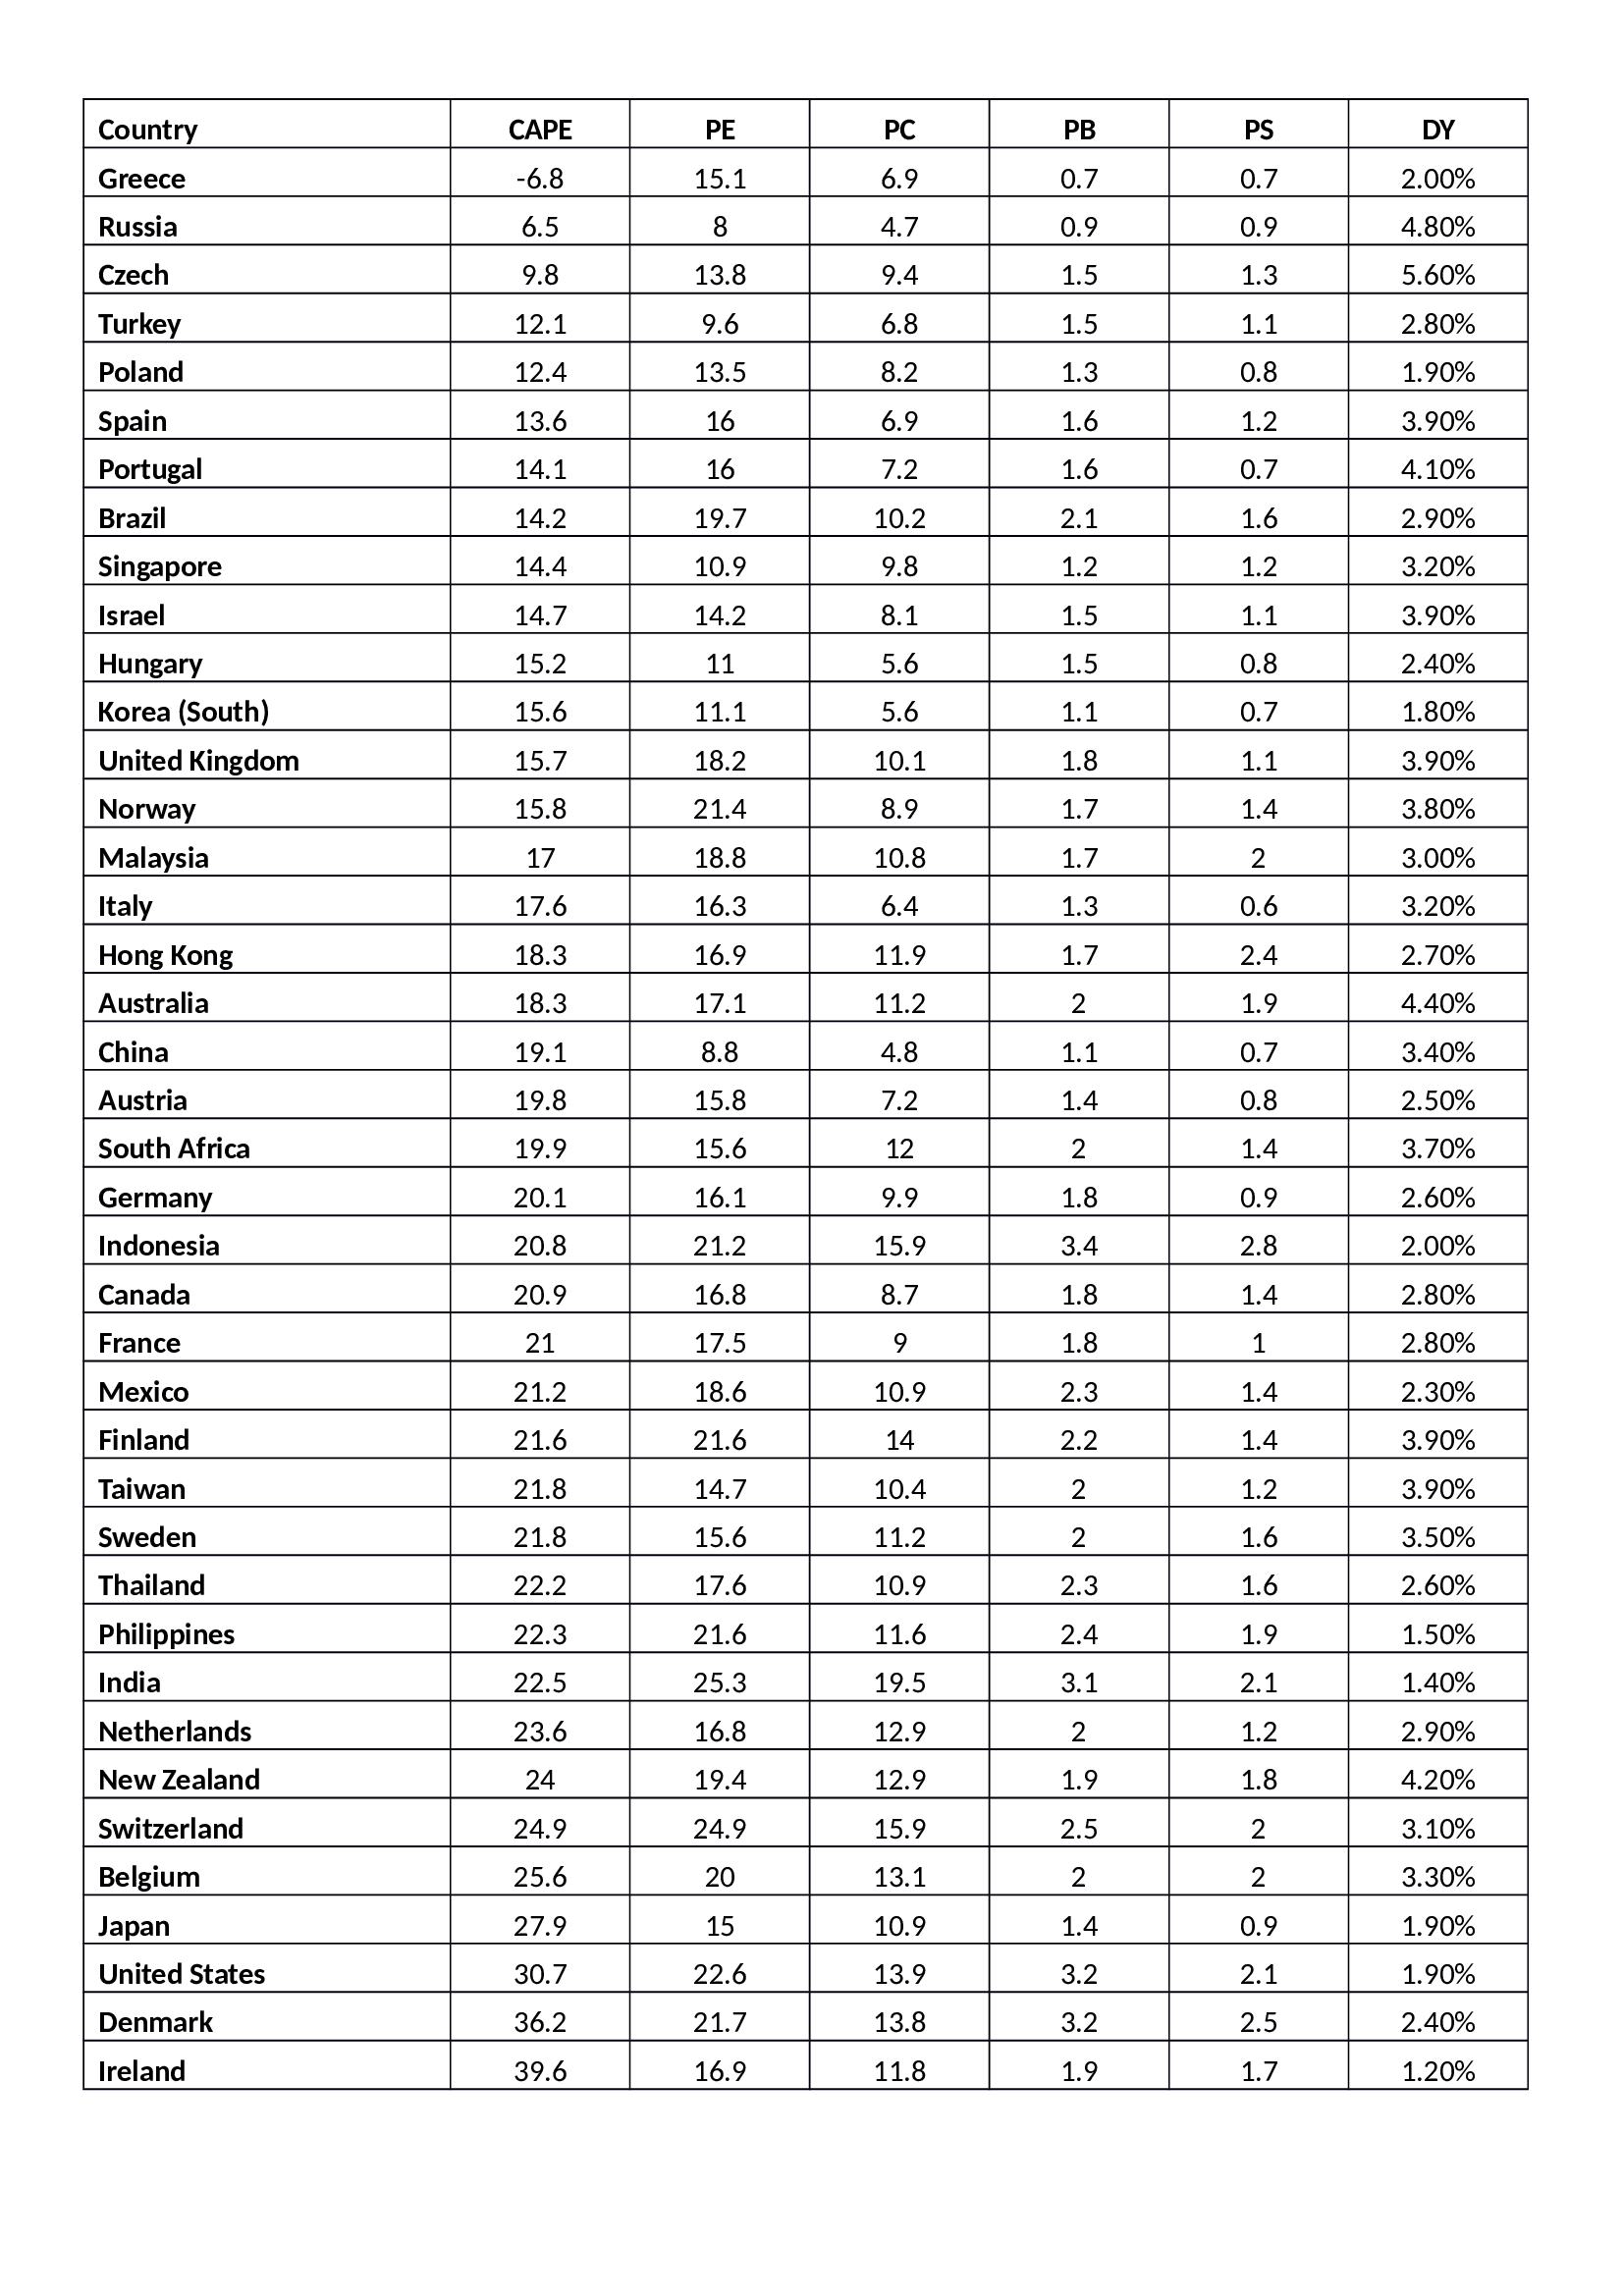
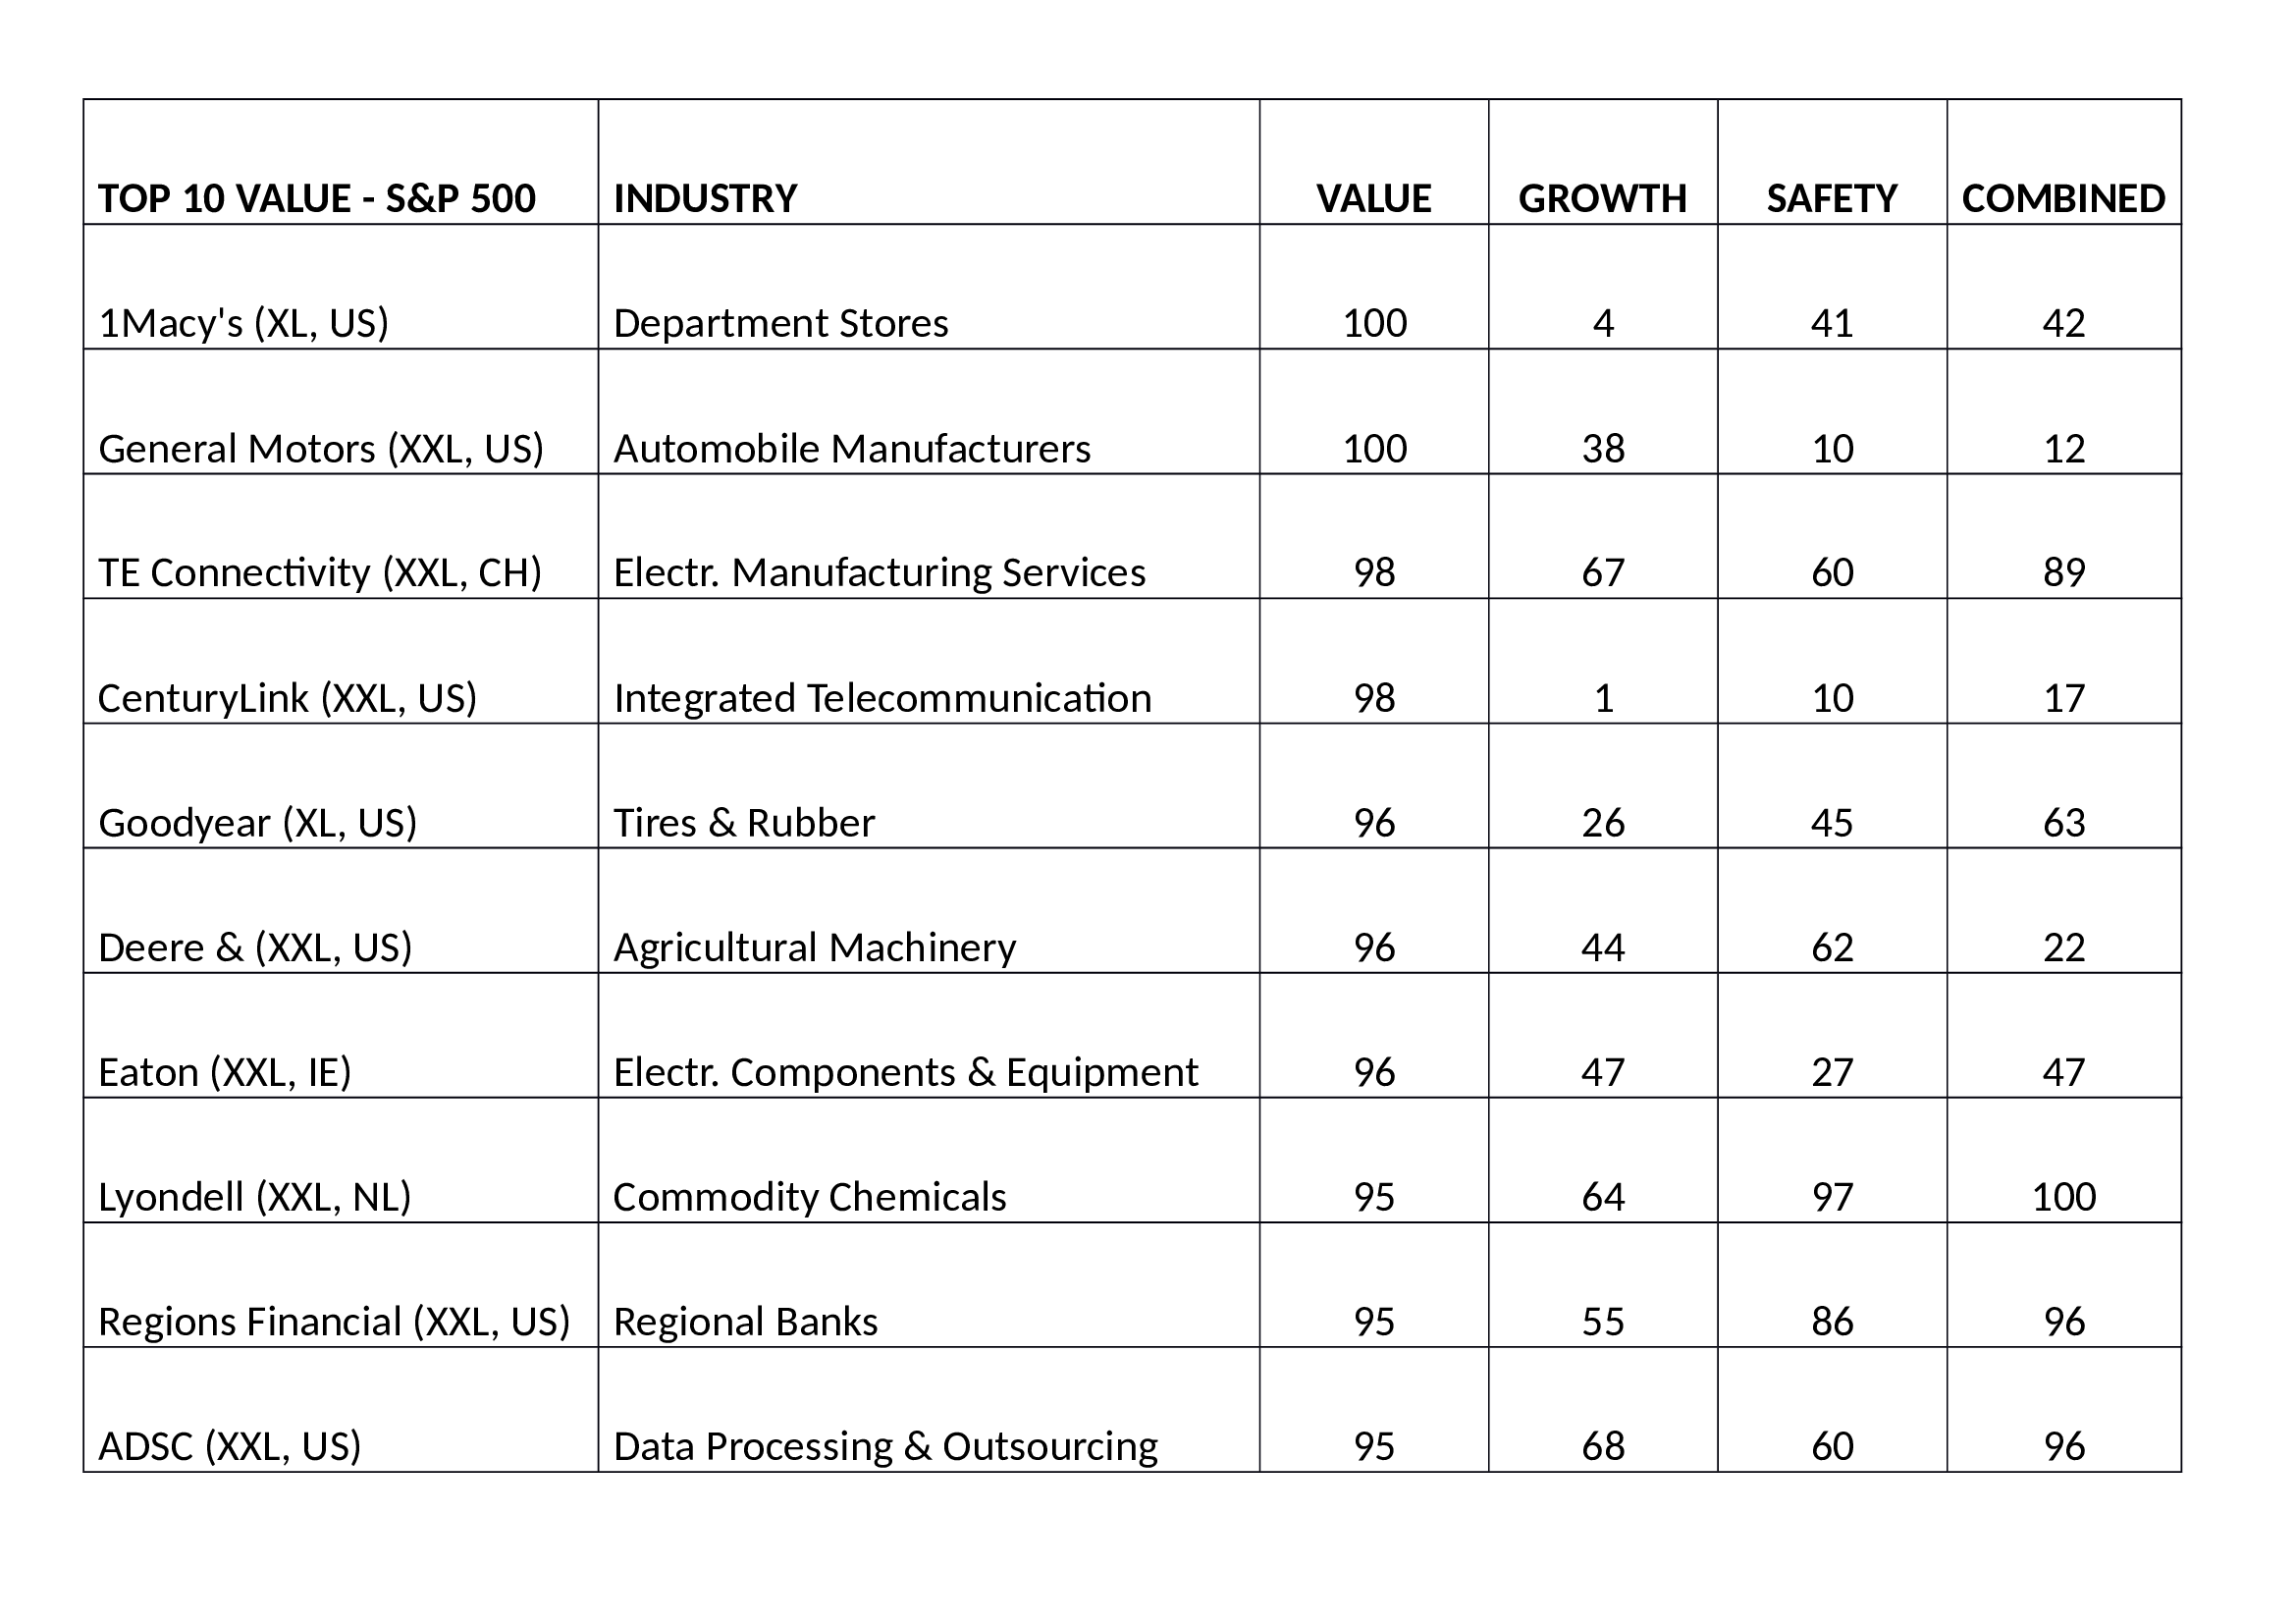
I wrote about value investing back in June in – A Brave New World for Value Investing – concluding that: –
Stock and corporate bond markets have regained much of their composure since late March. Central banks and governments have acted to ameliorate the effects of the global economic slowdown. As the dust begins to settle, the financial markets will adjust to a new environment, one in which value-based stock and bond market analysis will provide an essential aid to navigation.
The geopolitics of trade policy, already a source of tension before the pandemic struck, has been turbo-charged by the simultaneous supply and demand shocks and their impact on global supply chains. Supply chains will shorten and diversify. Robustness rather than efficiency will be the watch-word in the months and years ahead. This sea-change in the functioning of the world economy will not be without cost. It will appear in increased prices or reduced corporate profits. Value-based investment analysis will be the best guide in this brave new world.
I would add an additional strategy to the investment armoury, a momentum overlay. With fiscal and monetary policy continuing to support economies as they transition to the new world order, capital flows will be a powerful arbiter of investment return. Technology stocks may look expensive by most normal metrics but the trend is patently clear. Do not emulate Cnut The Great, but do as Brutus advises in the opening quote, after all, financial market liquidity flows like tide.