The gritty potential of Fire Ice – Saviour or Scourge?

The gritty potential of Fire Ice – Saviour or Scourge?

400dpiLogo

Macro Letter – No 80 – 30-06-2017

The gritty potential of Fire Ice – Saviour or Scourge?

  • Estimates of Methane Hydrate reserves vary from 10,000 to 100,000 TCF
  • 100,000 TCF of Methane Hydrate could meet global gas demand for 800 years
  • Cost of extraction is currently above $20/mln BTUs but may soon fall rapidly
  • Japan METI estimate production costs falling to $7/mln BTUs over the next 20 years

On June 6th Japan’s Ministry of Economy, Trade and Industry (METI) announced the Resumption of the Gas Production Test under the Second Offshore Methane Hydrate Production Test this is what they said:-

Concerning the second offshore methane hydrate production test, since May 4, 2017, ANRE has been advancing a gas production test in the offshore sea area along Atsumi Peninsula to Shima Peninsula (Daini Atsumi Knoll) using the Deep Sea Drilling Vessel “Chikyu.” However, on May 15, 2017, it decided to suspend the test due to a significant amount of sand entering a gas production well.

In response, ANRE advanced an operation for switching the gas production wells from the first one to the second one for which a different preventive measure against sand entry is in place. Following this effort, on May 31, 2017, it began a depressurization operation and, on June 5, 2017, confirmed the production of gas.

Sand flowing into the well samples has been a gritty problem for the Agency for Natural Resources and Energy – ANRE since 2013. They continue to invest because Japan relies on imports for the majority of its energy needs, especially since the reduction in nuclear capacity after the Tōhoku earthquake and tsunami in 2011. It has been in the vanguard of research into the commercial extraction of Methane Hydrate or ‘Fire Ice’ as it is more prosaically known.

Methane hydrates are solid ice-like crystals formed from a mixture of methane and water at specific pressure in the deep ocean or at low temperature closer to the surface in permafrost. For a primer on Methane Hydrate and its potential, this November 2012 article from the EIA – Potential of gas hydrates is great, but practical development is far off – may be instructive but a picture is worth a thousand words:-

Methane Hydrate diagram - EIA

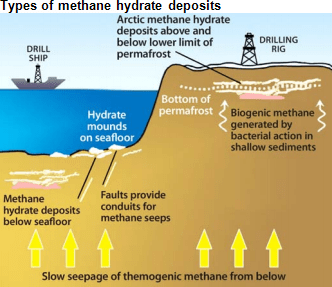
Source: US Department of Energy

During the last two months there have been some important developments. Firstly the successful extraction of gas by the Japanese, albeit, they have run into the problem of sand getting into the pipes again, which poses an environmental risk. Secondly China has successfully extracted gas from Methane Hydrate deposits in the South China Sea. This article from the BBC – China claims breakthrough in mining ‘flammable ice’ provides more detail. The Chinese began investment in Fire Ice back in 2006, committing $100mln, not far behind the investment commitments of Japan.

Japan and China are not alone in possessing Methane Hydrate deposits. The map below, which was produced by the US Geological Survey, shows the global distribution of deposits:-

Methane_Hydrate_deposits_-_USGS_-_2011

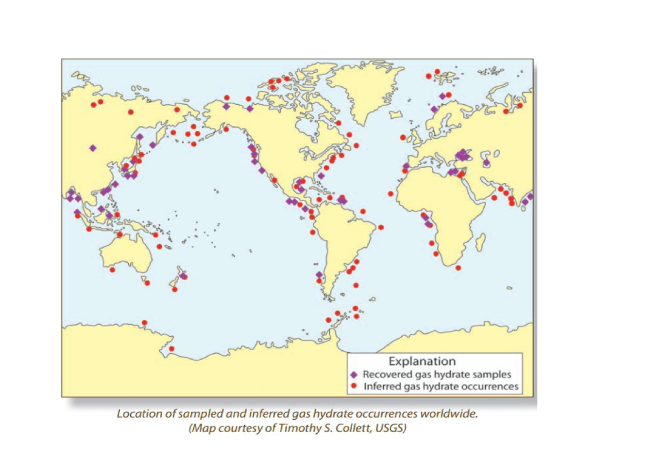
Source: US Geological Survey

For countries such as Japan, South Korea and India, Methane Hydrate could transform their circumstances, especially in terms of energy security.

Estimates of global reserves of Methane Hydrate range from 10,000 to 100,000trln cubic feet (TCF). In 2015 the global demand for natural gas was 124bln cubic feet. Even at the lower estimate that is 80 years of global supply at current rates of consumption. This could be a game changer for the energy industry.

The challenge is to extract Methane Hydrate efficiently and competitively. Oceanic deposits are normally found at depths of around 1500 metres. Even estimating the size of deposits is difficult in these locations. Alaskan and Siberian permafrost reserves are more easily assessed.

Japan has spent $179mln on research and development but last week METI announced that they would now work in partnership with the US and India. The Nikkei – Japan joining with US, India to tap undersea ‘fire ice’ described it in these terms, the emphasis is mine:-

Under the new plan, Japan will end its lone efforts and pursue cooperation with others. The country has been spending tens of millions of yen per day on its tests. By working with other nations, it seeks to reduce the cost.

A joint trial with the U.S. to produce methane hydrate on land in the state of Alaska is expected to begin as early as next year. Test production with India off that country’s east coast may also kick off in 2018.

The new blueprint will define methane hydrate as an alternative to liquefied natural gas. Based on the assumption that Japan will be paying $11 to $12 per 1 million British thermal units of LNG in the 2030s to 2050s, the plan will set the target production cost for methane hydrate over the period at $6 to $7.

In the shorter term METI hope to increase daily production from around 20,000 cubic metres/day to around 56,000 cubic metres/day which they believe will bring the cost of extraction down to $16/mln BTUs. That is still three times the price of liquid natural gas (LNG).

Here is the latest FERC estimate of landed LNG prices/mln BTUs:-

LNG_prices_-_May_17_FERC

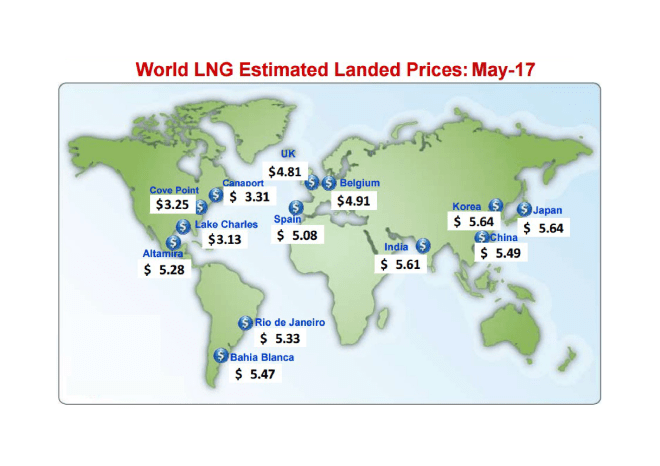
Source: Waterborne Energy, Inc, FERC

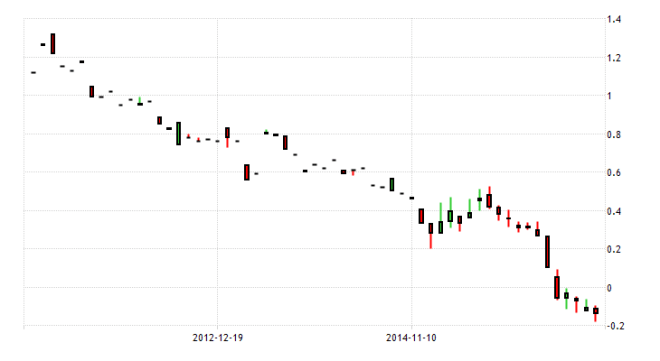
You might be forgiven for wondering why the Japanese, despite being the world’s largest importer of LNG, are bothering with Methane Hydrate, but this chart from BP shows the evolution of Natural Gas prices over the last two decades:-
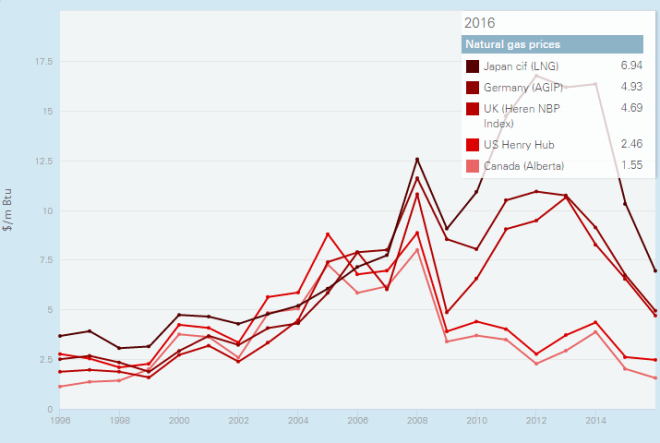
bp-statsreview

Source: BP

Japan was squeezed by rising fuel costs between 2009 and 2012 only to be confronted by the Yen weakening from USDJPY 80 to USDJPY 120 from 2012 to 2014. If Abenomics succeeds and the Yen embarks upon a structural decline, domestically extracted Methane Hydrate may be a saviour.

Cooperating internationally also makes sense for Japan. The US launched a national research and development programme in 1982. They have deep water pilot projects off the coast of South Carolina and in the Gulf of Mexico as well as in the permafrost of the Alaska North Slope.

Technical challenges

As deep sea drilling technology advances the cost of extraction should start to decline but as this 2014 BBC article – Methane hydrate: Dirty fuel or energy saviour? explains, there are a number of risks:-

Quite apart from reaching them at the bottom of deep ocean shelves, not to mention operating at low temperatures and extremely high pressure, there is the potentially serious issue of destabilising the seabed, which can lead to submarine landslides.

A greater potential threat is methane escape. Extracting the gas from a localised area of hydrates does not present too many difficulties, but preventing the breakdown of hydrates and subsequent release of methane in surrounding structures is more difficult.

And escaping methane has serious consequences for global warming – recent studies suggest the gas is 30 times more damaging than CO2.

Given the long term scale of the potential reward, it may seem surprising that the Japanese have only invested $179mln to date, however these projects have been entirely government funded.  Commercial operators are waiting for clarification of the cost of extraction and size of viable reserves before entering the fray. Most analysts suggest commercial production is unlikely before 2025. With the price of Natural Gas depressed, development may be delayed further but in the longer term Methane Hydrate will become a major global source of energy. Like the fracking revolution of the past decade, it is only a matter of when.

The history of fracking can be traced back to 1862 and the first patent was filed in 1865. In the case of Fire Ice, I do not believe we will have to wait that long. Deep sea mining and drilling technologies are advancing quickly in several different arenas. The currently depressed price of LNG is only one factor holding back the development process.

Conclusions and investment opportunities

Predicting the timing of technological breakthroughs is futile, however, the US energy sector is currently witnessing a resurgence in profitability. In their June 16th bulletin, FactSet Research estimated that Q2 profits for the S&P500 will rise 6.5%. They go on to highlight the sector which has led the field, Energy, the emphasis is mine:-

At the sector level, nine sectors are projected to report year-over-year growth in earnings for the quarter. However, the Energy sector is projected to report the highest earnings growth of all eleven sectors at 401%.

This sector is also expected to be the largest contributor to earnings growth for the S&P 500 for Q2 2017. If the Energy sector is excluded, the estimated earnings growth rate for the index for Q2 2017 would fall to 3.6% from 6.5%.

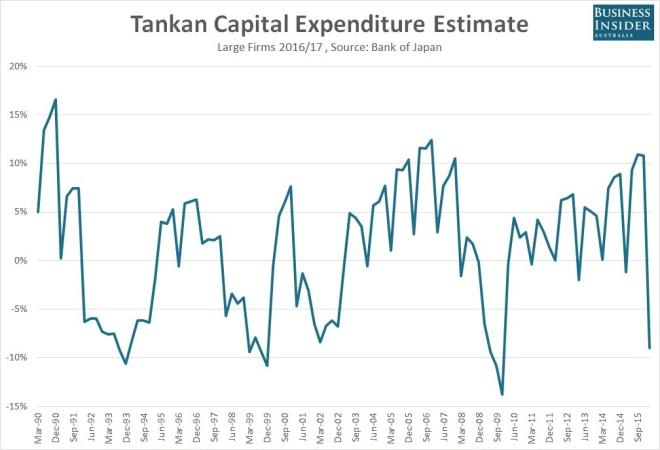
The price of Brent Crude Oil has been falling but the previous investment in technology combined with some aggressive cost cutting in the recent past has been the driving force behind this spectacular increase in Energy Sector profitability. Between 2014 and 2016 Energy Sector capital expenditure fell nearly 40%. I expect a rebound in capex over the next couple of years. It may be too soon for this to spill over to commercial investment in Methane Hydrate, but developments in Japan and China during the past two months suggest a breakthrough may be imminent. The next phase of investment may be about to begin.

Will Japan be the first to test the limits of quantitative easing?

400dpiLogo

Macro Letter – No 57 – 24-06-2016

Will Japan be the first to test the limits of quantitative easing?

  • The Bank of Japan made its first provision against losses from QQE
  • As the JPY has strengthened the Nikkei 225 has fallen more than 16% YTD
  • Domestic institutions have been switching from bonds to stocks
  • Japanese share buy backs are on the rise

The Japanese stock market peaked in December 1989, marking the end of a period of economic expansion which briefly saw Japan eclipse the USA to become the world’s largest economy. Since its zenith, Japan has struggled. I wrote about this topic, in relation to the economic reform package dubbed Abenomics, in my first Macro Letter – Japan: the coming rise back in December 2013:-

As the US withdrew from Japan the political landscape became dominated by the LDP who were elected in 1955 and remained in power until 1993; they remain the incumbent and most powerful party in the Diet to this day. Under the LDP a virtuous triangle emerged between the Kieretsu (big business) the bureaucracy and the LDP. Brian Reading (Lombard Street Research) wrote an excellent, and impeccably timed, book entitled Japan: The Coming Collapse in 1989. By this time the virtuous triangle had become, what he coined the “Iron Triangle”.

Nearly twenty five years after the publication of Brian’s book, the” Iron Triangle” is weaker but alas unbroken. However, the election of Shinzo Abe, with his plan for competitive devaluation, fiscal stimulus and structural reform has given the electorate hope. 

In the last two years Abenomics has delivered some transitory benefits but, as this Japan Forum on International Relations – No. 101: Has Abenomics Lost Its Initial Objective? describes, it may have lost its way:-

The key objective of Abenomics is a departure from 20 year deflation. For this purpose, the Bank of Japan supplied a huge amount of base money to cause inflation, and carried out quantitative and qualitative monetary easing so that consumers and businesses have inflationary mindsets. This “first arrow” of Abenomics was successful to boost corporate profits and raising stock prices by devaluing the exchange rate, but falling oil price makes it unlikely to achieve a 2% inflation rate, despite BOJ Governor Haruhiko Kuroda’s dedicated effort. The quantitative and qualitative monetary easing will not accomplish the core objective.

Another reason for such a huge amount of base money supply is to expand export through currency depreciation and to stimulate economic growth, but that has neither boosted export nor contributed to economic growth. We cannot dismiss world economic downturn, notably in China, but actually, Japanese big companies that lead national export, have shifted their business bases overseas during the last era of strong yen. From this point of view, I suspect that the Japanese government overlooked such structural changes that deterred export growth, even if the yen was devalued. The “second arrow” is flexible fiscal expenditure to support the economy, and the result of which has revealed that it is virtually impossible to keep the promise to the global community to achieve the equilibrium of the primary balance in 2020.

In view of the above changes, I would like to lay my hopes on the “third arrow” of economic growth strategy. The growth strategy has been announced three times up to now, in 2013, 2014, and 2015, respectively. The strategy in 2013 launched three action plans, but they were insufficient. The 2014 strategy was highly evaluated internationally, as it actively involved in the reform of basic nature of the Japanese economy, such as capital market reform, agricultural reform, and labor reform. But it takes ten to twenty years for a structural reform like this to work. Meanwhile, it is quite difficult to understand the growth strategy approved by the cabinet in June 2015. Frankly, this is empty and the quality of it has become even poorer. Abenomics was heavily dependent on monetary policy, and did not tackle long term issues so much, such as social security and regional development. However, people increasingly worry about dire prospects of long term problems like 2 population decrease, aging, and so forth, while the administration responds to such trends with mere slogans like “regional revitalization” and “dynamic engagement of all citizens”. But it is quite unlikely that these “policies” will really revitalize the region, or promote dynamic engagement by the people.

The Bank of Japan (BoJ) has held up its side of the bargain but the “Third Arrow” of structural reform seems to be stuck in the quiver. It is prudent, in light of this policy failure, for the BoJ to look ahead to the time when they are required by the government or forced by the markets, to unwind QQE. Last month they began that process.

As this article from the Nikkei Asian Review – BOJ seen preparing for exit from easing with reserves  explains, the BoJ has made a provision of JPY 450bln for the year ending March 2016 against potential capital losses which might be incurred upon liquidation of their JGB holdings. This is the first provision of its kind and substantially reduces the percentage of seigniorage profits remitted to the Japanese government.  The level of remittances has been falling –from JPY 757bln in 2014 to JPY 425bln last year. As at the end of May 2016 the BoJ held JPY 319.5trln of JGBs – 36.6% of outstanding issuance. Japan Macro Advisors estimate this will reach 49.3% by the end of 2017. This year’s provision, whilst prudent, is a drop in the ocean. Under the current Quantitative and Qualitative Easing (QQE) programme they are obligated to purchase JPY 80tln per annum. The Association of Japanese Institutes of Strategic Studies – The Fiscal Costs of Unconventional Monetary Policy put it like this:-

It is quite likely that quantitative easing through high-volume purchases of long-term bonds will cause the Bank of Japan enormous losses over the medium to long term, imposing burdens on taxpayers both directly and indirectly. If the current quantitative easing continues, the Bank of Japan may find itself in the near future unable to cover such losses even using all of its seigniorage profits.

…The BoJ’s seigniorage will be roughly equivalent in present value to the balance of banknotes issued. If the BoJ procures funds by issuing cash at a zero interest rate and purchases JGBs, the present discounted value of the principal and interest earned by the BoJ from its JGBs will equal the balance of banknotes. If interest rates are about 2%, Japan’s demand for banknotes will fall from 19% of GDP at present to less than 10% of GDP, and the BoJ’s aforementioned losses would even exceed the present value of its seigniorage.

Here is an extract from the BoJ’s 16th June Statement on Monetary Policy the emphasis is mine:-

Quantity Dimension: The guideline for money market operations

The Bank decided, by an 8-1 majority vote, to set the following guideline for money market operations for the intermeeting period:[Note 1]

The Bank of Japan will conduct money market operations so that the monetary base will increase at an annual pace of about 80 trillion yen.

Quality Dimension: The guidelines for asset purchases

With regard to the asset purchases, the Bank decided, by an 8-1 majority vote, to set the following guidelines:[Note 1]

a) The Bank will purchase Japanese government bonds (JGBs) so that their amount outstanding will increase at an annual pace of about 80 trillion yen. With a view to encouraging a decline in interest rates across the entire yield curve, the Bank will conduct purchases in a flexible manner in accordance with financial market conditions. The average remaining maturity of the Bank’s JGB purchases will be about 7-12 years.

b) The Bank will purchase exchange-traded funds (ETFs) and Japan real estate investment trusts (J-REITs) so that their amounts outstanding will increase at annual paces of about 3.3 trillion yen1 and about 90 billion yen, respectively.

c) As for CP and corporate bonds, the Bank will maintain their amounts outstanding at about 2.2 trillion yen and about 3.2 trillion yen, respectively.

Interest-Rate Dimension: The policy rate

The Bank decided, by a 7-2 majority vote, to continue applying a negative interest rate of minus 0.1 percent to the Policy-Rate Balances in current accounts held by financial institutions at the Bank.[Note 2]

[Note 1] Voting for the action: Mr. H. Kuroda, Mr. K. Iwata, Mr. H. Nakaso, Mr. K. Ishida, Mr. T. Sato, Mr. Y. Harada, Mr. Y. Funo, and Mr. M. Sakurai. Voting against the action: Mr. T. Kiuchi. Mr. T. Kiuchi proposed that the Bank conduct money market operations and asset purchases so that the monetary base and the amount outstanding of its JGB holdings increase at an annual pace of about 45 trillion yen, respectively. The proposal was defeated by a majority vote.

[Note 2] Voting for the action: Mr. H. Kuroda, Mr. K. Iwata, Mr. H. Nakaso, Mr. K. Ishida, Mr. Y. Harada, Mr. Y. Funo, and Mr. M. Sakurai. Voting against the action: Mr. T. Sato and Mr. T. Kiuchi. Mr. T. Sato and Mr. T. Kiuchi dissented considering that an interest rate of 0.1 percent should be applied to current account balances excluding the amount outstanding of the required reserves held by financial institutions at the Bank, because negative interest rates would impair the functioning of financial markets and financial intermediation as well as the stability of the JGB market.

The decision by the BoJ not to increase QQE at its last two meetings has surprised the markets and lead to a further strengthening of the JPY. Governor Kuroda, gave a speech Keio University on June 20thOvercoming Deflation: Theory and Practice in which he described the history of BoJ policy in its attempts to stimulate the Japanese economy:-

As mentioned, the aim of QQE is to overcome the prolonged deflation that has gripped Japan. Even if this deflation has been mild, the fact that it has continued for more than 15 years means that its cumulative costs have been extremely large. Looked at in terms of the price level, an annual inflation rate of minus 0.3 percent over a period of 15 years implies that the price level will fall by around 5 percent, but an annual inflation rate of 2 percent over a period of 15 years means that the price level will rise by around 35 percent.

It is worth noting that the UK and USA was subject to a long period of deflation during the “Great Depression” between 1873 and 1896 (approximately -2% per annum) by this comparison Japan’s experience has been very mild indeed. The BoJ has a 2% inflation target, however, so we should anticipate more QQE. Kuroda-san, who has previously stated that the effect of NIRP will take time to feed through and that NIRP may be increased from -0.1% to -0.5%, gave no indication as to what the BoJ may do next; although he did say that Japan provides an interesting case study for academia.

On June 8th Professor George Selgin delivered the Annual IEA Hayek Memorial Lecture – Price Stability and Financial Stability without Central Banks – lessons from the past for the future in which he discussed good and bad deflation together with “Free Banking” – the concept of financial stability without central banks (if you have 45 minutes and enjoy economic history, the whole speech it is well worthwhile). With regard to the current situation in Japan – and elsewhere – he highlights the different between good deflation which is driven by supply expansion and bad deflation which is the result of demand shrinkage. Selgin also goes on to allude to Hayek’s view that that stability of spending should be the objective of monetary policy rather than the stability of prices – akin to what Market Monetarists dub the stability of monetary velocity.

Japan’s monetary base has expanded by 170% since March 2013 but at the same time the money multiplier – Money Stock/BoJ Monetary Base – has declined from 8.27 times (April 2013) to 3.35 times (March 2016). Lending market growth was at its weakest for three years in March (+2%) principally due to household hoarding.

Bloomberg - Japan Money Mult and Money base

Source: Bloomberg, BoJ

Since the announcement of Negative Interest Rate Policy (NIRP) in January the sale of safes for domestic residences has increased dramatically. Whilst I have not found evidence from Japan, this article from Bloomberg – Cash in Vaults Tested by Munich Re Amid ECB’s Negative Rates reports that MunichRE – the world’s second largest reinsurer – is setting a worrying precedent, it’s one thing when individuals hoard paper money but, when financial institutions follow suit, monetary velocity is liable to plummet. I suspect institutions in Switzerland and Japan are also assessing the merits of stuffing their proverbial mattresses with fiat money.

The chart below reveals that declining monetary velocity is not exclusively a Japanese phenomenon:-

Monetary Velocity - CLSA

Source: CLSA, CEIC

The Yotai Gap – the difference between bank deposits and loans – is another measure of household hoarding. It widened to JPY 207.6trln in March, close to its record high of JPY 209.9trln in May 2015. The unintended consequences of NIRP is an increase in demand for paper money and a reduction of demand for retail loans even as interest rates decline.

Japanese industry looks little better than the household sector, as this excellent article from Alhambra Investment Partners – It’s Not Stupidity, It Is Apathy (For Now) explains:-

Japanese industry has not gained anything for the surrender of Japanese households, with industrial production falling 3.5% in April, the 18th time in the past the 22 months. IP in April 2016 was slightly less than the production level in April 2013 when QQE began. Worse, IP is still 3.4% below April 2012, which further suggests both continued economic decline and a distinct lack of any effect from all the “stimulus.”

Barron’s – Unintended Consequences of NIRP listed the following additional effects:-

1) compress net interest margins and bank profits;
2) damage consumer and business confidence;
3) provide little incentive for business invest in capital rather than buy back stock;
4) hurt savers;
5) makes active management more difficult by dampening dispersion;
6) increase demand for gold and other hard assets; and,
7) likely widen the wealth gap

The BoJ can continue to buy JGBs, Commercial Paper, Corporate Bonds, ETFs and, once these avenues have been exhausted, move on to the purchase of common stocks and commercial loans. It can nationalise the stock market and circumvent the banking system in order to provide liquidity to end users or even consumers. At what point will the markets realise that they have been pushing on a string for decades? I suspect, not yet, but a dénouement, an epiphany, draws near.

Markets since the announcement of NIRP

Since the BoJ NIRP announcement at the end of January, the JPY has strengthened by around 14%. The five year chart below shows the degree to which the hopes for the first arrow of Abenomics have been dashed:-

japan-currency 5yr

Source: Trading Economics

Currency weakness has put pressure on stocks. International investors sold around JPY 5trln during in a 13 week selling binge to the beginning of April:-

japan-stock-market 5yr

Source: Trading Economics

The Government Pension Investment Fund (GPIF) and other domestic institutions took up the slack – the GPIF has moved from 12% to 23% equities since October 2014 – here is the 31st December breakdown of the asset mix for the JPY 140trln fund:-

31-12-15 % Allocation Policy Target Permitted Deviation
Domestic Bonds 37.76 35 10
Domestic Equity 23.35 25 9
International Bonds 13.5 15 4
International Equities 22.82 25 8
Short term assets 2.57

Source: GPIF

In theory the GPIF could buy another JPY 15.5trln of domestic stocks and reduce its holdings of JGBs by nearly JPY 18trln. I expect other Japanese pension funds and Trust Banks to follow the lead of the GPIF. Domestic demand for stocks is likely to continue.

As I mentioned earlier, JGBs are being steadily accumulated by the BoJ even as the GPIF and other institutions switch to equities. This is the five year yield chart for the 10 year maturity:-

japan-government-bond-yield 5yr

Source: Trading Economics

JGBs made new all-time lows earlier this month, with maturities out as far as 15 years turning negative, amid international concerns about the potential impact of Brexit.

Looking more closely at Japanese stocks, non-financial corporations have followed the lead of the eponymous Mrs Watanabe, accumulating an historically high cash pile. Barron’s – Abenomics Watch: Japan’s Corporates Are Hoarding Cash, Too takes up the story:-

During the three years of Abenomics between 2013 and 2015, Japan’s non-financial corporate sector increased its holding of cash and deposits by roughly 30 trillion yen, or 6% of GDP. This amount is equivalent to about 35% of retained earnings, estimates Credit Suisse.

This amount is high by historical standards. During the previous economic upswing between the end of 2002 and the beginning of 2008, Japan’s corporations held only 11.5% of their retained earnings.

So why are Japanese companies hoarding cash?

One explanation is larger intangible assets. It is easy for companies to put up their fixed assets as collateral for loans, but how should banks value intangible assets such as intellectual property? Cash would be a viable collateral option. However, Credit Suisse finds that there is not much correlation between cash and intangible asset positions. The ratio of cash to intangible fixed assets investments has moved broadly between 8.6 years and 11.6 years over the two decades since 1994.

A second explanation is lax corporate governance, which Abe has been trying to fix. Are Japanese companies only paying him lip service?

A third explanation is increasing pension liabilities. As Japanese society ages, companies feel compelled to hoard more cash to pay off employees who are due to retire in the coming years. Encouraging women to enter the labor force is a key component of Abenomics’ Third Arrow. He has not gone very far.

Last, perhaps Japanese companies are feeling uncertain about the future? Toyota Motor, for instance, drastically changed its yen assumption from 120 to 105 in the new fiscal year. Companies hoard more cash when they don’t know what’s going to happen.

According to the latest flow of funds data from the BoJ – corporate cash was estimated to be JPY 246trln in Q1 2016 – the 29th consecutive quarterly increase, whilst household assets rose to JPY 902trln the highest on record and the 36th quarterly increase in a row. A nine year trend.

Another trend which has been evident in Japan – and elsewhere – is an increase in share buybacks. The chart below tells the story since 2012:-

Topix Share buy backs

Source: FT, Goldman Sachs

Compared to the level of share buy backs seen in the US, Japanese activity is minimal, nonetheless the trend is growing and NIRP must assume some responsibility. Perhaps it was the precipitous decline in capital expenditure, which prompted the BoJ to introduce NIRP. The chart below is taken from the December 2015 Tankan report:-

japan-tankan-capex-index-q1-2016

Source: Business Insider Australia, BoJ

In the March 2016 Tankan, the Business Conditions Diffusion Index remained generally positive but the decline of momentum is of concern:-

Dec-15 Mar-16 June-16(F/C)
Large
Manufacturers 12 6 3
Non-Manufacturers 25 22 17
 
Medium
Manufacturers 5 5 -2
Non-Manufacturers 19 17 9

 Source; BoJ

I doubt capital expenditure will rebound while share buy backs appear safer to the executive officers of these companies. The Japanese stock market is also attractive by several valuation metrics. The table below compares the seven most liquid stock markets, as at 31st March, is sorted by the yield premium to 10 year government bonds (DY-10y):-

Country CAPE PE PC PB PS DY 10y DY-10y
Switzerland 20.3 22.5 13.9 2.3 1.8 3.50% -0.33% 3.83%
France 16 20.9 6.5 1.5 0.8 3.50% 0.41% 3.09%
Germany 16.8 19 8 1.6 0.7 2.90% 0.15% 2.75%
United Kingdom 12.7 35.4 12.8 1.8 1.1 4.00% 1.42% 2.58%
Italy 11.1 31.5 5 1.1 0.5 3.50% 1.23% 2.27%
Japan 22.7 15.3 7.9 1.1 0.7 2.20% -0.04% 2.24%
United States 24.6 19.9 11.6 2.8 1.8 2.10% 1.77% 0.33%

Source: StarCapital.de, Investing.com

For international allocators, the strength of the JPY has been a significant cushion this year, but, for the domestic investor, the Nikkei 225 is down 16.2% YTD. Technically the market is consolidating around the support region between 16,300 and 13,900. If it breaks lower we may see a return towards to 10,000 – 11,000 area. If it recovers, a push through 18,000 should see the market retest its highs. I believe the downside is supported by domestic demand for stocks as bond yields turn increasingly negative.

International investors will remain wary of the risks associated with the currency. Further BoJ largesse must be anticipated; that they have made a first provision against losses from the unwinding of QQE is but a warning shot across the bows of the ministry of finance. As I suggested in Macro Letter – No 49 – 12-02-2016 Why did Japanese NIRP cause such surprise in the currency market and is it more dangerous? a currency hedged equity investment is worth considering. Prime Minister Abe, who began campaigning, this week, for the upper house elections on July 10th, has promised to boost the economy if he wins a majority of the 121 seats being contested. The monetary experiment looks set to continue but the BoJ may be the first central bank to discover the limits of largesse.


Japan: The Coming Rise?

400dpiLogo

.

.

.

Macro Letter – No 1 – 6-12-2013

Welcome to my first blog. Those of you who have followed my commentary previously will be used to the eclectic mix of subjects I tend to write about. In my new blog I aim to expand on that reportage service by adding my own, more market centric, opinions.

Japan – The Coming Rise?

On the 4th December Bank of Japan (BoJ) board member Takehiro Sato gave an interesting speech on the prospects for the Japanese economy: –

http://www.boj.or.jp/en/announcements/press/koen_2013/data/ko131204a1.pdf

Japan’s economy has been recovering moderately. While it will be affected by the two scheduled consumption tax hikes, the economy is likely to continue growing at a pace above its potential, as a trend, on the assumption that the global economy will follow a moderate growth path…

… The growth rate for fiscal 2014 is likely to dip temporarily in the April-June quarter due to a decline in demand subsequent to the front-loaded increase in the previous quarters. However, I do not expect an economic downturn such as what we experienced at the time of the previous consumption tax hike in 1997. This is because the current economic situation differs in some aspects from that of the previous tax hike. Specifically, (1) the government is preparing an economic package with a total size of about 5 trillion yen; (2) emerging economies, some of which suffered from simultaneous declines in stock prices, bond prices, and in the value of their currencies this year, are becoming resilient to negative shocks compared to 1997, when the Asian currency crisis occurred, due to the establishment of backstops such as the accumulation of foreign reserves; and (3) Japan’s financial system has been stable as a whole.

Sato went on to predict above trend growth in 2014 H2. I think the majority of this information is priced into the market already.

BARCHART.COM - USD-JPY Weekly - December 2013.

.

.

Source: Barchart.com

Bigcharts - Nikkei 225 - December 2013.

.

.

Source: Big Charts

Despite the sharp correction since Tuesday,during the last few weeks the Japanese Yen (JPY) has begun a renewed decline (see weekly chart above). Earlier this year short JPY and long Nikkei futures (see daily chart above) proved to be an excellent trading opportunity. The election of Shinzo Abe (LDP) as the 90th Prime Minister in December 2012, with his “Three Arrows” policy, spelt hope for an economy which had been moribund, in GDP growth terms, for more than a decade. However, the present Japan story really begins on 25th April 1949 when the JPY was fixed against the US$ at a rate of JPY360 – this fixed rate remained in tact until the collapse of the Bretton Woods agreement in 1971. In the aftermath of WWII Japan, like Germany, took advantage of, what proved to be, a relatively low rate of exchange to rebuild their shattered economy. In the case of Japan one of the societal responses to the end of WWII was to encourage a nation of savers and investors.

As the US withdrew from Japan the political landscape became dominated by the LDP who were elected in 1955 and remained in power until 1993; they remain the incumbent and most powerful party in the Diet to this day. Under the LDP a virtuous triangle emerged between the Kieretsu (big business) the bureaucracy and the LDP. Brian Reading (Lombard Street Research) wrote an excellent, and impeccably timed, book entitled Japan: The Coming Collapse in 1989. By this time the virtuous triangle had become, what he coined the “Iron Triangle”.

Nearly twenty five years after the publication of Brian’s book, the” Iron Triangle” is weaker but alas unbroken. However, the election of Shinzo Abe, with his plan for competitive devaluation, fiscal stimulus and structural reform has given the electorate hope.  Abe’s “Three Arrows” policy takes its name from a 16th century Japanese legend which gives his proposal a cultural attraction, but he will need more than elegant words to overcome the difficulties of implementing the third arrow:-

Mori Motonari(1497 – 1571)ruler of the Chugoku area of Western Japan, found his land on the brink of war. He called his three eldest sons to his castle and gave the first an arrow, asking him to break it. Of course, his son easily broke the arrow in two. Then, Mori gathered three arrows together, gave them again to one of his sons, and asked him to break these three arrows, all together. His son tried with all his strength to break the arrows but it was impossible. Mori explained to his sons, “Just like one arrow, the power of just one person can easily be overcome. However, three arrows together cannot be destroyed. Human strength is the same as these arrows; we cannot be defeated if we work together.”

The BoJ’s 2% inflation target and policy of “quantitative and qualitative easing” (QQE) have been effective in managing market expectations – the JPY is lower and the Nikkei higher without too dramatic a backing up of Japanese Government Bond (JGB) yields. However, doubts about Abe’s ability to deliver the essential third arrow heralded a reversal of both JPY and the Nikkei during the summer. Now the JPY is declining once more and the Nikkei, rising – although other major stock markets have also performed strongly of late.

Is this the beginning of the next stage of the “Japan Trade” or are we merely witnessing year end rebalancing of portfolios?

Emerging Markets

To answer this question I believe we also need to consider the position of China, South Korea and other emerging markets. China is the growing regional hegemon within South East Asia and its territorial disputes with its neighbours around the South and East China Sea are likely to escalate – its announcement last month of the Air Defense Identification Zone (ADIZ) in the East China Sea is likely to sour relations with South Korea. This article from The Diplomat provides more information: –

http://thediplomat.com/2013/11/is-the-china-south-korea-honeymoon-over

Yet, at the same time China is an essential export market for these neighbours; according to a recent article from China Daily, Japan’s exports to China hit a four year low as a result of the rising military tensions surrounding the Senkaku/Diaoyu Islands : –

http://usa.chinadaily.com.cn/business/2013-08/15/content_16897913.htm

This year the US resumed its place as Japan’s largest export market, a position it had lost to China in 2009, however China is still a close second – although it also remains Japan’s largest import market.

For a broader review of the current geopolitical situation within the region, this week’s China-US Focus newsletter from the China – United States Exchange Foundation –  Japan and China: Courting Confrontation – is a useful resume:-

http://www.chinausfocus.com/foreign-policy/japan-and-china-courting-confrontation/

South Korea’s exports to China are also lower this year due to a slowing of Chinese growth, but, helped by stronger exports to Europe and the US, they have been able to support higher GDP growth – together with higher inflation – than Japan. The ending of the Iranian Oil embargo, easing upward geopolitical pressure on energy prices, will help South Korea maintain growth. Its exports to Japan have been strong throughout 2013. Nonetheless, the South Korean administration is extremely sensitive to a weakening JPY, notwithstanding the world class quality of a number of its exporters. Of course, lower oil prices will also benefit Japan but its energy consumption per capita is roughly 20% lower than that of South Korea.

The US has been leading the way with structural reform and parts of Europe have followed suit, however, a number of commentators have voiced concern about the need for emerging markets to embrace structural reform. Anders Aslund of the Peterson Institute had this to say: –

http://www.piie.com/publications/wp/wp13-10.pdf

The hypothesis of this paper is that the emerging market growth from 2000 to 2012 was atypically high and we might be back in a situation that is more reminiscent of the early 1980s. The growth of the last 12 years was neither sustainable nor likely to last. Several cycles that are much longer than the business cycle exist. One is the credit cycle, which Claudio Borio (2012) assesses at 15 to 20 years.

Another is the commodity cycle, which last peaked in 1980 and might last 30 to 40 years (Jacks 2013, Hendrix and Noland forthcoming). A third is the investment or Simon Kuznets cycle, which appears related to both the credit and commodity cycles (Kuznets 1958). A fourth cycle is the reform cycle, which might also coincide with the Kondratieff cycle (Rostow 1978).

The author goes on to highlight seven reasons why high emerging market growth will not continue at the pace of the past decade:-

1. One of the biggest credit booms of all time has peaked out. Extremely low interest rates cannot

continue forever. A normalization is inevitable. Many emerging economies are financially vulnerable

with large fiscal deficits, public debts, current account deficits, and somewhat high inflation. 

2. A great commodity boom has peaked out, as high prices and low growth depress demand, while the

high prices have stimulated a great supply shock. 

3. The investment or Simon Kuznets cycle has peaked out, as the very high Chinese investment ratio is

bound to fall and real interest rates to rise.

4. Because of many years of high economic growth, the catch-up potential of emerging economies has

been reduced and growth rates are set to fall ceteris paribus.

5. Many emerging economies carried out impressive reforms from 1980 to 2000, but much fewer

reforms have taken place from 2000 to 2012. The remaining governance potential for growth has

been reduced. Characteristically, reforms evolve in cycles that are usually initiated by a serious crisis,

and after 12 good years complacency has set in in the emerging economies.

6. Worse, the governments of many emerging economies are drawing the wrong conclusion from

developments during the Great Recession. Many think that state capitalism and industrial policy have

proven superior to free markets and private enterprise. Therefore, they feel no need to improve their

economic policies but are inclined to aggravate them further.

7. Finally, the emerging economies have benefited greatly from the ever more open markets of the

developed countries, while not fully reciprocating. The West is likely to proceed with selective,

regional trade agreements rather than with general liberalization.

I am more optimistic about EM growth than Peterson because of the underlying economic renaissance I believe is happening in the USA, combined with the benefits which will accrue from harnessing Big Data and the improving “health-span” (the upside of extended Life-span) over the next ten to twenty years.

Free Trade

A further factor to consider is the progress, or otherwise, of the Trans Pacific Partnership (TPP) and other agreements.  The European Centre for International Political Economy (ECIPE) has produced a timely up-date here: –

http://www.ecipe.org/media/publication_pdfs/ECIPE_bulletin_TPP_Nov_2013_final.pdf

The TPP is not the only Free Trade Agreement (FTA) on the agenda but the negotiations, even of bi-lateral FTAs, is so protracted that the financial markets are unlikely to afford them any credence until they are signed and sealed.

Demographics

As I mentioned earlier, historically Japan has been a nation of savers and investors. As JGB yields trended towards zero, investors looked for higher yields abroad. Today, in a world of near zero interest rates in the major economies, the “carry trade” is no longer the attraction it once was. More significantly, going forward, demographics will also change the direction of capital flows. Savers are retiring and become consumers. Foreign assets, which have gradually been repatriated during the last decade, will be eclipsed by consumption of foreign goods – the Japanese have been running a trade deficit since the beginning of 2012 – see the link below from Trading Economics:-

http://www.tradingeconomics.com/japan/balance-of-trade

Derivatives

The “carry trade” is discussed extensively in a recent working paper from the IMF – The Curious Case of the Yen – they make an impressive empirical case for a non-domestic cause of JPY “safe-haven” behaviour: –

http://www.imf.org/external/pubs/ft/wp/2013/wp13228.pdf

During risk-off episodes, the yen is a safe haven currency and on average appreciates against the U.S. dollar. We investigate the proximate causes of yen risk-off appreciations. We find that neither capital inflows nor expectations of the future monetary policy stance can explain the yen’s safe haven behavior. In contrast, we find evidence that changes in market participants’ risk perceptions trigger derivatives trading, which in turn lead to changes in the spot exchange rate without capital flows. Specifically, we find that risk-off episodes coincide with forward hedging and reduced net short positions or a buildup of net long positions in yen. These empirical findings suggest that offshore and complex financial transactions should be part of spillover analyses and that the effectiveness of capital flow management measures or monetary policy coordination to address excessive exchange rate volatility might be limited in certain cases.

The IMF concludes that the derivative “carry trade” is largely responsible for the safe-haven behaviour of the last few years:-

The evidence presented in this paper supports the interpretation of the yen as a currency with safe haven status. But safe haven effects work differently for the yen than for other safe haven currencies. Surprisingly and in contrast to the experience of the Swiss Franc, yen risk-off appreciations appears unrelated to capital inflows (cross-border transactions) and do not seem supported by expectations about the relative stance of monetary policies. Instead, we presented evidence that portfolio rebalancing through offshore derivative transactions occur contemporaneously to yen risk-off appreciations. This could reflect either a causal effect of portfolio rebalancing through derivative transactions or the workings of self-fulfilling expectations causing both currency appreciation and portfolio rebalancing.

Conclusion

In an unreformed developed economy like Japan the downside risks to growth remain and these risks temper my enthusiasm for Japanese stocks. Protracted fiscal stimulus by the Japanese government has been crowding out productive private investment for many years.  Japan and South Korea may have similar deflated GDP growth rates since 1997 but I would prefer to invest in a country where private domestic product is the engine of growth. Japanese stocks may rise as the JPY trends lower but the initial windfall to Japanese corporate profits is likely to be tempered by regulatory or tariff style retaliation from their neighbours and the need to repay Japanese government debt via taxation in the longer-term.

The JPY, however, is a different matter. Regulatory reforms such as the introduction of central counterparty, increasing margin requirements for OTC derivatives and the introduction of swap execution facilities (SEFs) are factors which should reduce the nominal size of the JPY “carry trade”.  The lower yield differential between the major currencies has also reduced the attraction of trade.  Demographic headwinds are now beginning to favour consumption over saving and Japanese government debt will need to be repaid in the fullness of time. Japanese corporations may defy gravity by overseas expansion but domestic firms will have to accept a protracted period of slow growth as the economy rebalances away from government spending towards private sector investment.

At the beginning of 2013, whilst I liked both trades, I advocated being long Nikkei futures rather than short JPY. Going into 2014 my preferences are reversed.