A Brave New World for Value Investing

A Brave New World for Value Investing

In the Long Run - small colour logo

Macro Letter – No 129 – 05-06-2020

A Brave New World for Value Investing

  • Stock markets have rebounded from their March lows on fiscal and monetary stimulus
  • Corporate bond spreads have narrowed in their wake
  • The prospect of further fiscal spending and broader quantitative easing remains
  • The global economy has changed forever and value analysis is back in demand

Perhaps the most frequently used adjective during the Covid pandemic is ‘unprecedented.’ On the 14th February, when I published – Macro Letter – No 126 – 14-02-2020 – When the facts change – I wrote: –

My title is the first part of JM Keynes famous remark, ‘When the facts change, I change my mind.’ This phrase has been nagging at my conscience ever since the Coronavirus epidemic began to engulf China and send shockwaves around the world. From an investment perspective, have the facts changed? Financial markets have certainly behaved in a predictable manner. Government bonds rallied and stocks declined. Then the market caught its breath and stocks recovered. There have, of course been exceptions, while the S&P 500 has made new highs, those companies and sectors most likely to be effected by the viral outbreak have been hardest hit.

Much has happened since, yet, in my conclusion, I stated: –

…the facts always change but, unless the Covid-19 pandemic should escalate dramatically, the broad investment themes appear largely unchanged. Central banks still weld awesome power to drive asset prices, although this increasingly fails to feed through to the real economy.

… Like an addictive drug, the more the monetary stimulus, the more the patient needs in order to achieve the same high. The direct financial effect of lower interest rates is a lowering of bond yields; lower yields spur capital flows into higher yielding credit instruments and equities. However, low rates also signal an official fear of recession, this in turn prompts a reticence to lend on the part of banking intermediaries, the real-economy remains cut off from the credit fix it needs. Asset prices keep rising, economic growth keeps stalling; the rich get richer and the poor get deeper into debt. Breaking the market addiction to cheap credit is key to unravelling this colossal misallocation of resources, a trend which has been in train since the 1980’s, if not before. The prospect of reserving course on subsidised credit is politically unpalatable, asset owners, especially indebted ones, will suffer greatly if interest rates should rise, they will vote accordingly. The alternative is more of the same profligate policy mix which has suspended reality for the past decade. From an investment perspective, the facts have not yet changed and I have yet to change my mind.

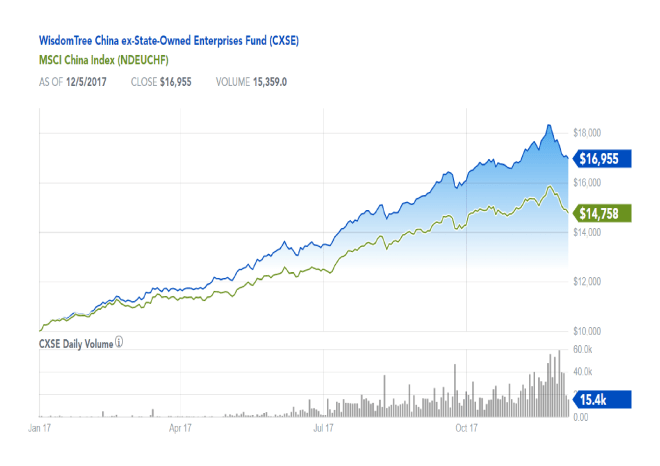
To judge by the current level of the Nasdaq 100 (current level 9,683 as at COB 03-06-2020, just 1.6% below its all-time high) the unprecedented crisis has been met by an equally unprecedented policy response. The S&P 500 has lagged the Nasdaq somewhat and the MSCI World Index still more: –

Nasdaq 100 v SPX v MSCI - Yahoo Finance (1)

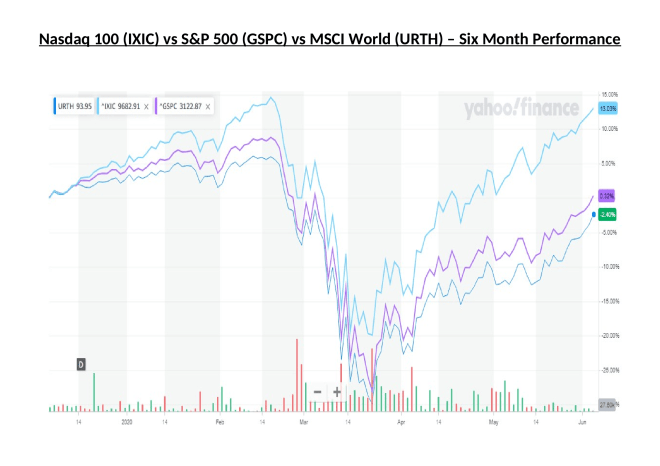
Source: Yahoo Finance

Returning to my letter from February, the facts have changed, governments and central bankers have responded to a crisis, a crisis which proved far worse than anticipated. The stock market collapsed, but has now regained composure, nevertheless, the main driver of stock market performance for more than a decade – ability of central banks to lower interest rates – has been exhausted. The central bankers’ armoury is not quiet empty, however, they still have the QE bazooka which can be aimed at corporate bonds and even common stocks, but, not wishing to exceed their mandates they have turned to their respective governments’ for guidance and succour.

Governments’ can and have responded to the pandemic in a manner which is both broader and more direct in its impact on the economy and businesses. Going forward the effect of government largesse will be felt in a less consistent manner than the largesse of central banks. For governments’ employment will take precedence over corporate profits, corporate executives would be wise to recognise the profound change in the terms of engagement. Stock performance can no longer be assured by increasing debt to repurchase stock. Mergers which rely on rationalisation will be thwarted from above. Wages are unlikely to rise given the increase in unemployment, but the cost of making incumbent employees redundant will have adverse consequences both seen and unseen. Firms that hire will find favour, those that trim payrolls will not.

We will witness the return of the Value Investor, an endangered species who underperformed the Index Trackers during the decade since the great financial crisis. The great rotation away from index tracking or hugging is about to begin. Technology will continue to provide new employment opportunities even as more roles in the wider economy become automated. The public sector will create opportunities. Infrastructure spending is set to bring a ‘New, new deal’ to those in need of work. Healthcare will continue to expand as the population of developed countries age and life expectancy increases.

Other changes are also afoot. Working from home is about to become the norm for many people. Video conferencing, now widely adopted, brings into question the need for excessive travel. Demand for office space is already in retreat. Many firms are reporting unexpected productivity gains from the enforced ‘work from home edict,’ and have cancelled leases in favour of smaller, more flexible office space. Meanwhile, those eponymous start-ups, for whom flexible office space was the norm, have made a virtue of necessity, slowing their cash-burn – and mollifying investors in the process – by closing their offices altogether.

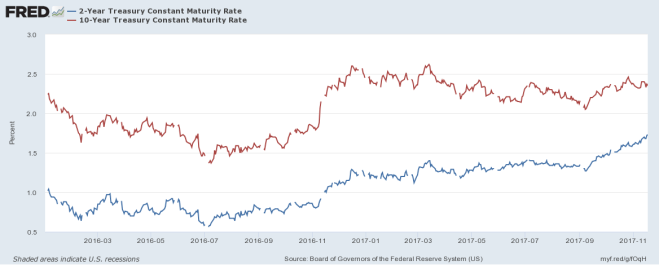
As economies recover from the effects of the lockdown, companies will fall into three categories based on their prospects for recovery from the dual supply and demand shock – ‘L,’ ‘U’ and ‘V’. The Tech giants (V) have rebounded and their prospects remain strong, even at these exalted valuations. Investment Grade Corporates (U) will take longer to recover, but even before interest rates were lowered by the Federal Reserve (Fed) these corporations were preparing for an economic slowdown. Q1 corporate debt issuance surged to the highest since records began in 1980: –

1-US-debt-issuance-20-05-2020 refinitiv

Source: Refinitiv

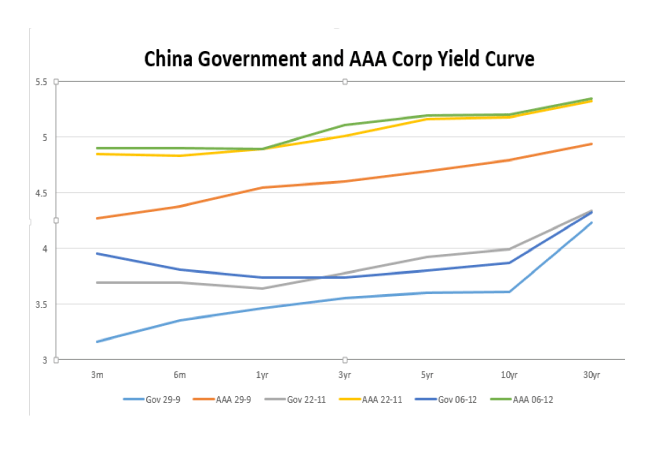
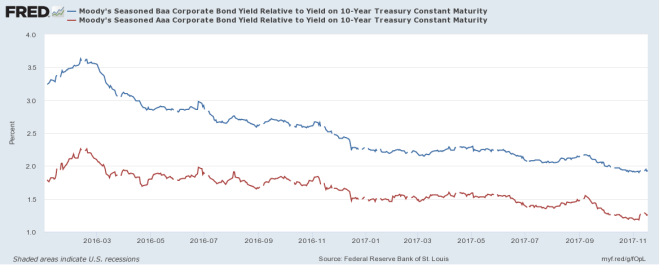
The High-Yield bond market followed in the wake of Investment Grade issuers, although the sudden widening of credit spreads in March dampened their ardour. Issuance returned with renewed urgency as soon the Federal Reserve announced that ‘Junk bonds’ where to be included in its expanded asset purchase program: –

2-US-debt-issuance-20-05-2020

Source: Refinitiv

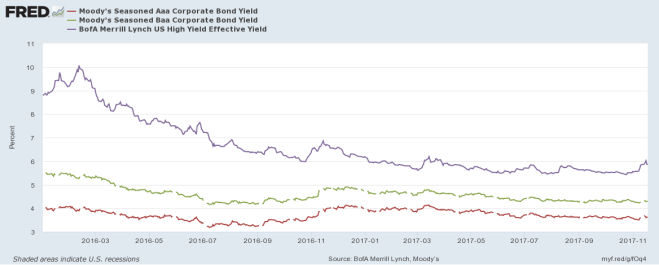
This chart from the St Louis Fed tracks yield changes year-to-date for the High Yield bond index: –

fredgraph (1) HY YTD

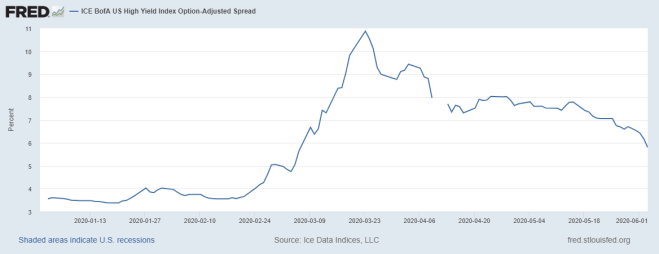
Source: Ice Data Indices, Federal Reserve

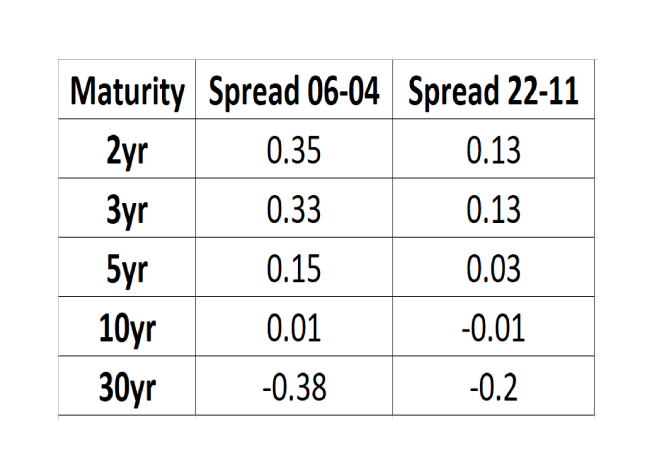
High yield bond yields remain elevated despite the interest rate cuts and Fed asset purchase promises. On 3rd June they averaged 5.8% up from 3.56% in mid-February, but far below their 23rd March high of 10.87%.

Many of the firms in the high yield sector (L) are involved in the Oil and Gas industry. As oil and gas prices rebound, they will regain some composure and, being high profile employers, they should receive government support. Other firms may fare less well, these are those destined to follow an ‘L-shaped’ recovery. Their survival will be dependent on their ability to provide employment, some will be saved, others will fail.

Conclusion

Stock and corporate bond markets have regained much of their composure since late March. Central banks and governments have acted to ameliorate the effects of the global economic slowdown. As the dust begins to settle, the financial markets will adjust to a new environment, one in which value-based stock and bond market analysis will provide an essential aid to navigation.

The geopolitics of trade policy, already a source of tension before the pandemic struck, has been turbo-charged by the simultaneous supply and demand shocks and their impact on global supply chains. Supply chains will shorten and diversify. Robustness rather than efficiency will be the watch-word in the months and years ahead. This sea-change in the functioning of the world economy will not be without cost. It will appear in increased prices or reduced corporate profits. Value-based investment analysis will be the best guide in this brave new world.

Low yield, no yield, negative yield – Buy now but don’t forget to sell

Low yield, no yield, negative yield – Buy now but don’t forget to sell

In the Long Run - small colour logo

Macro Letter – No 118 – 12-06-2019

Low yield, no yield, negative yield – Buy now but don’t forget to sell

  • The amount of negative yielding fixed securities has hit a new record
  • The Federal Reserve and the ECB are expected to resume easing of interest rates
  • Secondary market liquidity for many fixed income securities is dying
  • Outstanding debt is setting all-time highs

To many onlookers, since the great financial crisis, the world of fixed income securities has become an alien landscape. Yields on government bonds have fallen steadily across all developed markets. As the chart below reveals, there is now a record US$13trln+ of negative yielding fixed income paper, most of it issued by the governments’ of Switzerland, Japan and the Eurozone: –

Bloomberg - Negative Yield - 21st June 2019

Source: Bloomberg  

The percentage of Eurozone government bonds with negative yields is now well above 50% (Eur4.3trln) and more than 35% trades with yields which are more negative than the ECB deposit rate (-0,40%). If one adds in investment grade corporates the total amount of negative yielding bonds rises to Eur5.3trln. Earlier this month, German 10yr Bund yields dipped below the deposit rate for the first time, amid expectations that the ECB will cut rates by another 10 basis points, perhaps as early as September.

The idea that one should make a long-term investment in an asset which will, cumulatively, return less at the end of the investment period, seems nonsensical, except in a deflationary environment. With most central banks committed to an inflation target of around 2%, the Chinese proverb, ‘we live in interesting times,’ springs to mind, yet, negative yielding government bonds are now ‘normal times’ whilst, to the normal fixed income investor, they are anything but interesting. As Keynes famously observed, ‘Markets can remain irrational longer than I can remain solvent.’ Do not fight this trend, yields will probably turn more negative, especially if the ECB cuts rates and a global recession arrives regardless.

Today, government and investment grade corporate debt has been joined by a baker’s dozen of short-dated high yield Euro names. This article from IFR – ‘High-yield’ bonds turn negative – explains: –

About 2% of the euro high-yield universe is now negative yielding, according to Bank of America Merrill Lynch.

That percentage would rise to 10% if average yields fall by a further 35bp, said Barnaby Martin, European credit strategist at the bank.

He said the first signs of negative yielding high-yield bonds emerged about two weeks ago in the wake of Mario Draghi’s speech in Sintra where the ECB president hinted at a further dose of bond buying via the central bank’s corporate sector purchase programme. There are now more than 10 high-yield bonds in negative territory…

The move to negative yields for European high-yield credits is unprecedented; it didn’t even happen in 2016 when the ECB began its bond buying programme.

During Q4, 2018, credit spreads widened (and stock markets declined) amid expectations of further Federal Reserve tightening and an end to ECB QE. Now, stoked by fears of a global recession, rate expectation have reversed. The Fed are likely to ease, perhaps as early as this month. The ECB, under their new broom, Christine Lagarde, is expected to embrace further QE. The corporate sector purchase program (CSPP) which commenced in June 2016, already holds Eur177.8bln of corporate bonds, but increased corporate purchases seem likely; it is estimated that the ECB holds between 25% and 30% of the outstanding Eurozone government bond in issue, near to its self-imposed ceiling of 33%. Whilst the amount in issues is less, the central bank has more flexibility with Supranational and Euro denominated non-EZ Sovereigns (50%) and greater still with corporates (70%). In this benign interest rate environment, a continued compression of credit spreads is to be expected.

Yield compression has been evident in Eurozone government bonds for decades, but now a change in relationship is starting become evident. Even if the ECB does not increase the range of corporate bonds it purchases, its influence, like the rising tide, will float all ships. Bund yields are likely to remain most negative and the government obligations of Greece, the least, but, somewhere between these two poles, corporate bonds will begin to assume the mantle of the ‘nearly risk-free.’ With many Euro denominated high-yield issues trading below the yield offered for comparable maturity Italian BTPs, certain high-yield corporate credit is a de facto alternative to poorer quality government paper.

The chart below is a snap-shot of the 3m to 3yr Eurozone yield curve. The solid blue line shows the yield of AAA rated bonds, the dotted line, an average of all bonds: –

Eurozone AAA bond Yields vs All Bonds - ECB

Source: ECB

It is interesting to note that the yield on AAA bonds, with a maturity of less than two years, steadily becomes less negative, whilst the aggregated yield of all bonds continues to decline.

The broader high-yield market still offers positive yield but the Eurozone is likely to be the domicile of choice for new issuers, since Euro high-yield now trades at increasingly lower yields than the more liquid US market, the liquidity tail is wagging the dog: –

US vs EZ HY - Bloomberg

Source: Bloomberg, Barclays

The yield compression within the Eurozone has been more dramatic but it has been mirrored by the US where the spread between BBB and BB narrowed to a 12 year low of 60 basis points this month.

Wither away the dealers?

Forgotten, amid the inexorable bond rally, is dealer liquidity, yet it is essential, especially when investors rush for the exit simultaneously. For corporate bond market-makers and brokers the impact of QE has been painful. If the ECB is a buyer of a bond (and they pre-announce their intentions) then the market is guaranteed to rise. Liquidity is stifled in a game of devil take the hindmost. Alas, non-eligible issues, which the ECB does not deign to buy, find few natural buyers, so few institutions can justify purchases when credit default risk remains under-priced and in many cases the yield to maturity is negative.

An additional deterrent is the cost of holding an inventory of fixed income securities. Capital requirements for other than AAA government paper have increased since 2009. More damaging still is the negative carry across a wide range of instruments. In this environment, liquidity is bound to be impaired. The danger is that the underlying integrity of fixed income markets has been permanently impaired, without effective price intermediation there is limited price discovery: and without price discovery there is a real danger that there will be no firm, ‘dealable’ prices when they are needed most.

In this article from Bloomberg – A Lehman Survivor Is Prepping for the Next Credit Downturn – the interviewee, Pilar Gomez-Bravo of MFS Investment Management, discusses the problem of default risk in terms of terms of opacity (the emphasis is mine): –

Over a third of private high-yield companies in Europe, for example, restrict access to financial data in some way, according to Bloomberg analysis earlier this year. Buyers should receive extra compensation for firms that curb access to earnings with password-protected sites, according to Gomez-Bravo.

Borrowers still have the upper hand in the U.S. and Europe. Thank cheap-money policies and low defaults. Speculation the European Central Bank is preparing for another round of quantitative easing is spurring the rally — and masking fragile balance sheets.

Borrowers still have the upper hand indeed, earlier this month Italy issued a Eur3bln tranche of its 2.8% coupon 50yr BTP; there were Eur17bln of bids from around 200 institutions (bid/cover 5.66, yield 2.877%). German institutions bought 35% of the issue, UK investors 22%. The high bid/cover ratio is not that surprising, only 1% of Euro denominated investment grade paper yields more than 2%.

I am not alone in worrying about the integrity of the bond markets in the event of another crisis, last September ESMA –  Liquidity in EU fixed income markets – Risk indicators and EU evidence concluded: –

Episodes of short-term volatility and liquidity stress across several markets over the past few years have increased concerns about the worsening of secondary market liquidity, in particular in the fixed income segment…

…our findings show that market liquidity has been relatively ample in the sovereign segment, potentially also due to the effects of supportive economic policies over more recent years. This is different from our findings in the corporate bond market, where in recent years we did not find systematic and significant drop in market liquidity but we observed episodes of decreasing market liquidity when market conditions deteriorated…

We find that in the sovereign bond segment, bonds that have a benchmark status and are characterised by larger outstanding amounts tend to be more liquid while market volatility is negatively related to market liquidity. Outstanding amounts are the main bond-level drivers in the corporate bond segment…

With reference to corporate bond markets, the sensitivity of bond liquidity to bond-specific and market factors is larger when financial markets are under stress. In particular, bonds characterised by more volatile market liquidity are found to be more vulnerable in periods of market stress. This empirical result is consistent with the market liquidity indicators developed for corporate bonds pointing at episodes of decreasing market liquidity when wider market conditions deteriorate.

ESMA steer clear of discussing negative yields and their impact on the profitability of market-making, but the BIS annual economic report, published last month, has no such qualms (the emphasis is mine): –

Household debt has reached new historical peaks in a number of economies that were not at the heart of the GFC, and house price growth has in many cases stalled. For a group of advanced small open economies, average household debt amounted to 101% of GDP in late 2018, over 20 percentage points above the pre-crisis level… Moreover, household debt service ratios, capturing households’ principal and interest payments in relation to income, remained above historical averages despite very low interest rates…

…corporate leverage remained close to historical highs in many regions. In the United States in particular, the ratio of debt to earnings in listed firms was above the previous peak in the early 2000s. Leverage in emerging Asia was still higher, albeit below the level immediately preceding the 1990s crisis. Lending to leveraged firms – i.e. those borrowing in either high-yield bond or leveraged loan markets – has become sizeable. In 2018, leveraged loan issuance amounted to more than half of global publicly disclosed loan issuance loans excluding credit lines.

… following a long-term decline in credit quality since 2000, the share of issuers with the lowest investment grade rating (including financial firms) has risen from around 14% to 45% in Europe and from 29% to 36% in the United States. Given widespread investment grade mandates, a further drop in ratings during an economic slowdown could lead investors to shed large amounts of bonds quickly. As mutual funds and other institutional investors have increased their holdings of lower-rated debt, mark-to-market losses could result in fire sales and reduce credit availability. The share of bonds with the lowest investment grade rating in investment grade corporate bond mutual fund portfolios has risen, from 22% in Europe and 25% in the United States in 2010 to around 45% in each region.

How financial conditions might respond depends also on how exposed banks are to collateralised loan obligations (CLOs). Banks originate more than half of leveraged loans and hold a significant share of the least risky tranches of CLOs. Of these holdings, US, Japanese and European banks account for around 60%, 30% and 10%, respectively…

…the concentration of exposures in a small number of banks may result in pockets of vulnerability. CLO-related losses could reveal that the search-for-yield environment has led to an underpricing and mismanagement of risks…

In the euro area, the deterioration of the growth outlook was more evident, and so was its adverse impact on an already fragile banking sector. Price-to-book ratios fell further from already depressed levels, reflecting increasing concerns about banks’ health…

Unfortunately, bank profitability has been lacklustre. In fact, as measured, for instance, by return-on-assets, average profitability across banks in a number of advanced economies is substantially lower than in the early 2000s. Within this group, US banks have performed considerably better than those in the euro area, the United Kingdom and Japan…

…persistently low interest rates and low growth reduce profits. Compressed term premia depress banks’ interest rate margins from maturity transformation. Low growth curtails new loans and increases the share of non-performing ones. Therefore, should growth decline and interest rates continue to remain low following the pause in monetary policy normalisation, banks’ profitability could come under further pressure.

Conclusion and investment opportunities

Back in 2006, when commodity investing, as part of a diversified portfolio, was taking the pension fund market by storm, I gave a series of speeches in which I beseeched fund managers to consider carefully before investing in commodities, an asset class which had for more than 150 years exhibited a negative expected real return.

An astonishingly large percentage of fixed income securities are exhibiting similar properties today. My advice, then for commodities and today, for fixed income securities, is this, ‘By all means buy, but remember, this is a trading asset, its long-term expected return is negative; in other words, please, don’t forget to sell.’

China – leading indicator? Stocks, credit policy, rebalancing and money supply

China – leading indicator? Stocks, credit policy, rebalancing and money supply

In the Long Run - small colour logo

Macro Letter – No 88 – 08-12-2017

China – leading indicator? Stocks, credit policy, rebalancing and money supply

  • Chinese bond yields have reached their highest since October 2014
  • Chinese stocks have corrected despite the US market making new highs
  • The PBoC has introduced targeted lending to SMEs and agricultural borrowers
  • Money supply growth is below target and continues to moderate

Chinese 10yr bond yields have been rising steadily since October 2016. They never reached the low or negative levels of Japan or Germany. 1yr bonds bottomed earlier at 1.76% in June 2015 having tested 1% back in 2009.

The pattern and path of Chinese rates is quite different from that of US Treasuries. Last month rates increased to their highest since 2014 and the Shanghai Composite index finally appears to have taken notice. The divergence, however, between Shanghai stocks and those of the US is worth investigating more closely.

The chart below shows the yield on 10yr Chinese Government Bonds since 2007 (LHS) and the 3 month inter-bank deposit rate over the same period (RHS):-

china 10yr vs 3 m interbank - 10yr

Source: Trading Economics

From a recent peak in 2014, yields declined steadily until October 2016, since when they have begun to rise quite sharply.

The next chart shows the change in yield of Government bonds and AAA Corporate bonds across the entire yeild curve:-

China_Government_vs_Corp_AAA_Yield_Curve

Source: PBoC

The dates I chose were 29th September – the day before the People’s Bank of China (PBoC) announced their targeted lending plan. The 22nd November – the day before the Shanghai index reversed and 6th December – bringing the data set up to date.

The general observation is simply that yields have risen across the maturity spectrum, but the next chart, showing the change in the spread between government and corporate paper reveals some additional nuances:-

China_Government_vs_AAA_Corp_Spread

Source: PBoC

Spreads have generally widened as monetary conditions have tightened. The widening has been most pronounced in the 30yr maturity. The widening of credit spreads may be driven by the prospect of $1trln of corporate debt which is due to mature between now and 2019.

Another factor may be the change in policy announced by the PBoC on September 30th. Bloomberg – China’s Central Bank Unveils Targeted Lending Plan to Aid Growth provides an excellent overview:-

Banks will enjoy 0.5 percentage point RRR cut if eligible lending exceeds 1.5 percent or more of their new lending in 2017

Deduction will be 1.5 percentage point if eligible lending reaches 10 percent or more of new lending in 2017, or if “inclusive finance” loans take up 10 percent of total outstanding loans in 2017

Rural commercial banks who meet an earlier requirement that at least 10 percent of new lending is local can receive a 1 percentage point reduction

The RRR is the Reserve Requirement Ratio. This is a targeted easing of lending requirements aimed at directing credit to small and medium sized enterprises (SMEs) rather than state owned enterprises (SOEs) and encouraging lending to the agricultural sector. It also favour banks over the shadow banking sector. This policy shift was a rapid response to a trend which has been evident this year. Whilst credit continues to expand the percentage of credit directed to SMEs dropped from 50% in 2016 to 30% in 2017 – this policy aims to rebalance the supply of credit.

Despite expectations that the first half of 2017 would be strongest, the Chinese economy continues to grow above official forecasts, Q3 GDP came in at 6.8%. M2 money supply growth, by contrast, was only 8.8% in October versus 9.2% in September. The chart below shows the declining pattern over the past five years:-

China_M2_Money_Supply_5yr_growth_rate_CEIC

Source: CEIC, PBoC

8.8% M2 growth still looks high when compared with the US (6%) the EU (5.1%) or Japan (3.9%) but with GDP increasing by 6.8% it does not look excessive. It is worth noting, however, that the PBoC target for M2 growth in 2017 is 12% down from 13% in 2016.

What impact has this had on stocks? Not much, so far, is the answer:-

Shanghai Index - 5yr

Source: Trading Economics, Shanghai SE

Chinese stocks, as I have mentioned previously, do not look excessively expensive by several measures, however, this is not to suggest that they will not fall. According to Star Capital, at the end of September the PE ratio for China was 7.6 but the CAPE ratio was a much higher 17.3. The Dividend yield (3.9%) offers some comfort nonetheless.

Conclusions and Investment Opportunities

Chinese economic growth remains spectacular but the authorities are interested in promoting inclusive growth rather than encouraging individual speculation. Official interest rates have been 4.35% since October 2015, which is the lowest they have ever been, however, the reverse repo rate was increased in January from 2.25% to 2.45% and the standing loan facility rate increased in March from 3.1% to 3.3%. The bond market expects this mild tightening bias to continue. Meanwhile, inflation, which was 1.9%, up from 0.8% in February, is hardly cause for concern.

Chinese stocks can be divided into SOEs and Non-SOEs. Since the beginning of 2017 the sectors have diverged sharply, as this chart of the WisdomTree China ex-State-Owned Enterprises Fund (CXSE) versus the MSCI China Index (NDEUCHF), indicates:-

Wisdomtree_ex-SOE_ETF_vs_MSCI_China_YTD

Source: WisdomTree, MSCI

Even since the end of November, when stocks fell abruptly, the outperformance of, what some are calling new-China, has been maintained. This is not to suggest that PBoC policy is deliberately designed to support the new-China economy, but when the interests of the Chinese people and that of enterprises align it can be a winning combination.

It is still too soon to predict the end of the rise in Chinese stocks, the authorities, however, are determined not to allow a repeat of the speculative bubble of 2015. The combination of a continued decline in the pace of money supply growth and higher bond yields, may see Chinese stocks decline in response to monetary tightening before those of developed nation countries. Chinese stocks trade differently to those listed in more open markets, nonetheless, the importance of China should not be underestimated: it might even be the leading indicator for world markets.

Bull market breather or beginning of the end?

Bull market breather or beginning of the end?

In the Long Run - small colour logo

Macro Letter – No 87 – 24-11-2017

Bull market breather or beginning of the end?

  • Stock markets have generally taken a breather during November
  • High yield and corporate bond yields have risen, but from record lows
  • Since April, the Interest Rate Swap yield curve has flattened far less than Treasuries
  • Global economic growth forecasts continued to be revised higher

Stock markets have finally taken a breather over the last fortnight, although the S&P 500 has made a new, marginal, high this week. Cause for concern has been growing, however, in the bond markets where 2yr US bonds have seen a stately rise in yields. The chart below shows the constant maturity 2yr (blue) and 10yr (red) Treasury Note since January 2016:-

2yr - 10yr Treasury Jan 2016 to present

Source: Federal Reserve Bank of St Louis

The flattening of the yield curve has led many commentators to predict an imminent recession. Looking beyond the Treasury market, however, the picture looks rather different. The next chart shows the spread of Moody’s Aaa and Baa corporate bond yields over 10yr Treasuries:-

Moodys Aaa and Baa Corps spread over 10yr Bond

Source: Federal Reserve Bank of St Louis, Moody’s

Spreads have continued to tighten despite the rise in short-term rates. In absolute terms their yields have risen since the beginning of November but this is from record lows. The High Yield Index (purple) shows this more clearly in the chart below:-

Moody Aaa and Baa plus ML HY since Jan 2016

Source: Federal Reserve Bank of St Louis, Moody’s, Merrill Lynch

A similar spike in yields was evident in November 2016. I believe, in both cases, this may be due to position squaring ahead of the Thanksgiving holidays and the inevitable decline in liquidity typical of December trading. There are differences between 2016 and this year, however, the strength of the high-yield bond bull market was even more pronounced last year but Treasury 2yr Note yields had only bottomed in July, it was too soon to predict a bear market and the Federal Reserve were assuming a less hawkish stance. This year the rising yield of 2yr Notes has been more clear-cut, which may encourage further liquidation over the next few weeks, however, with economic growth forecasts being revised higher, rating agencies have upgraded many corporate issuers. Credit quality appears to be improving even as official interest rates rise and the US Treasury yield curve flattens.

In Macro Letter – No 74 – 07-04-2017 – US 30yr Swaps have yielded less than Treasuries since 2008 – does it matter? I examined the evolution of the interest rate swap (IRS) market over the last few years. I’ve updated the table showing the spread between T-Bonds and IRS across maturities:-

Spread_spreads_April_vs_Nov_2016

Source: Investing.com, The Financials.com

At the 10yr maturity the differential between IRS and Treasuries has barely changed, but elsewhere along the yield curve, compression has occurred, with maturities of less than 10 years narrowing whilst the 30yr IRS negative spread has also compressed, from nearly 40 basis points below Treasuries to just 20 basis points today. In other words, the flattening of the IRS yield curve has been much less dramatic than that of the Treasury yield curve – 2yr/30yr IRS has flattening by 36 basis points since early April, whilst 2yr/30yr Treasuries has flattened by 76 basis points over the same period.

It is important to note that while the IRS curve has been flattening less rapidly it still remains flatter than the Treasury curve (IRS 2’s/30’s = 0.67% Treasury 2’s/30’s = 1.00%). One interpretation is that the IRS curve has been reflecting the weakness of economic growth for a protracted period while the Treasury curve has been artificially steepened by the zero interest rate policy of the Federal Reserve.

Conclusions and Investment Opportunities

Many commentators have pointed to the flattening of the Treasury yield curve as evidence of an imminent recession, the IRS curve, however, has flattened by far less, partly because it was flatter to begin with. Perhaps the IRS curve reflects the lower trend growth of the US economy since the great recession. An alternative explanation is that it is a response to investment flows and changes in the regulatory regime (as discussed in Macro letter – No74). One thing appears clear, the combination of unconventional central bank policies, such as quantitative easing (QE) and the relentless, investor ‘quest for yield’ over the last decade has distorted the normal signalling power of the bond market.

Economic growth forecasts continue to be revised upwards, prompting central banks to begin reducing the quantum of QE in aggregate. Corporate earnings have generally been rising, credit quality improving. We are nearer the end of the bull market than the beginning, but it is much too soon to predict the end, on the basis of the recent rise in corporate bond yields.