Macro Letter – No 39 – 03-07-2015
Which way now – FTSE, Gilts, Sterling and the EU referendum?
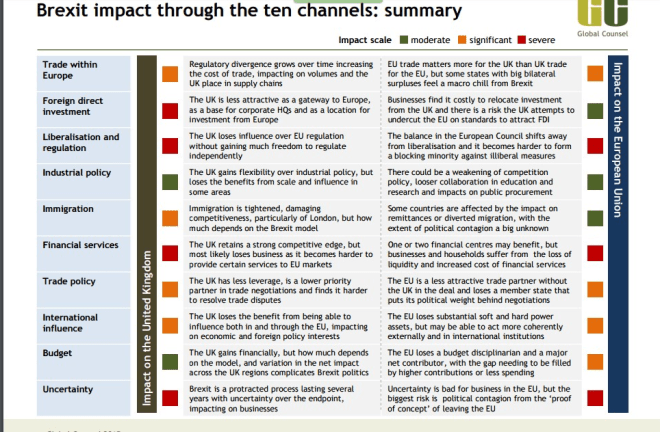
- Uncertainty is bad for business and the UK will struggle ahead of the referendum
- Gilt yields have been around 150bps higher than Bunds over the last 25yrs
- The DAX has substantially outperformed FTSE over the same period
- Higher productivity is key to UK growth but, in the long run, demographics will help
Last week the UK Prime Minister began to debate EU treaty reform with his European counterparts. He has a long way to go. The deadline for a UK referendum on EU membership is the end of 2017 but an up-hill battle is likely because all EU countries must ratify treaty changes – the referendum will come before EU treaty changes have been agreed. In this letter I will review the history of UKs, uncomfortable, membership of the EU and previous renegotiations, compared with today’s proposals. I will then go on to consider the implications for Sterling, Gilts and UK Stocks should the UK decide to stay or go.
A brief history of the UK and the EU
The last time the UK voted on EU, or as it was then called, European Economic Community (EEC) membership, was in 1975. At that time the “yes” vote won by 67.5%. This took place only two years after first joining, previous attempts to join in 1961 and 1967 having been vetoed by French President de Gaulle.
British scepticism about the political ambitions of the Schuman declaration of May 1950 meant the UK failed to join the European Coal and Steel Community – established at the Treaty of Paris in 1951 – but spent much of the decade debating EEC membership. When the EEC was finally established in 1958, the UK opted out for two principal reasons: concern about its relationship with the Commonwealth and other international alliances, and its preference for free-trade over economic organisation and sectoral policies. At that time the UK was torn between two foreign policy strategies, one focused on the European Free Trade Area, the other on the General Agreement on Tariffs and Trades – the predecessor to the World Trade Organisation (WTO).
The 1974 treaty renegotiation, just a year after joining the EEC, was driven by three factors: free-trade versus political integration, the effects of the collapse of Bretton Woods and subsequent inflation on the UK economy – Sterling had been considered a quasi-reserve currency up to this point – and the size of UK contributions to the EEC budget which the UK government considered to be excessive.
The table below lists the 1974 UK government demands for renegotiation and the outcomes:-
| DEMAND |
OUTCOME |
| Changes to CAP so as not to undermine free-trade |
None |
| Fairer financing of EEC budget |
Correcting mechanism |
| Withdrawal of UK from EMU |
Accepted |
| Retention of UK powers over regional, industrial and fiscal policy |
Creation of Regional Development fund supported by Ireland and Italy |
| Agreement on capital movement to protect UK jobs and balance of payments |
None |
| No harmonisation of VAT |
Never planned anyway |
| Access to Commonwealth goods |
Minor concessions |
The next major test of the UK relationship with the EU came during Margaret Thatcher’s first Conservative government (1979-1983) although an agreement with the EEC was not reached until her second term in 1984. On this occasion the issue was simply a question of how much the UK was paying in to the EU budget given that 80% of that budget was then spent on maintaining the Common Agricultural policy (CAP). The UK “rebate” was sanctioned because at that time the UK was the second poorest of the ten member EEC.
UK demands for treaty change 2015
The current UK renegotiation of EU membership is concerned with the following issues:-
| Restrictions to freedom of movement within the EU |
| Sovereignty of Sterling |
| Structural reform of the EU bureaucracy |
| Reclaiming of powers from Brussels to protect UK interests |
On the latter point, this takes two principal forms: the ability to block EU legislation where it may be detrimental to UK interests and the ending of a commitment to “ever closer union” in respect of UK membership.
The Sovereignty of Sterling is a relatively uncontentious issue, whilst structural reform of the EU bureaucracy is an ideal to which all European governments will accede, at least in principal; the problems arise over restrictions on free-movement of people – enshrined in Article 48 of the Treaty of Rome:-
1.Freedom of movement for workers shall be secured within the Community by the end of the transitional period at the latest. 2. Such freedom of movement shall entail the abolition of any discrimination based on nationality between workers of the Member States as regards employment, remuneration and other conditions of work and employment. 3. It shall entail the right, subject to limitations justified on grounds of public policy, public security or public health: (a) to accept offers of employment actually made; (b) to move freely within the territory of Member States for this purpose; (c) to stay in a Member State for the purpose of employment in accordance with the provisions governing the employment of nationals of that State laid down by law, regulation or administrative action; (d) to remain in the territory of a Member State after having been employed in that State, subject to conditions which shall be embodied in implementing regulations to be drawn up by the Commission. 4. The provisions of this Article shall not apply to employment in the public service.
This leaves, the reclaiming of powers from Brussels. “Ever closer union” is probably negotiable since EU member states have always moved at different rates, both economically and culturally. Allowing the UK to pick and choose which aspects of EU legislation it accepts, however, is like joining an exclusive club and then ignoring the rules. Under normal circumstances you’d be asked to leave.
One of the associated problems for the EU – that of, when to stop expanding – is discussed in this essay by Tim Price – Let’s Stick Together. He reviews the work of Leopold Kohr, in particular his seminal work “The Breakdown of Nations”:-
It all comes down to scale. As Kirkpatrick Sale puts it in his foreword to ‘The Breakdown of Nations’,
“What matters in the affairs of a nation, just as in the affairs of a building, say, is the size of the unit. A building is too big when it can no longer provide its dwellers with the services they expect – running water, waste disposal, heat, electricity, elevators and the like – without these taking up so much room that there is not enough left over for living space, a phenomenon that actually begins to happen in a building over about ninety or a hundred floors. A nation becomes too big when it can no longer provide its citizens with the services they expect – defence, roads, post, health, coins, courts and the like – without amassing such complex institutions and bureaucracies that they actually end up preventing the very ends they are intending to achieve, a phenomenon that is now commonplace in the modern industrialized world. It is not the character of the building or the nation that matters, nor is it the virtue of the agents or leaders that matters, but rather the size of the unit: even saints asked to administer a building of 400 floors or a nation of 200 million people would find the job impossible.”
Kohr showed that there are unavoidable limits to the growth of societies:
“..social problems have the unfortunate tendency to grow at a geometric ratio with the growth of an organism of which they are a part, while the ability of man to cope with them, if it can be extended at all, grows only at an arithmetic ratio.”
In the real world, there are finite limits beyond which it does not make sense to grow. Kohr argued that only small states can have true democracies, because only in small states can the citizen have some direct influence over the governing authorities.
What’s in it for the UK
In the interests of levity I’ve included a link to this summation of UK foreign policy with regard to Europe from the satirical TV programme Yes, Minister – this episode was first aired in 1980.
In the intervening 35 years, trying to decipher what is best for the UK has not become any easier. I’ve chosen just two organisations to represent the views for and against EU membership: Business for New Europe and Better off Out. Here’s how Business for New Europe make the case for staying in:-
As a member of the European Union, our companies can sell, without barriers, to a market of 500 million people. The Single Market means that exporters only need to abide by one set of European regulations, instead of 28 national ones. Europe is our biggest trading partner- it buys 45% of our exports. If we left the EU, companies would face tariffs and regulatory barriers to trade.
The free movement of capital means that EU companies can invest here in Britain freely. This investment, by companies like Siemens, creates jobs and grows our economy. 46% of all the foreign investment in Britain came from EU countries.
The EU provides funding for businesses to all regions of Britain, particularly those with the greatest need. From 2014 until 2020, £8 billion of EU money will go from Brussels to the UK. The biggest winners from this process are Cornwall, Wales, the Scottish Highlands, Northern Ireland and the North of England.
EU research funding helps universities and firms innovate to create the technologies of the future. Britain will receive £7 billion from the EU’s Horizon 2020 fund, and our small businesses receive more funding for hi-tech research than those of any other EU country. EU membership is vital to rebalancing the British economy.
Better off Out – sponsored by the Freedom Association – counter thus:-
10 Reasons to Leave
1.Freedom to make stronger trade deals with other nations. 2. Freedom to spend UK resources presently through EU membership in the UK to the advantage of our citizens. 3. Freedom to control our national borders. 4. Freedom to restore Britain’s special legal system. 5. Freedom to deregulate the EU’s costly mass of laws. 6. Freedom to make major savings for British consumers. 7. Freedom to improve the British economy and generate more jobs. 8. Freedom to regenerate Britain’s fisheries. 9. Freedom to save the NHS from EU threats to undermine it by harmonising healthcare across the EU, and to reduce welfare payments to non-UK EU citizens. 10. Freedom to restore British customs and traditions.
They go on to highlight 10 Myths about the risk of leaving – not all are economic so I’ve paraphrased their opinions below;-
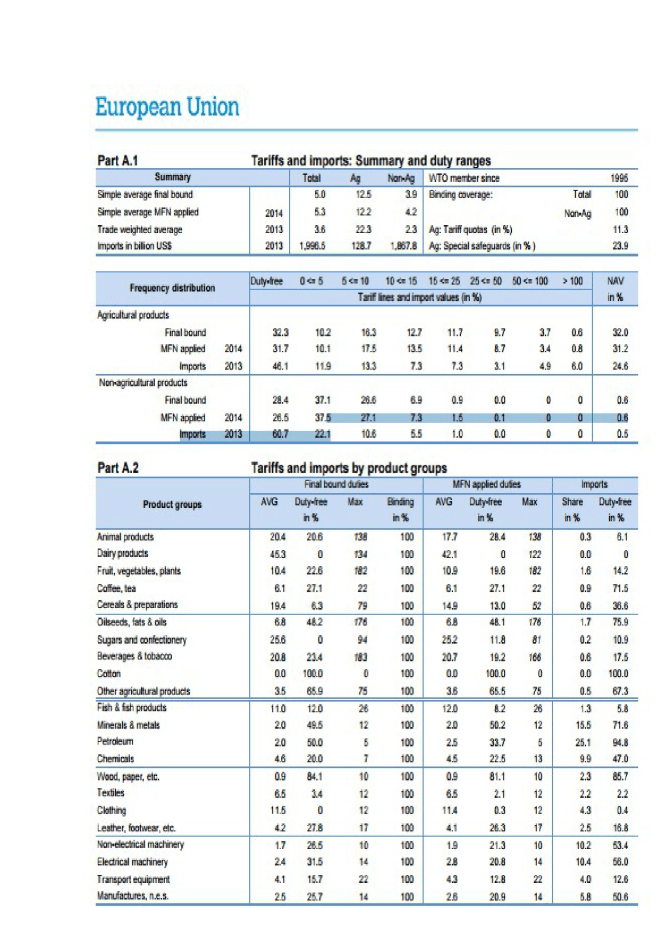
Britain would lose 3mln jobs if we left the EU – Under the terms of the Lisbon Treaty the UK would enter into an FTA with the EU. The WTO obliges them to do so too. Of more importance the UK trade balance will the EU is in increasing deficit – the other member states have more to lose.
Britain will be excluded from trade with the EU by Tariff Barriers – EU has FTAs with 53 countries with a further 74 countries pending. In 2009 UK charged customs duty of just 1.76% on non-EU imports. The EU Common Market is basically redundant already.
Britain cannot survive economically outside the EU in a world of trading blocs – Japan does and it’s not a member. The EU’s share of world GDP is forecast to be 15% in 2020, down from 26% in 1980. Norway and Switzerland export more, per capita, to the EU than the UK does. Britain’s best trading relationships are with the USA and Switzerland. The largest investor in the UK is US.
The EU is moving towards the UK’s position on cutting regulation and bureaucracy – EU directives are subject to a ‘rachet’ effect – once in place they are unlikely to be reformed or repealed. 80% of the UK’s GDP is generated within the UK so should not be subject to EU laws. In 2010, Open Europe estimated EU regulation had cost Britain £124 billion since 1998.
If we leave, Britain will have to pay billions to the EU and implement all its regulations without having a say – The UK has 8.4% of votes. The Lisbon Treaty ensured the loss of Britain’s veto in many more policy areas.
Swiss Case Study: The Swiss pay the EU less than CHF600mln a year for access to the EU market. They estimate the cost of full membership would be CHF3.4bln.
Norway Case Study: In 2009 Norway’s total financial contributions to the EEA (European Economic Area) agreement was Eur340mln Britain pays £18.4bln per annum.
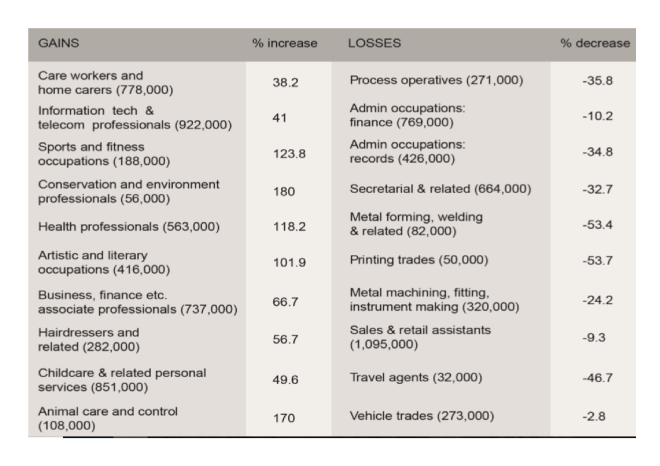
The EU has a positive impact on the British Economy – Fishing (115,000 jobs lost) farming, postal services and manufacturing have been devastated by EU membership. Unnecessary red tape, aid contributions, inflated consumer prices (due to CAP etc.) are indirect costs.
Britain will lose vital foreign investment as a consequence of leaving the EU – The 2010 Ernst and Young survey on UK’s attractiveness to foreign investors, found Britain still the number one Foreign Direct Investment (FDI) destination in Europe owing largely to the City of London and the UK’s close corporate relationship with the US. Key factors, in order of importance:-
Culture and values, English language, Telecommunications infrastructure, Quality of life, Stable social environment, Transport and logistics infrastructure.
Britain will lose all influence in the world by being outside the EU – Britain has a substantial ‘portfolio of power’ including membership of the G20 and G8, a permanent seat on the UN Security Council and seats on the IMF and WTO. The British Commonwealth has 54 nations which is being discriminated against by EU policy. London is the financial capital of the world and Britain has the sixth largest economy. The UK is also in the top ten manufacturing nations in the world.
Legally, Britain cannot leave the EU – A single clause Bill passed at Westminster can repeal the European Communities Act 1972 and its attendant Amendment Acts.
Having dealt with the main arguments for remaining in the EU, Better off Out do point out that creating an FTA with the EU may take time.
Greenland established a precedent when it left the EEC in 1985, this followed a referendum in 1982 and the signing of the Greenland Treaty in 1984. It had joined, as part of Denmark in 1973 but after it had achieved home rule in 1979 the importance of its fishing industry became a major economic incentive for it to leave the forerunner to the EU.
Greece may leave as early as next week and, as this March 2015 article from ECFR – The British problem and what it means for Europe makes clear, a Brexit will not be good for the EU either:-
An EU without Britain would be smaller, poorer, and less influential on the world stage. The UK makes up nearly 12.5 percent of the EU’s population, 14.8 percent of its economy, and 19.4 percent of its exports (excluding intra-EU trade). Furthermore, it runs a trade deficit of £28 billion, is home to around two million other EU citizens, and remains one of the largest net contributors to the EU budget (responsible for 12 percent of the budget in total).
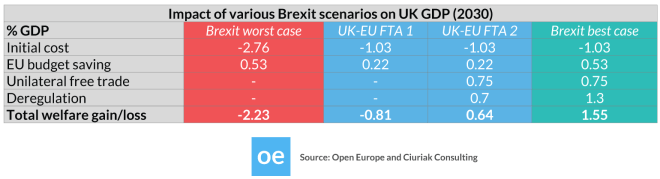
Meanwhile the Confederation of British Industry claim that being a member of the EU is worth £3,000 per household whilst Business for Britain estimate that the UK would save £933 per person from cheaper food if they left. In a report last week S&P chimed in, saying 30% of foreign direct investment (FDI) into the UK – representing 17% of GDP – was directed to financial services and insurance. 50% of this FDI emanated from other EU countries – this could be at risk if the UK should leave. So the debate rumbles on.
How is the UK economy evolving?
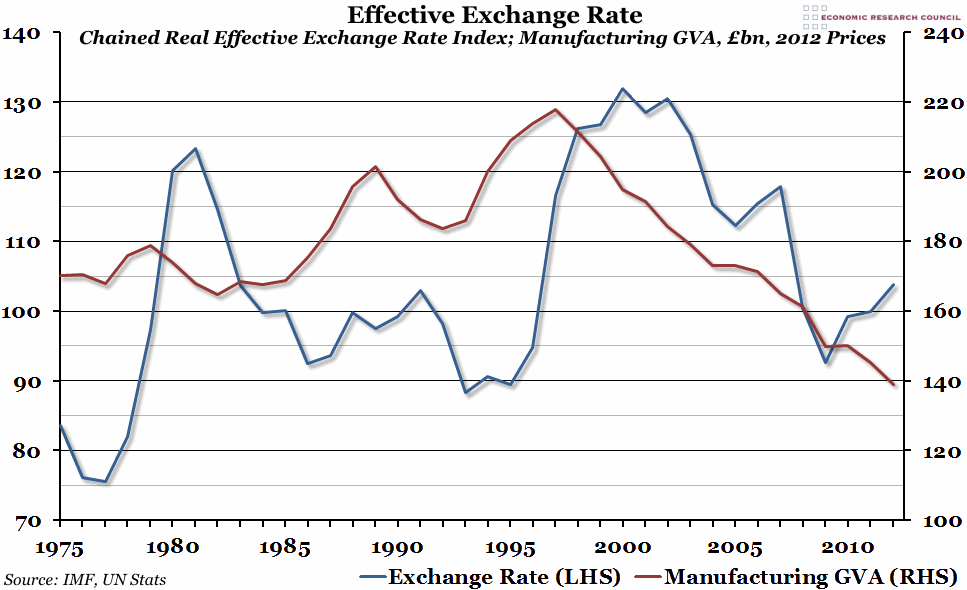
UK manufacturing has been in decline since the start of the millennium, whilst this decline was initially a reaction to the strength of Sterling it has yet to benefit from the subsequent weakness of the currency:-

Source: ERC, IMF, UN
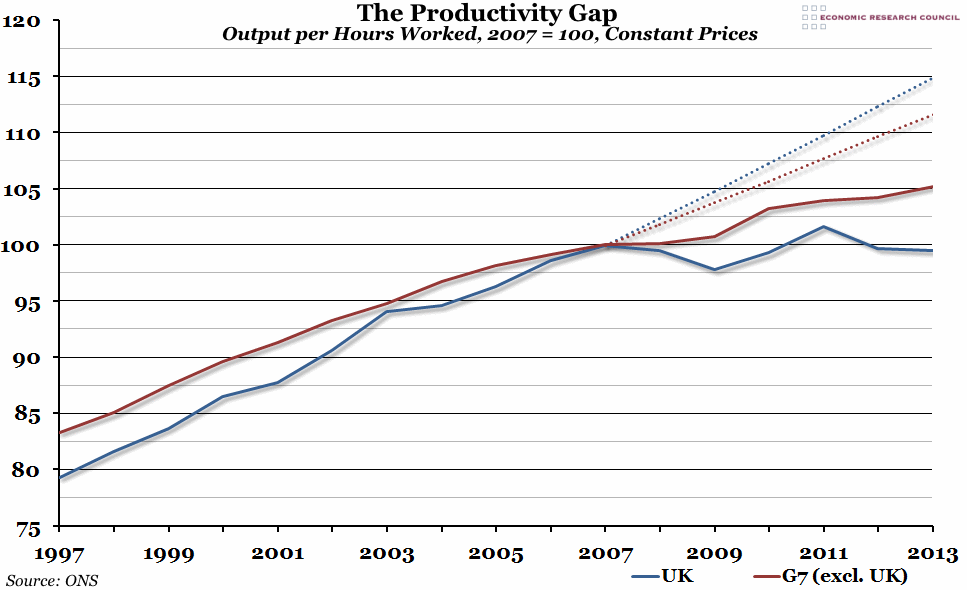
Total factor productivity is near the heart of this conundrum:-
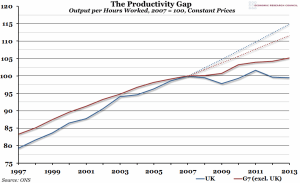
Source: ERC, ONS
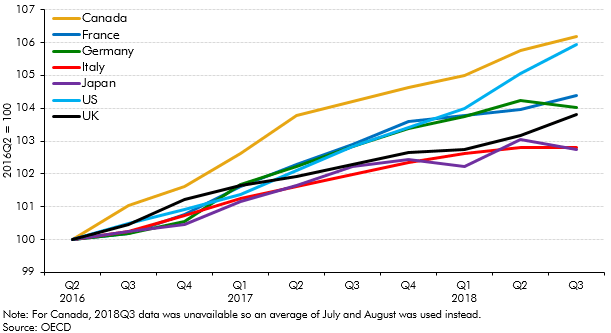
The UK is lying 6th out of the G7 in terms of output per hours worked, and since 2007, has underperformed the G7 average. The dotted line shows where productivity would have been had the recession not hit. The UK had been lagging its peers during the 1990’s so the predicted outperformance would merely have brought it back into the fold.
In a speech given last week the BoE’s Sir John Cunliffe – Pay and productivity: the next phase made a number of observations about the future:-
Between 2000 and 2007, the average worker in the UK automotive manufacturing industry produced 7.7 vehicles a year. Over the past seven years he/she averaged 9.8 vehicles a year. Productivity – output per worker – in car manufacturing has increased by 30% since the onset of the great financial crisis. Britain has become the fourth-biggest vehicle maker in the EU and is more efficient than bigger producers such as Germany and France.
… Unfortunately productivity in the UK has not followed the lead of the car industry. Indeed, the opposite is true. In 2014 labour productivity in the UK was actually slightly lower than its 2007 level. In the seven years between 2000 and 2007 labour productivity grew at an average annual rate of about 2% a year. In the seven years that followed, our annual productivity growth averaged just below zero.
Or to look at it another way, the level of labour productivity – output per hour worked – in the UK economy is now 15% below where it would have been if pre-crisis trends had continued.
…It is true that the average output per hour of the rest of the G7 advanced economies is only around 5% above its pre-crisis level. But as I have noted, in the UK it has not even recovered to that level. And in 2013 output per hour in the UK was 17 percentage points below the average for the rest of the G7 – the widest gap since 1992.
…In the 10 years prior to the crisis, growth in the hours worked in the UK economy, accounted for 23% of the UK’s overall economic growth. The mainstay of our economic growth, the other 77%, came from growth in productivity. Since 2013 only 9% of our annual economic growth has come from productivity improvement. The remaining 91% has come from the increase in the total hours worked.
As a result, employment in the UK is now around its highest rate since comparable records began in 1971. Over 73% of people aged 16-64 are working. There are now over 31 million people in work in the UK. Unemployment has fallen at among its fastest rate for 40 years and is now very close to its pre-crisis level – over the past two years over 1 million jobs have been created.
… Productivity growth can be divided into two sorts of change: the change in productivity inside individual firms and the changes between firms. The first, the changes within firms, happens as firms increase their efficiency. The second happens as labour and capital are reallocated between firms, from the less productive ones to the more productive.
… After collapsing in the crisis, productivity began to increase again within firms two years ago. We expect that to continue. As the economy grows, spare capacity is used up. The real cost of labour increases relative to the cost of investment. Firms have a greater incentive to find efficiency gains and to switch away from more labour-intensive forms of production. This should boost productivity.
In contrast, productivity growth due to the reallocation of resources in the economy remains weak. We can see this in the divergence of rates of returns across firms which remain remarkably and unusually high and the change in capital across sectors which has been particularly low. When the reallocation mechanism is working, the transfer of capital and labour from the less productive to the more productive pulls up the level of productivity in the economy and reduces the divergence between firms. The high degree of divergence between firms at present implies that this reallocation mechanism is working significantly less powerfully now than before the crisis. This can also be seen in the proportion of loss-making firms which stands at around 20% higher than its long-run average. Company liquidations also remain low. So there is still more than a hint of ‘zombiness’ in the corporate sector.
For more on productivity issue this working paper BoE – The UK productivity puzzle 2008–13: evidence from British businesses is full of interesting insights.
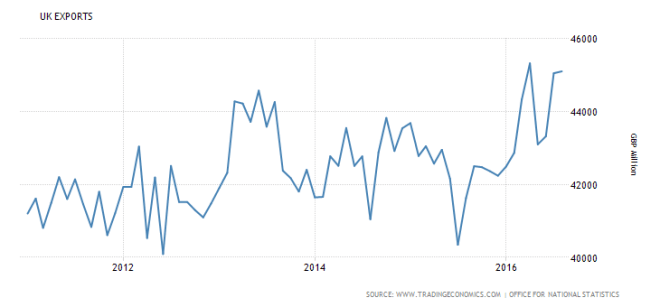
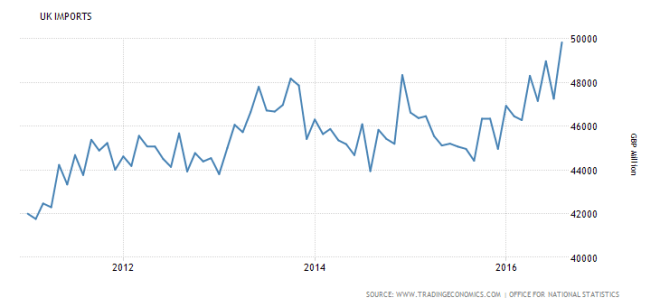
The UK service sector continues to grow, although its share of exports to the EU remains smaller than that of goods – 37% vs 49%. Services exports to the rest of the world are the driver of UK export growth.
Conclusion and Investment Opportunities
Sterling
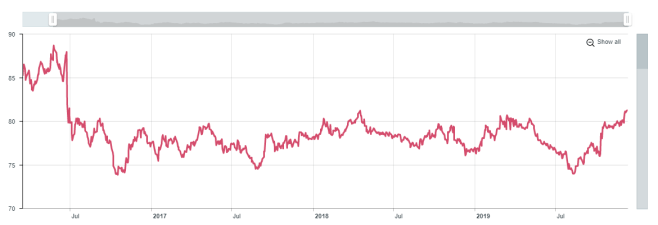
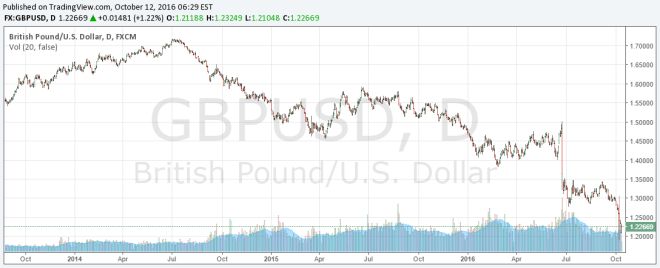
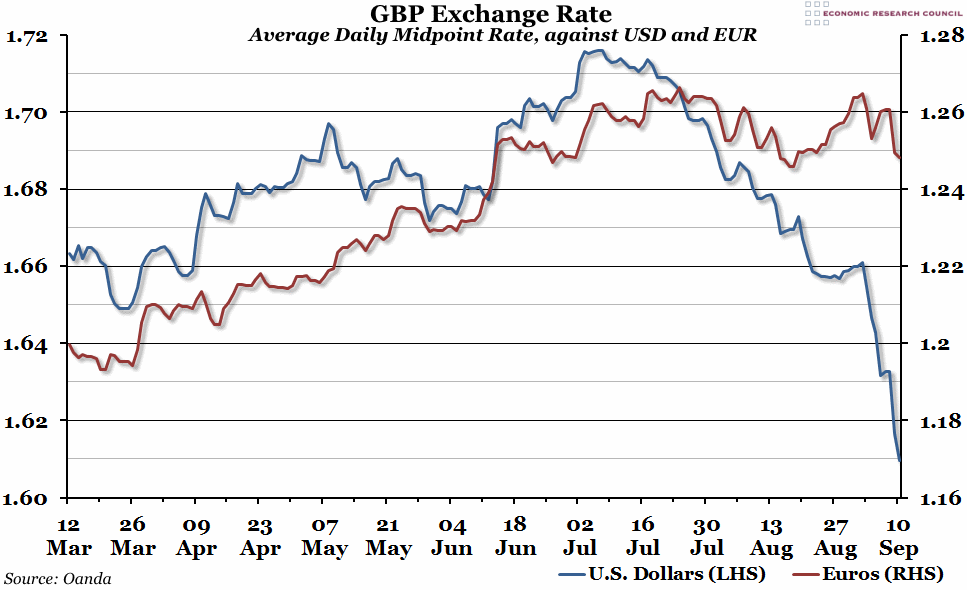
In search of a surrogate for the uncertainty surrounding the UK referendum, the chart below shows the impact on Sterling of the sudden realization that the Scottish might vote to leave the Union in 2014:-

Source: Oanda and ERC
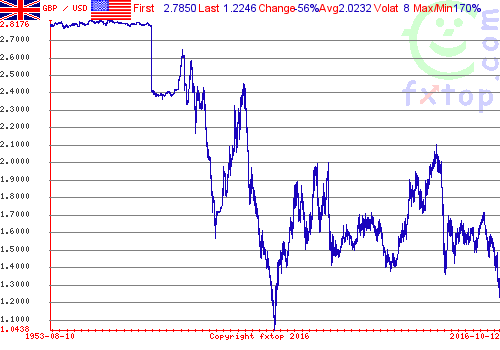
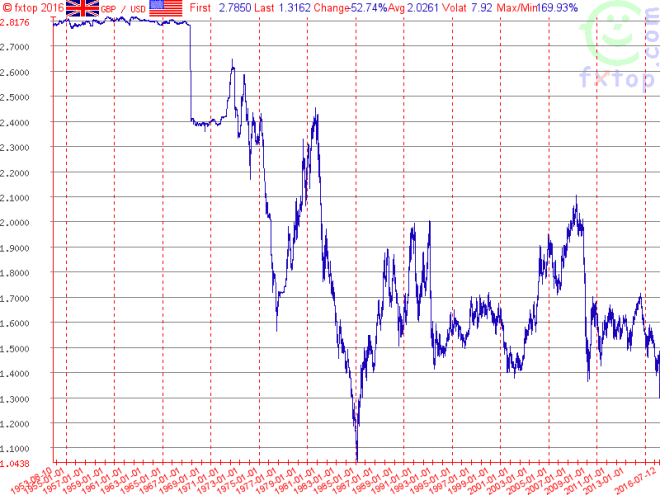
Should the population of the UK vote to forsake the EU, the relative stability of the GBPEUR exchange rate is likely to become structurally more volatile, the move against the USD from 1.72 to 1.61 is but a foretaste of what we should anticipate. However, the 40% appreciation in the UK effective exchange rate between 1995 and 2000 – see the earlier chart above – and reversal between 2000 and 2009, suggests that membership of the EU has not led to the stability in exchange rates one might have expected.
Between the breakdown of Bretton Woods in March 1973 and the establishment of the European Exchange Rate Mechanism (ERM) In March 1979 (which the UK chose not to join until October 1990) was a period of intense currency volatility – exacerbated by significant interest rate differentials. During this period the GBP effective exchange rate actually moved less than it has since 2000. Nonetheless, higher daily volatility will impose a modicum of additional cost on UK businesses. This 2004 paper from the FRBSF – Measuring the Costs of Exchange Rate Volatility looks at the subject in more detail:-
The main quantitative finding is that the welfare effects of exchange rate volatility are likely to be very small for many countries. When numbers are chosen to permit the model to reproduce basic characteristics of the U.S. economy, the model indicates that the loss of utility is equal in size to only about 0.1% of annual consumption; that is, people would be willing to exchange only about 0.1% of their annual consumption level to eliminate the exchange rate volatility in the economy.
Gilts
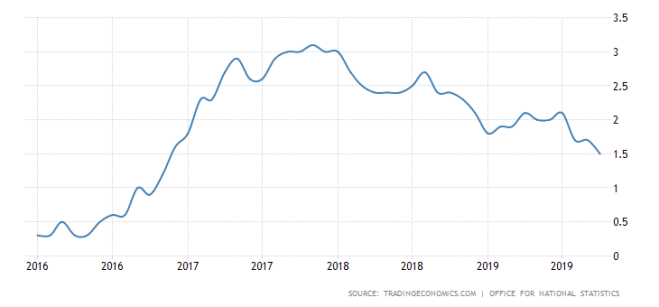
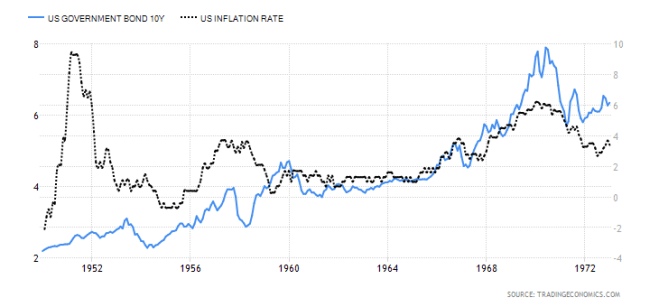
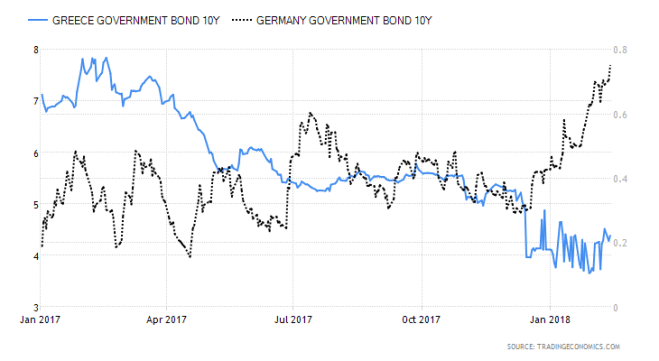
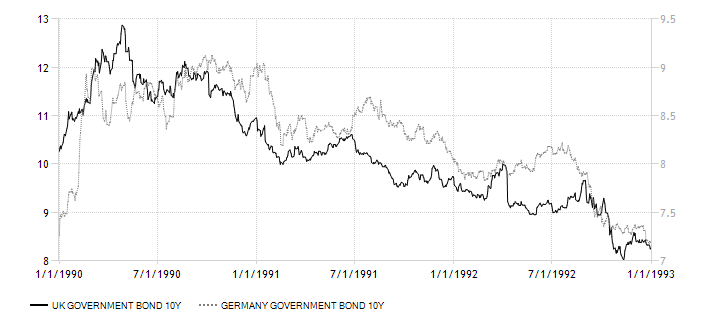
The UK has exhibited structurally higher inflation than much of the Eurozone (EZ) since the collapse of Bretton Woods. That, combined with the relative asynchronicity of the UK and German economic cycles, made it difficult for the UK to operate inside the ERM – it lasted less than two years, from October 1990 to September 1992. The chart below shows German and UK 10yr Government bond yields during this period, Bunds, with lower yields, on the right hand scale:-
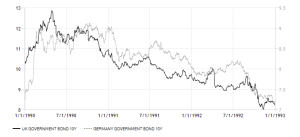
Source: Trading Economics
Germany was struggling during this period and the Hartz labour market reforms occurred shortly thereafter.
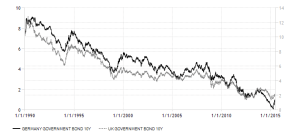
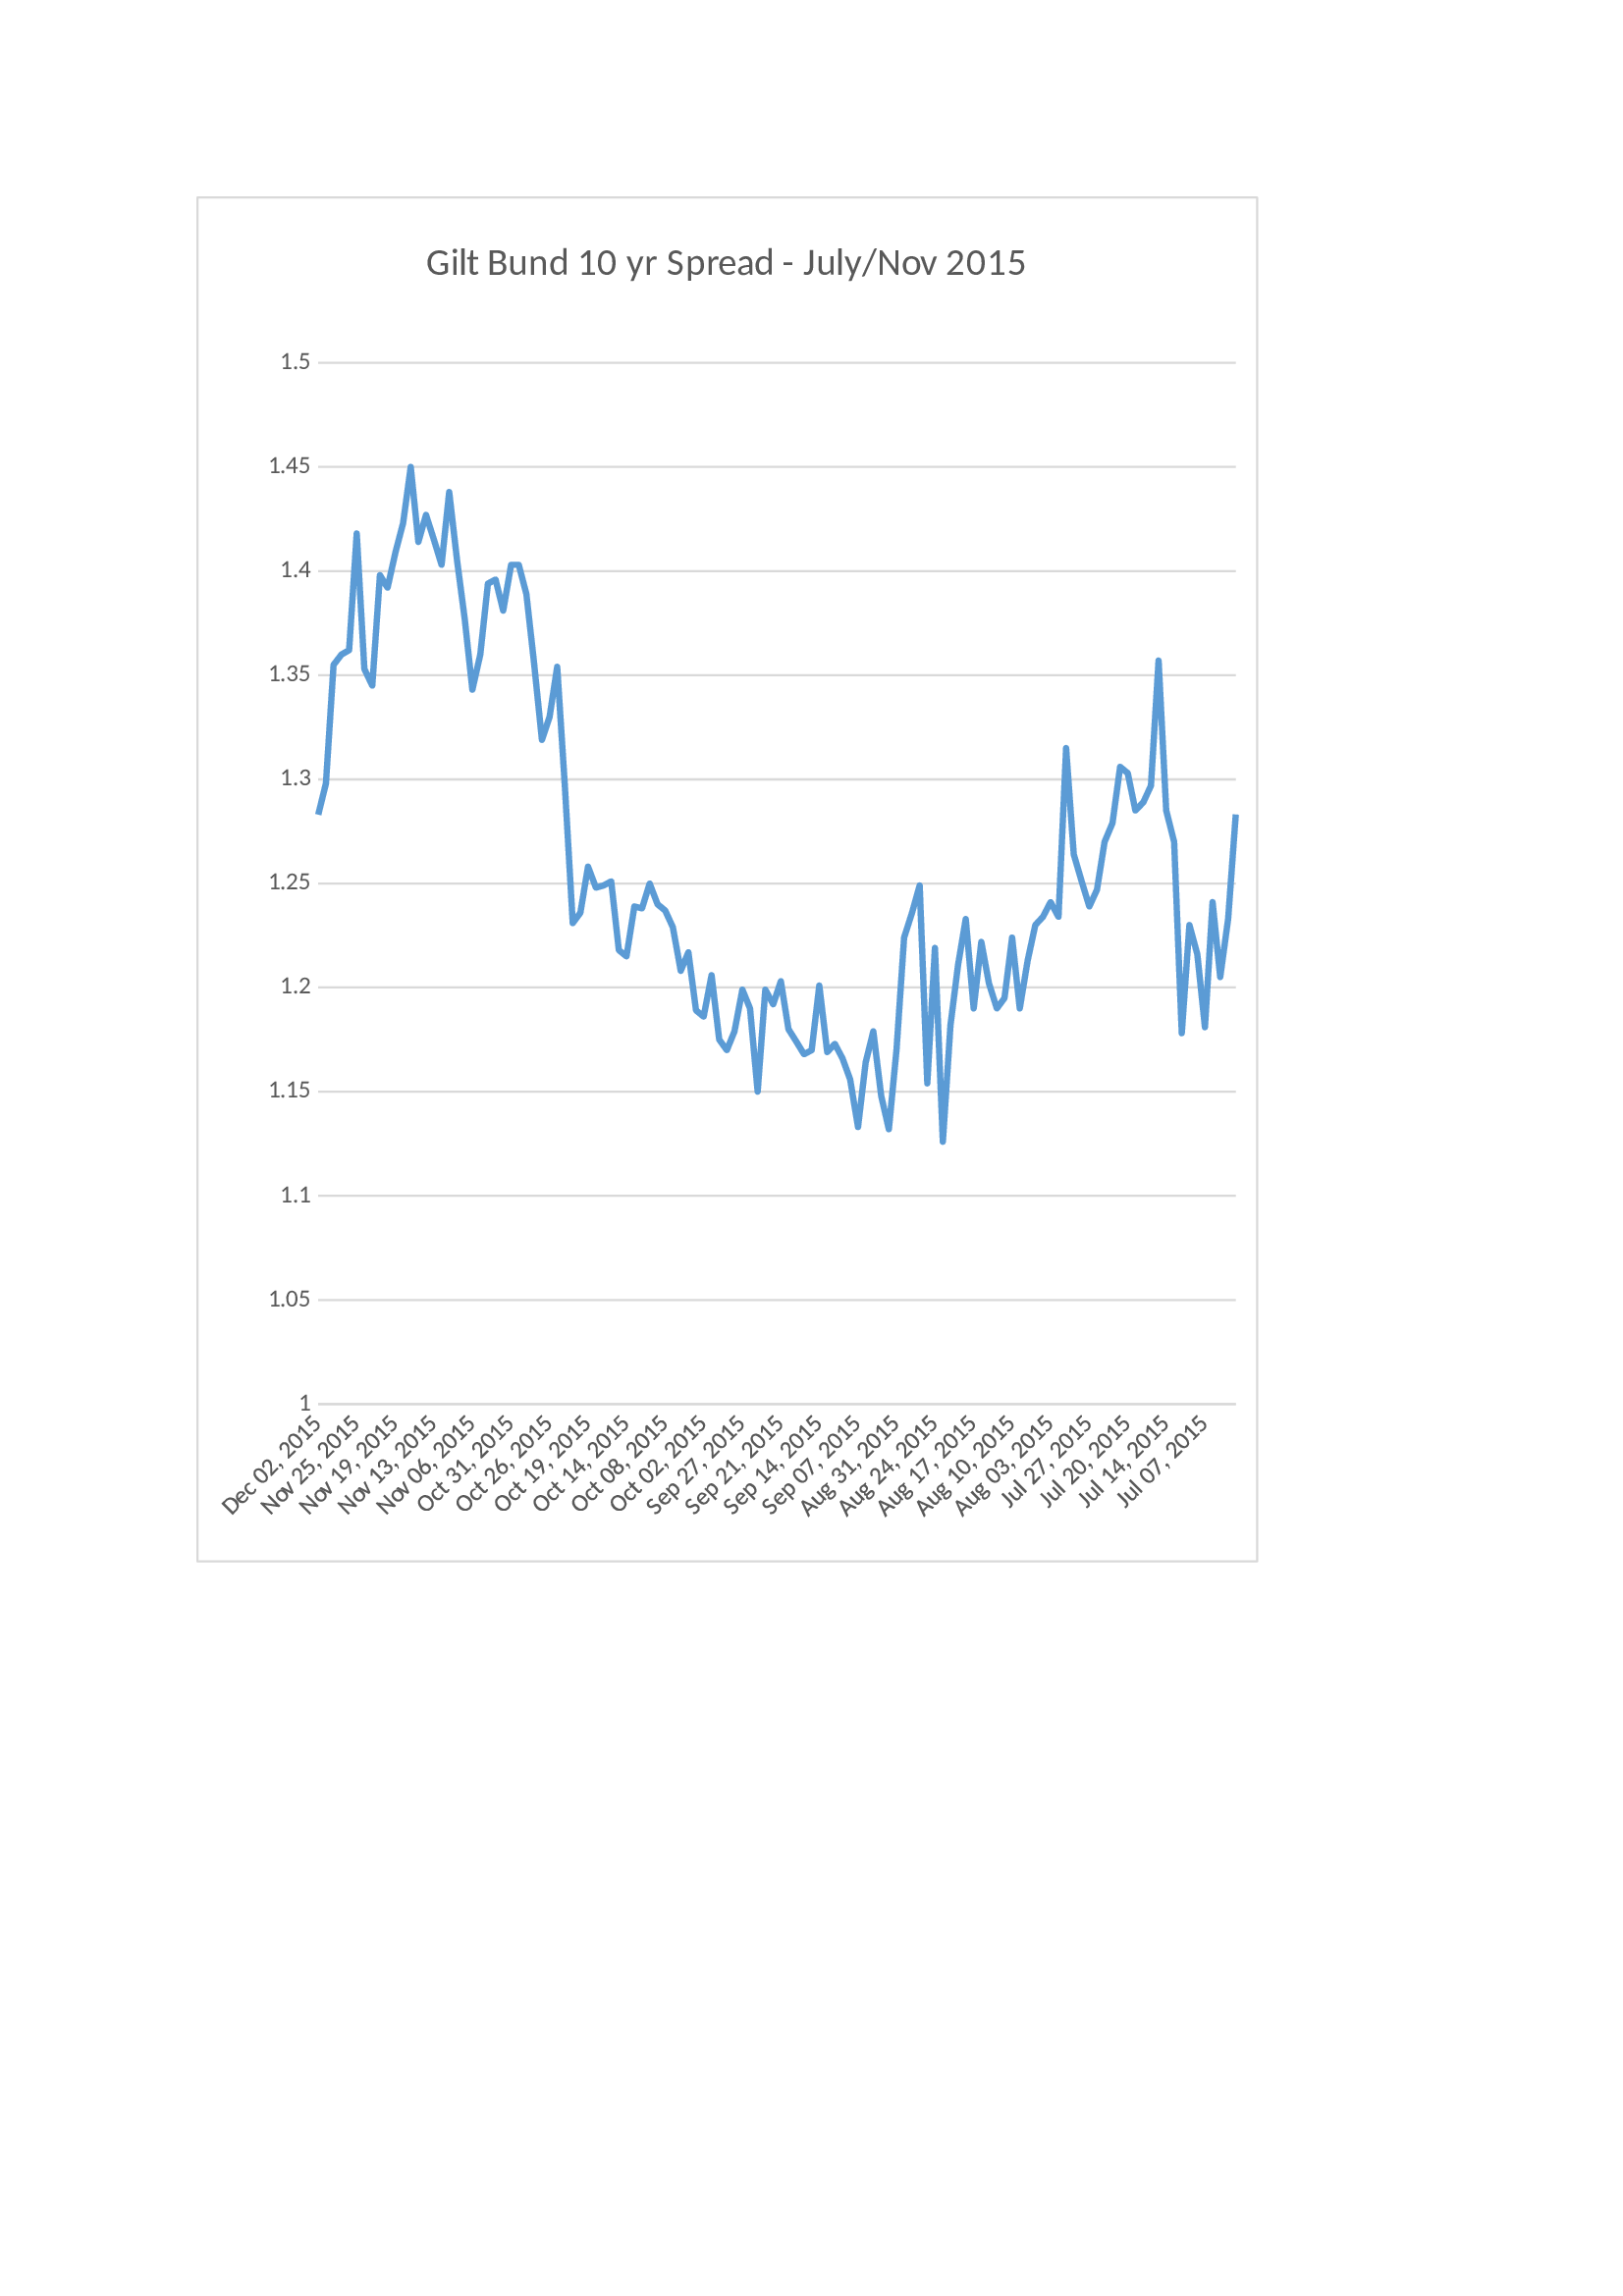
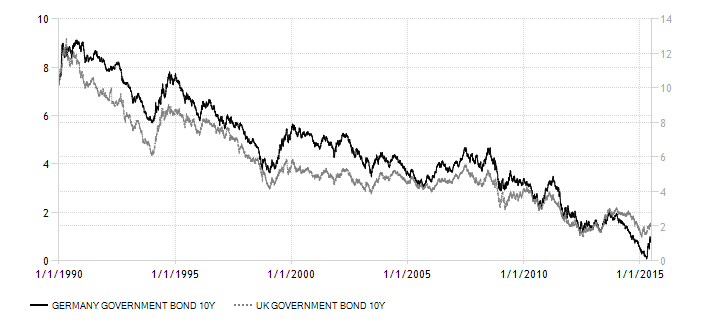
Source: Trading Economics
As the chart above shows UK Gilts have traded at a higher yield than German Bunds for most of last 25 years. I think it would be reasonable to assume Gilt yields, had the UK remained in the ERM and joined the Euro, would have been between those of Germany and France during this period. In other words, the cost of UK government financing has been around 150bp higher than it might have achieved had it joined the EZ.
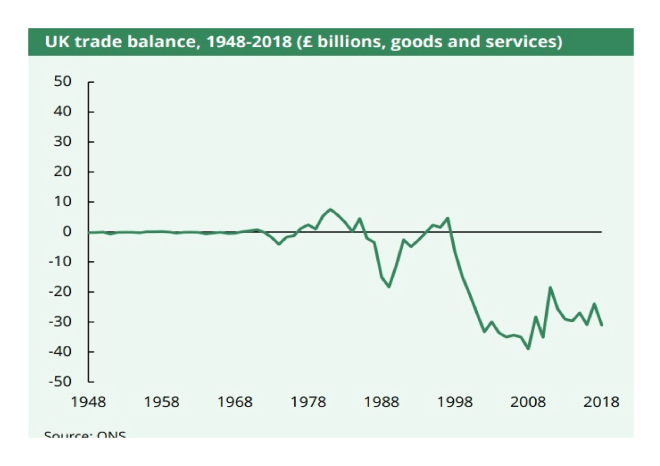
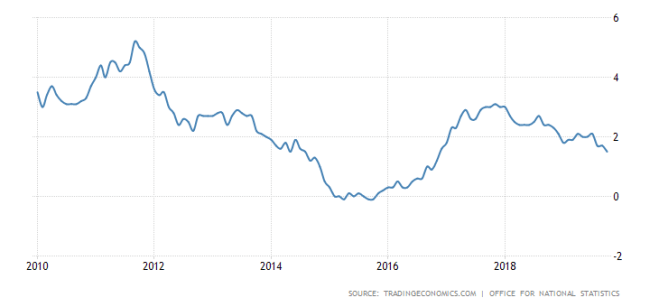
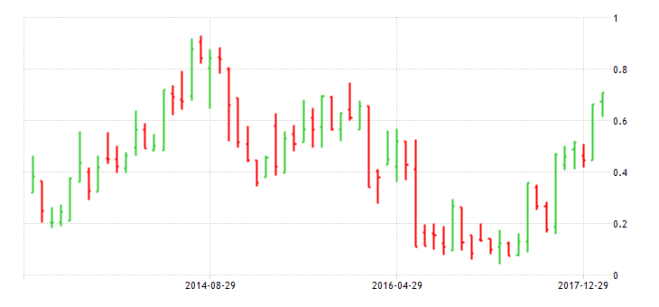
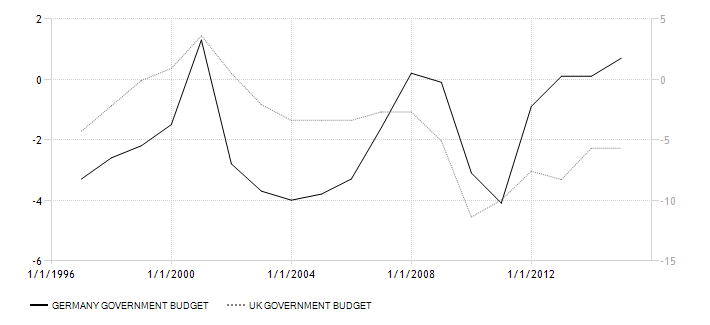
UK inflation over the same period has been significantly higher than Germany’s, in real-terms Bunds have offered vastly superior returns. This differential may also be due to the UK government running a substantially larger budget deficit during the period. I regret the data in the chart below only goes back to 1996. The UK balance is shown on the right hand scale:-

Source: Trading Economics
Stocks
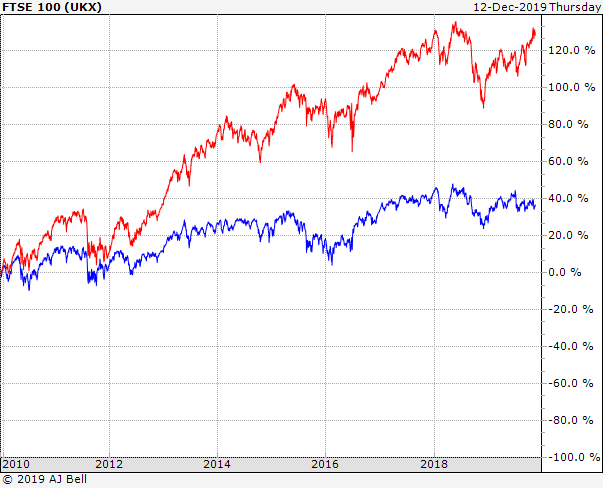
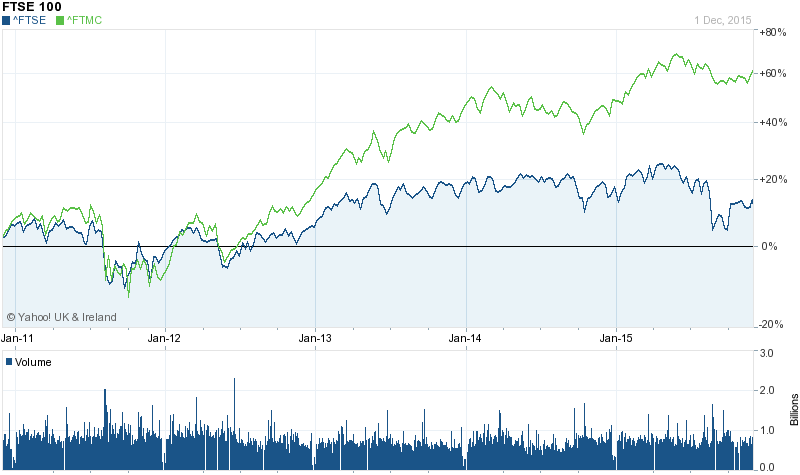
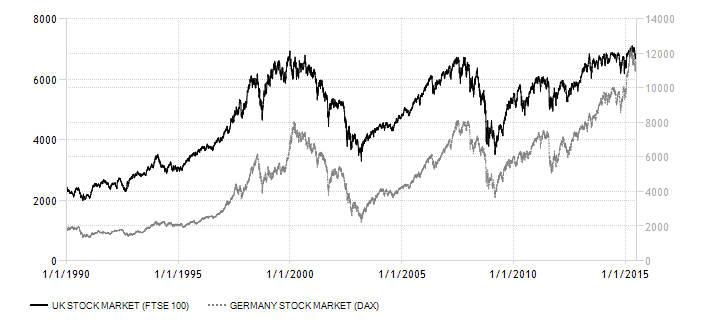
The chart below shows the relative performance of the FTSE100 vs Germany’s DAX40 since 1990. The German market (right hand scale) has increased from 2,000 to 12,000 whilst the UK market has risen from 2,000 to 7,000. Germany has been the clear winner of this race:-
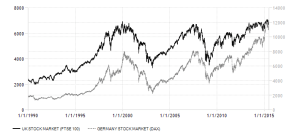
Source: Trading Economics
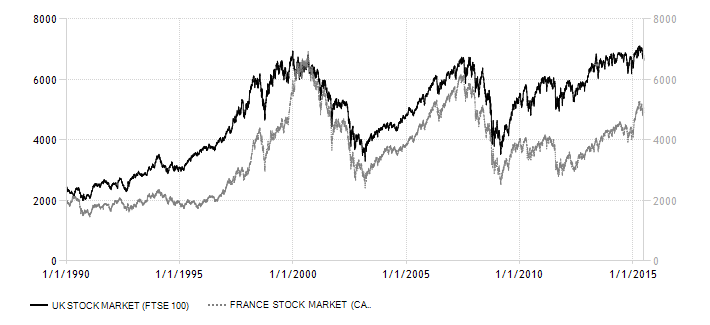
Would the UK stock market have fared better inside the EZ and would the UK departure from the EU be detrimental or positive to stock performance going forward? Here is the 1990-2015 comparison between FTSE100 and the French CAC40 index:-
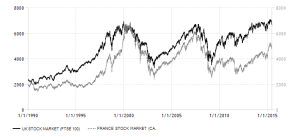
Source: Trading Economics
Germany appears to be something of an exception, France, Italy and the Netherlands have underperformed the UK during the same period: although Spain has delivered German-like returns. It is worth mentioning that Germany has run a balance of trade surplus for the entire period 1990 – 2015 whilst, excepting a brief period between 1991 and 1997, the UK has run a continuous trade deficit.
I don’t believe UK membership of the EU has much influence over the value of UK stocks in aggregate. Certain companies benefit from access to Europe, others are disadvantaged.
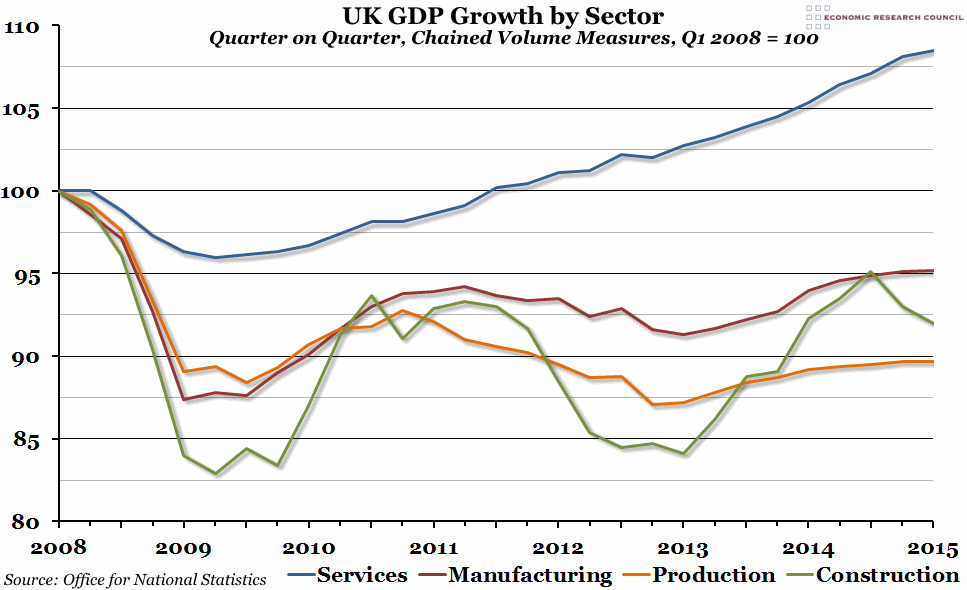
Unless the UK joins the EZ, currency fluctuations will continue whether they stay or go. Gilt yields will continue to reflect inflation expectations and estimates of credit worthiness; being outside the EU might impose greater fiscal discipline on subsequent UK governments – in this respect the benefits of EU membership seem minimal. The UK stock market will remain diverse and the success of UK stocks will be dependent on their individual businesses and the degree to which the regulatory environment is benign. The chart below shows UK GDP by sector since 2008. Services stand out both in terms of their resilience to the effects of the recession and continued growth in its aftermath, it is now 8.5% higher than before the recession, all the remaining sectors languish below their 2008 levels. Improving total factor productivity is key:-
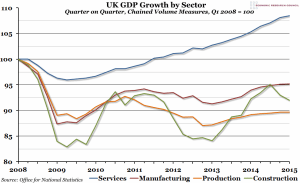
Source: ERC and ONS
Ahead of the referendum, uncertainty will lead to weakness in Sterling, higher Gilt yields and relative underperformance of UK stocks. If the UK electorate decide to remain in the EU there will be a relief rally before long-term trends resume. If the UK leaves the EU, Sterling will fall, inflation will rise, Gilt yields will rise in response and the FTSE will decline. GDP growth will slow somewhat, until an export led recovery kicks in as a result of the lower value of Sterling. The real cost to the UK is in policy uncertainty.
Longer term the demographic divergence between the UK and other countries of Europe will become evident. By 2060 the working age population of the UK is projected to increase from 37.8mln (2013) to 41.8mln whilst in Germany the same population will decline from 49.7mln to 35.4mln. The EC – Ageing Report 2015 – has more details. The UK can benefit from staying in the EU and continuously negotiating. However, it must become much more involved in the future of the EU project, including “ever closer union”. It can also benefit from “Brexit”, directly flattering the government’s bottom line. The worst of both worlds is to remain, as the UK has since 1950, sitting on the fence –decisiveness is good for financial markets and the wider economy.