Debasing the Baseless – Modern Monetary Theory

Debasing the Baseless – Modern Monetary Theory

In the Long Run - small colour logo

Macro Letter – No 114 – 10-05-2019

Debasing the Baseless – Modern Monetary Theory

  • Populist politicians are turning to Modern Monetary Theory
  • Fiscal stimulus has not led to significant inflation during the last decade
  • MMT is too radical to be adopted in full but the allure of fiscal expansion is great
  • Asset markets will benefit over the medium-term

A recent post from the Peterson Institute – Further Thinking on the Costs and Benefits of Deficits – follows on from the Presidential Lecture given by Olivier Blanchard at the annual gathering of the American Economic Association (AEA) Public Debt and Low Interest Rates . The article discusses a number of issues which are linked to Blanchard’s speech: –

  1. Is the political system so biased towards deficit increases that economists have a responsibility to overemphasize the cost of deficits?

  2. Do the changing economics of deficits mean that anything goes and we do not need to pay attention to fiscal constraints, as some have inferred from modern monetary theory (MMT)?

  3. You advocate doing no harm, but is that enough to stabilize the debt at a reasonable level?

  4. Isn’t action on the deficit urgent in order to reduce the risk of a fiscal crisis?

  5. Do you think anything about fiscal policy is urgent?

Their answers are 1. Sometimes, although they question whether it is the role of economists to lean against the political wind. 2. No, which is a relief to those of a more puritanical disposition towards debt. The authors’ argument, however, omits any discussion of the function of interest rates in an unfettered market, to act as a signal about the merit of an investment. When interest rates are manipulated, malinvestment flourishes. They propose: –

…that the political system should adopt a “do no harm” approach, paying for new proposals but not necessarily making it an urgent priority to do any more than that. Adopting this principle would have the benefit of requiring policymakers to think harder about whether to adopt the next seemingly popular tax credit or spending program. Many ideas that seem appealing judged against an unspecified future cost are less appealing when you make their costs explicit today.

  1. Yes. At this point the authors’ make the case for addressing the shortfalls in the social security and health budgets. They make the admirable suggestion that better provision is not only necessary but desirable, however, to achieve their goal they warn more will need to be contributed by individuals. Sadly, I expect politicians to cherry pick from the Modern Monetary Theory (MMT) menu, they will not champion the case for higher individual contributions. 4. No. Here I am in begrudging agreement with their conclusion, although I worry about their projections. Fiat currencies and artificially low interest rates underpin the current political system. It is hardly surprising that developed country government activity, as a share of GDP, has risen. 5. Yes. Again, I agree with the need to think about fiscal policy, though I anticipate that Peterson’s proposals are likely to exacerbate the current problems further.

A prelude to MMT

The reason for highlighting recent Peterson commentary is because it represents the acceptable face of a more dubious set of proposals, known collectively as MMT. These ideas are not particularly modern, beginning with the Chartalist tenet that countries which issue their own fiat currencies can never “run out of money.” For a measured introduction to this topic, Dylan Matthews has published a brilliant essay for Vox – Modern Monetary Theory, explained. Here are some of the highlights: –

[The starting point is]…endogenous money theory, that rejects the idea that there’s a supply of loanable funds out there that private businesses and governments compete over. Instead, they believe that loans by banks themselves create money in accordance with market demands for money, meaning there isn’t a firm trade-off between loaning to governments and loaning to businesses of a kind that forces interest rates to rise when governments borrow too much.

MMTers go beyond endogenous money theory, however, and argue that government should never have to default so long as it’s sovereign in its currency: that is, so long as it issues and controls the kind of money it taxes and spends. The US government, for instance, can’t go bankrupt because that would mean it ran out of dollars to pay creditors; but it can’t run out of dollars, because it is the only agency allowed to create dollars. It would be like a bowling alley running out of points to give players.

A consequence of this view, and of MMTers’ understanding of how the mechanics of government taxing and spending work, is that taxes and bonds do not and indeed cannot directly pay for spending. Instead, the government creates money whenever it spends…

And why does the government issue bonds? According to MMT, government-issued bonds aren’t strictly necessary. The US government could, instead of issuing $1 in Treasury bonds for every $1 in deficit spending, just create the money directly without issuing bonds.

The Mitchell/Wray/Watts MMT textbook argues that the purpose of these bond issuances is to prevent interest rates in the private economy from falling too low. When the government spends, they argue, that adds more money to private bank accounts and increases the amount of “reserves” (cash the bank has stocked away, not lent out) in the banking system. The reserves earn a very low interest rate, pushing down interest rates overall. If the Fed wants higher interest rates, it will sell Treasury bonds to banks. Those Treasury bonds earn higher interest than the reserves, pushing overall interest rates higher…

“In the long term,” they conclude, “the only sustainable position is for the private domestic sector to be in surplus.” As long as the US runs a current account deficit with other countries, that means the government budget has to be in deficit. It isn’t “crowding out” investment in the private sector, but enabling it.

The second (and more profound) aspect of MMT is that it proposes to reverse the roles of fiscal and monetary policy. Taxation is used to control aggregate demand (and thus inflation) whilst government spending (printing money) is used to prevent deflation and to stimulate consumption and employment. Since MMT advocates believe there is no need for bond issuance and that interest rates should reside, permanently, at zero, monetary policy can be controlled entirely by the treasury, making central banks superfluous.

At the heart of MMT is an accounting tautology, that: –

G − T = S – I

Where G = Government spending, T = Taxation, S = Savings and I = Investment

In other words…

Government Budget Deficit = Net Private Saving

wraybook

You may be getting the feeling that something does not quite tally. Robert Murphy of the Mises Institute – The Upside-Down World of MMT explains it like this (the emphasis is mine): –

When I first encountered such a claim — that the government budget deficit was necessary to allow for even the mathematical possibility of net private-sector saving — I knew something was fishy. For example, in my introductory textbook I devote Chapter 4 to “Robinson Crusoe” economics.

To explain the importance of saving and investment in a barter economy, I walk through a simple numerical example where Crusoe can gather ten coconuts per day with his bare hands. This is his “real income.” But to get ahead in life, Crusoe needs to save — to live below his means. Thus, for 25 days in a row, Crusoe gathers his ten coconuts per day as usual, but only eats eight of them. This allows him to accumulate a stockpile of 50 coconuts, which can serve as a ten-day buffer (on half-rations) should Crusoe become sick or injured.

Crusoe can do even better. He takes two days off from climbing trees and gathering coconuts (with his bare hands), in order to collect sticks and vines. Then he uses these natural resources to create a long pole that will greatly augment his labor in the future in terms of coconuts gathered per hour. This investment in the capital good was only possible because of Crusoe’s prior saving; he wouldn’t have been able to last two days without eating had he not been able to draw down on his stockpile of 50 coconuts.

This is an admittedly simple story, but it gets across the basic concepts of income, consumption, saving, investment, and economic growth. Now in this tale, I never had to posit a government running a budget deficit to make the story “work.” Crusoe is able to truly live below his means — to consume less than his income — and thereby channel resources into the production of more capital goods. This augments his future productivity, leading to a higher income (and hence consumption) in the future. There is no trick here, and Crusoe’s saving is indeed “net” in the sense that it is not counterbalanced by a consumption loan taken out by his neighbor Friday…

When MMTers speak of “net saving,” they don’t mean that people collectively save more than people collectively borrow. No, they mean people collectively save more than people collectively invest.

MMT goes on to solve the problem of achieving full employment by introducing a job guarantee and wage controls.

If, by this stage, you feel the need for an antidote to MMT, look no further than, Forty Centuries of Wage and Price Controls: How Not to Fight Inflation by Dr Eamon Butler of the ASI. Published in 1978, it documents the success of these types of policy during the past four thousand years.

Conclusion and Investment Opportunities

The radical ideas contained in MMT are unlikely to be adopted in full, but the idea that fiscal expansion is non-inflationary provides succour to profligate politicians of all stripes. Come the next hint of recession, central banks will embark on even more pronounced quantitative and qualitative easing, safe in the knowledge that, should they fail to reignite their economies, government mandated fiscal expansion will come to their aid. Long-term bond yields will head towards the zero-bound – some are there already. Debt to GDP ratios will no longer trouble finance ministers. If stocks decline, central banks will acquire them: and, in the process, the means of production. This will be justified as the provision of permanent capital. Bonds will rise, stocks will rise, real estate will rise. There will be no inflation, except in the price of assets.

John Mauldin describes the end-game of the debt-explosion as the Great Reset, but if government borrowing costs are zero (or lower) the Great Reset can be postponed, but the economy will suffer from low productivity growth due to malinvestment.

Global Real Estate – Has the tide begun to recede?

Global Real Estate – Has the tide begun to recede?

In the Long Run - small colour logo

Macro Letter – No 113 – 19-04-2019

Global Real Estate – Has the tide begun to recede?

  • Despite the fourth quarter shakeout in stocks, real estate values keep rising
  • Financial conditions remain key, especially in a low rate environment
  • Isolated instances of weakness have yet to breed contagion
  • The reversal of central bank tightening has averted a more widespread correction

I last wrote about the prospects for global real estate back in February 2018 in Macro Letter – No 90 – A warning knell from the housing market – inciting a riot? I concluded: –

The residential real estate market often reacts to a fall in the stock market with a lag. As commentators put it, ‘Main Street plays catch up with Wall Street.’ The Central Bank experiment with QE, however, makes housing more susceptible to, even, a small rise in interest rates. The price of Australian residential real estate is weakening but its commodity rich cousin, Canada, saw major cities price increases of 9.69% y/y in Q3 2017. The US market also remains buoyant, the S&P/Case-Shiller seasonally-adjusted national home price index rose by 3.83% over the same period: no sign of a Federal Reserve policy mistake so far.

As I said at the beginning of this article, all property investment is ‘local’, nonetheless, Australia, which has not suffered a recession for 26 years, might be a leading indicator. Contagion might seem unlikely, but it could incite a riot of risk-off sentiment to ripple around the globe.

More than a year later, central bank interest rates seem to have peaked (if indeed they increased at all) bond yields in most developed countries are falling again and, another round of QE is hotly anticipated, at the first hint of a global, or even regional, slowdown in growth.

In the midst of this sea-change from tightening to easing, an article from the IMF – Assessing the Risk of the Next Housing Bust – appeared earlier this month, in which the authors remind us that housing construction and related spending account for one sixth of US and European GDP. A boom and subsequent bust in house prices has been responsible for two thirds of recessions during the past few decades, nonetheless, they find that: –

…in most advanced economies in our sample, weighted by GDP, the odds of a big drop in inflation-adjusted house prices were lower at the end of 2017 than 10 years earlier but remained above the historical average. In emerging markets, by contrast, riskiness was higher in 2017 than on the eve of the global financial crisis. Nonetheless, downside risks to house prices remain elevated in more than 25 percent of these advanced economies and reached nearly 40 percent in emerging markets in our study.

The authors see a particular risk emanating from China’s Eastern provinces but overall they expect conditions to remain reasonably benign in the short-term. The January 2019 IMF – Global Housing Watch – presents the situation as at Q2 and Q3 2018: –

housepricesaroundtheworld IMF, BIS, ECB,Federal Reserve, Savills, Sinyl Real Estate

Source: IMF, BIS, Federal Reserve, ECB, Savills, Sinyl, National Data

Hong Kong continues to boom and Ireland to rebound.

They go on to analyse real credit growth: –

creditgrowth IMF, Haver Analytics

Source: IMF, Haver Analytics

Interestingly, for several European countries (including Ireland) credit conditions have been tightening, whilst Hong Kong’s price rises seem to be underpinned by credit growth.

Then the IMF compare house prices to average income: –

pricetoincome IMF, OECD

Source: IMF, OECD

Canada comes to the fore-front but Ireland is close second with New Zealand and Portugal not far behind.

Finally the authors assess House price/Rent ratios: –

pricetorent IMF, OECD

Source: IMF, OECD

Both Canada, Portugal and New Zealand are prominent as is Ireland.

This one year snap-shot disguises some lower term trends. The following chart from the September 2018 – UBS Global Real Estate Bubble Index puts the housing market into long-run perspective.

ubs-bubbles-index

Source: UBS

UBS go on to rank most expensive cities for residential real estate, pointing out that top end housing prices declined in half of the list:-

real-estate-bubbles list UBS

Source: UBS

Over the 12 months to September 2018 UBS note that house prices declined in Milan, Toronto, Zurich, New York, Geneva, London, Sydney and Stockholm. The chart below shows the one year change (light grey bar) and the five year change (dark grey line): –

housing-bubbles-growth-rates 1yr - 5yr change UBS

Source: UBS

Is a global correction coming or is property, as always, local? The answer? Local, but with several local markets still at risk.

The US market is generally robust. According to Peter Coy of Bloomberg – America Isn’t Building Enough New Housing – the effect of the housing collapse during the financial crisis still lingers, added to which zoning rules are exacerbating an already small pool of construction-ready lots. Non-credit factors are also corroborated by a recent Fannie Mae survey of housing lenders which found only 1% blaming tight credit, whilst 48% pointed to lack of supply.

North of the border, in Canada, the outlook has become less favourable, partly due to official intervention which began in 2017. Since 2012, house price increases in Toronto accelerated away from other cities, Vancouver followed with a late rush after 2015 and price increases only stalled in the last year.

In their February 2019 report Moody Analytics – 2019 Canada Housing Market Outlook: Slower, Steadier – identify the risks as follows: –

Interventions by the BoC, OSFI, and the British Columbia and Ontario governments were by no means a capricious attempt to deflate a house price bubble for the mere sake of deflation. Financial and macroeconomic aggregates point to the possibility that the mortgage credit needed to sustain house price appreciation may be unsustainable. Since 2002, the ratio of mortgage debt service payments to disposable income has gone from a historical low point of little more than 5% in 2003 to almost 6.6% by the end of last year…

The authors go on to highlight the danger of the overall debt burden, should interest rates rise, or should the Canadian economy slow, as it is expected to do next year. They expect the ratio of household interest payments to disposable income to rise and the percentage of mortgage arrears to follow a similar trajectory. In reality the rate of arrears is still forecast to reach only 0.3%, significantly below its historical average.

External factors could create the conditions for a protracted slump in Canadian real estate. Moody’s point to a Chinese real estate crash, a no-deal Brexit, renewed austerity in Europe and a continuation of the US/China trade dispute as potential catalysts. In this scenario 4% of mortgages would be in arrears. For the present, however, Canadian housing prices remain robust.

Switching to China, the CBRE – Greater China Real Estate Market Outlook 2019 – paints a mixed picture of commercial real estate in the year ahead: –

Office: U.S.–China trade conflict and the ensuing economic uncertainty are set to dent office demand in mainland China and Hong Kong. Leasing momentum in Taiwan will be less affected. Office rents will likely soften in oversupplied and trade and manufacturing-driven cities in 2019.

Retail: The amalgamation of online and offline will continue to drive the evolution of retail demand on the mainland. Retailers in Hong Kong and Taiwan will adopt a conservative approach towards expansion due to the diminishing wealth effect. Retail rents are projected to stay flat or grow slightly in most markets across Greater China.

Logistics: Tight land and warehouse supply will translate into steady logistics rental growth in the Greater Bay Area, Yangtze River Delta and Pan-Beijing area. Risks include potential weaker leasing demand stemming from the U.S.-China trade conflict and the gradual migration to self-built warehouses by major e-commerce companies.

The Chinese housing market, by contrast, has suffered from speculative over-supply. Estimates last year suggested that 22% of homes, amounting to around 50 million dwellings, are unoccupied. Government intervention has been evident for several years in an attempt to moderate price fluctuations. Earlier this month the National Development and Reform Commission (NDRC) said it aims to increase China’s urbanization rate by at least 1% with the aim of tackling the surfeit of supply. This is part of a longer-term goal to bring 100 million people into the cities over the five years to 2020. As of last year, 59.6% of China’s population lived in urban areas. According to World Bank data high middle income countries average 65% rising to 82% for high income countries. For China to reach the average high middle income average, another 70mln people need to move from rural to urban regions.

The new NDRC strategy will include the scrapping of restrictions on household registration permits for non-residents in cities of one to three million. For cities of three to five million, restrictions will be “comprehensively relaxed,” although the NDRC did not specify the particulars. Banks will be incentivised to provide credit and the agency also stated that it will support the establishing of real estate investment trusts (REITs) in order to promote a deepening of the residential rental market.

The NDRC action might seem unnecessary, average prices of new homes in the 70 largest Chinese cities rose 10.4% in February, up from 10.0% the previous month. This is the 46th straight monthly price increase and the strongest annual gain since May 2017. Critics point to cheap credit as the principal driver of this trend, they highlight the danger to domestic prices should the government decide to constrain credit growth. The key to maintaining prices is to open the market to foreign capital, this month’s NDRC policy announcement is a gradual step in that direction. It is estimated that at least $50bln of foreign capital will flow China over the next five years.

Despite the booming residential property market, the Chinese government has been tightening credit conditions and cracking down on illegal financial outflows. This has had impacted Australia in particular, investment fell more than 36% to $.8.2bln last year, down from $13bln in 2017. Mining investment fell 90%, while commercial real estate investment declined by 32%, to $3bln from $4.4bln the previous year. Investment in the US and Canada fell even more, declining by 83% and 47% respectively. Globally, however, Chinese investment has continued to grow, rising 4.2%.

Australian residential housing prices, especially in the major cities, have suffered from this downdraft. According to a report, released earlier this month by Core Logic – Falling Property Values Drags Household Wealth Lower – the decline in prices, the worst in more than two decades, is beginning to bite: –

According to the ABS (Australian Bureau of Statistics), total household assets were recorded at a value of $12.6 trillion at the end of 2018. Total household assets have fallen in value over both the September and December 2018 quarters taking household wealth -1.6% lower relative to June 2018. While the value of household assets have fallen by -1.6% over the past two quarters, liabilities have increased by 1.5% over the same period to reach $2.4 trillion. As a result of falling assets and rising liabilities, household net worth was recorded at $10.2 trillion, the lowest it has been since September 2017…

As at December 2018, household debt was 189.6% of disposable income, a record high and up from 188.7% the previous quarter. Housing debt was also a record high 140.2% of disposable income and had risen from 139.5% the previous quarter.

In 2018 the Australian Residential Property Price Index fell 5.1%, worst hit was Sydney, down 7.8% followed by Melbourne, off 6.4%, Darwin, down 3.5% and Perth, which has been in decline since 2015, which shed a further 2.5%. The ABS cited tightening credit conditions and reduced demand from investors and owner occupiers.

According to many commentators, Australian property has been ready to crash since the bursting of the tech bubble but, as this chart shows, prices are rich but not excessive: –

AMP Capital - Australian housing since 1926

Source: AMP Capital

Conclusions and Investment Opportunities

The entire second chapter of the IMF – Global Financial Stability Report – published on 10th April, focusses on housing: –

Large house price declines can adversely affect macroeconomic performance and financial stability, as seen during the global financial crisis of 2008 and other historical episodes. These macro-financial links arise from the many roles housing plays for households, small firms, and financial intermediaries, as a consumption good, long-term investment, store of wealth, and collateral for lending, among others. In this context, the rapid increase in house prices in many countries in recent years has raised some concerns about the possibility of a decline and its potential consequences…

Capital inflows seem to be associated with higher house prices in the short term and more downside risks to house prices in the medium term in advanced economies, which might justify capital flow management measures under some conditions. The aggregate analysis finds that a surge in capital inflows tends to increase downside risks to house prices in advanced economies, but the effects depend on the types of flows and may also be region- or city-specific. At the city level, case studies for Canada, China, and the United States find that flows of foreign direct investment are generally associated with lower future risks, whereas other capital inflows (largely corresponding to banking flows) or portfolio flows amplify downside risks to house prices in several cities or regions. Altogether, when nonresident buyers are a key risk for house prices, contributing to a systemic overvaluation that may subsequently result in higher downside risk, capital flow measures might help when other policy options are limited or timing is crucial. As in the case of macroprudential policies, these measures would not amount to targeting house prices but, instead, would be consistent with a risk management approach to policy. In any case, these conditions need to be assessed on a case-by-case basis, and any reduction in downside risks must be weighed against the direct and indirect benefits of free and unrestricted capital flows, including better smoothing of consumption, diversification of financial risks, and the development of the financial sector.

Aside from some corrections in certain cities (notably Vancouver, Toronto, Sydney and Melboune) prices continue to rise in most regions of the world, spurred on by historically low interest rates and generally benign credit conditions. As I said in last month’s Macro Letter – China in transition – From manufacturer to consumer – China will need to open its borders to foreign investment as its current account switches from surplus to deficit. Foreign capital will flow into Chinese property and, when domestic savings are permitted to exit the country, Chinese capital will support real estate elsewhere. The greatest macroeconomic risk to global housing markets stems from a tightening of financial conditions. Central banks appear determined to lean against the headwinds of a recession. In the long run they may fail but in the near-term the global housing market still looks unlikely to implode.

UK Financial Services – Opportunities and Threats Post-Brexit – Short-term Pain, Long-term Gain?

In the Long Run - small colour logo

Macro Letter – No 102 – 28-09-2018

UK Financial Services – Opportunities and Threats Post-Brexit – Short-term Pain, Long-term Gain?

  • A Brexit deal is still no closer, but trade will not cease even if the March deadline passes
  • In the short-term UK and EU economic growth will suffer
  • Medium-term new arrangements will hold back capital investment
  • Long-term, there are a host of opportunities, in time they will eclipse the threats

In a departure from the my usual format this Macro Letter is the transcript of a speech I gave earlier this week at the UK law firm, Collyer Bristow; Thomas Carlisle may have dubbed Economics ‘the dismal science,’ but I remain an optimist.

Setting aside the vexed question of whether Brexit will be hard, soft or stalled, the impact on financial services (and, indeed, the majority of UK trade in goods and services) will be dramatic.

Financial markets (and businesses in general) loathe uncertainty. Ever since the referendum result, investment decisions have been postponed or cancelled. When investment is being made it is generally tentative and defensive. Exporters and importers alike are striving to develop alternative strategies to maintain and protect their franchises.

As a long-term economic commentator, I try to look beyond the immediate impact of events, since near-term expectations are usually reflected in the valuation of an asset or currency. Brexit, however, is a particular challenge, not only due to near-term uncertainty but because policy decisions taken now and in the wake of the March 2019 deadline could set the UK economy on an unusually wide array of possible trajectories.

Near-term

To begin an analysis of the impact post-Brexit on financial services, there are several near-term threats; here are a selection: –

  1. House Prices

Earlier this month Mark Carney, the Governor of the Bank of England, warned cabinet ministers that a ‘no-deal’ on Brexit could see house prices decline by as much as one third and a rapid rise in defaults. The subsequent impact on financial institutions balance sheets and the inevitable curtailment of bank lending could be severe. Jacob Rees-Mogg even dubbed him, ‘The High Priest of Project Fear.’

  1. Passporting

Assuming no deal is agreed, the access which financial services providers in the UK have had to the EU27 will not be available after March 2019. Many existing contracts and licensing agreements will need to be rewritten.

  1. Regulatory equivalence

Divergence between the regulatory regime in the UK and Europe remains a distinct risk. The types of legal issues surrounding, for example, ISDA Master agreements (Deutsche Bank AG v Comune di Savona) will inevitably become more widespread.

  1. Systemic Risks to the Euro

The ECB is vocal in its mission to maintain control over the clearing and settlement of Euro denominated transactions. Many financial services activities which currently take place in the UK may need to be transferred to another EU country.

In the near-term, these types of factors will reduce trade and economic growth, both in the UK and, to a lesser degree, in Europe. In May 2017 I wrote an essay entitled ‘Hard Brexit Maths – Walking Away’ in which I estimated the negative impact a no-deal Brexit would have on the EU. The UK’s NIESR estimated the bill for a Hard Brexit to the UK at EUR66bln/annum. I guesstimated the cost of Hard Brexit to the EU at EUR 62bln/annum. Both forecasts will probably prove inaccurate.

The reduced free movement of workers from the EU is another significant factor. It will lead to a rise in a toxic combination of skill shortages (due to new immigration controls) and unemployment, as companies are forced to conserve capital to weather the inevitable economic slowdown.

There are, however, several near-term opportunities, here are a small selection: –

  1. Sterling weakness

The currency has already weakened. Whilst this may be inflationary it makes UK exports more competitive. Whether the UK can take advantage of currency weakness remains to be seen, history is not on our side in this respect.

  1. A US boom

Aided by a lavish tax cut, the US economy is growing faster than at any-time since the financial crisis, underpinning its currency. Its trade deficit is growing despite tariff barriers.

  1. US Trade policy

The Trump administration appears to have focused its ire on trade surplus countries, of which Germany is the largest European example. The UK is not under the White House microscope to the same degree.

Seizing the opportunity presented by these financial and geopolitical shifts is easier to speak of than to grasp. Nonetheless, just this month Absa Bank of South Africa (recently spun-off from Barclays) announced plans to open a London office to capitalise on post-Brexit opportunities connected with the fast-growing economies of Africa.

Medium-term

The medium-term risks will mostly be borne out of inertia. Until the shape of Brexit is clear, decisions will continue to be postponed. Once Brexit occurs there will be inevitable technical problems, stemming from systems issues and new procedures. Growth will slow further, business operating costs will need to be cut, employment in financial services (and elsewhere) will decline at exactly the moment when greater investment should be undertaken.

But, new trade deals will be negotiated, not just with Europe and the US, but also with the countries of the British Commonwealth, notably (but not just) India. Many of these countries are among the fastest growing economies in the world, often imbued with benign demographics. Here is a rapidly expanding working age population in need of capital investment and financial services. Ruth Lea, Chief Economist at Arbuthnot Latham has commentated on this subject at length during the last two years. In April she wrote: –

Commonwealth countries, taken together, have buoyant economic prospects and their share of global output continues to increase (especially in PPP terms). The EU28 share, in contrast continues to decline.

UK exports to the top eight Commonwealth countries rose by over 31% between 2006 and 2016, but total exports rose by 40%. And the share of UK exports going to the top eight Commonwealth countries fell from 7.5% in 2006 to 7.0% in 2016…

There is little doubt that Commonwealth countries have the potential to be significant growth markets for the UK’s exports, given their favourable growth prospects and demographics. This is all the more likely given the probability of trade deals with individual Commonwealth countries after Brexit.

Long-term

David Riccardo defined the law of comparative advantage just over two hundred years ago. Perhaps one of the best examples of the continuance of the phenomenon is Switzerland, which has seen its currency appreciate against the US$ by approximately 3% per year, every year since fiat currencies were freed from their shackles after the collapse of the Bretton Woods agreement in 1971. Here is a chart of the US$/CHF exchange rate over the period: –

USDCHF 1970 to 2018

Source: fxtop.com

The Swiss turned to pharmaceuticals and other value-added businesses. The success of this strategy, despite a constantly appreciating currency, has spawned an entire industrial region – the Rhone-Alp economic area, which incorporates German, French, Italian and Austrian companies bordering Switzerland. This region is among the most economically productive in the EU.

The UK has an opportunity, post-Brexit, to focus on economic growth. As a trading nation, we should concentrate our efforts on re-forging links with the fast-growing countries of the Commonwealth, where the advantages of a common language and legal system favour the UK over other developed nations.

An example of this opportunity is in education. We have a world class reputation for education and training. Combine this redoubtable capability with the abundance of new technologies, which permit the delivery of content globally via the internet, and we can provide the full gamut of instruction, ranging from primary to tertiary and professional via a combination of video content, on-line examination and tailored digital collateral.

A recent MOOC (Mass Open On-line Course) In which I enrolled, attracted students from across the world. The course was dedicated to finance and among the students with whom I interacted was a Masi tribesman from Kenya who hoped to develop micro-finance solutions for the local farming community. The world is our veritable oyster.

Conclusion – The Bigger Picture

The economies of the developed world are growing more slowly than those of developing nations. Providing goods and services to the fastest growing economies makes economic sense. Many of the largest companies listed on the UK stock market have been oriented to take advantage of this dynamic for decades. Brexit is proving to be cathartic, we should embrace change: the sooner the better.

The Austrian economist, Joseph Schumpter, described the cycle of economic development as including a period of ‘creative destruction’. Brexit could be an extreme version of this process. The patterns of trade which have developed since the end of WW2 have been concerned with promoting cohesion between European nations, but, as Hyman Minsky famously noted, ‘stability creates the seeds of instability.’ I believe the political polarisation seen in Europe and elsewhere is a reaction against the success of the global financial and economic system and the institutions and alliances created to insure its success. We are entering an era of change and Brexit is but one personification of a growing trend. Technology has shrunk the world, empowered the individual and (in the process) undermined the influence of nation states and international institutions. Individual freedom is ascendant but with freedom comes responsibility.

One of the greatest challenges facing the UK and other developed nations, in the long run, is the provision of pensions and health insurance to an increasingly ageing population. Many of the financial products required by these ageing consumers are ones in which the UK is a world leader. The developing world is rapidly growing richer too. Their citizens will require these self-same products and services. Brexit is an opportunity to look forward rather than back. If we embrace change we will thrive, if not change will occur regardless. Post-Brexit there will be considerably pain but, if we manage to learn from history, there can also be long-term gain.

A warning knell from the housing market – inciting a riot?

A warning knell from the housing market – inciting a riot?

In the Long Run - small colour logo

Macro Letter – No 90 – 02-02-2018

A warning knell from the housing market – inciting a riot?

  • Global residential real estate prices continue to rise but momentum is slowing
  • Prices in Russia continue to fall but Australian house prices look set to follow
  • After a decade of QE, real estate will be more sensitive to interest rate increases

As anyone who owns a house will tell you, all property markets are, ‘local.’ Location is key. Nonetheless, when looking for indicators of a change in sentiment with regard to asset prices in general, residential real estate lends support to equity bull markets. Whilst it usually follows the performance of the stock market, this time it may be a harbinger of austerity to come.

The most expensive real estate is to be found in areas of limited supply; as Mark Twain once quipped, when asked what asset one should invest in, he replied, ‘Buy land, they’re not making it anymore.’ Mega cities are a good example of this phenomenon. They are a sign of progress. As Ian Stewart of Deloittes put it in this week’s Monday Briefing – How distance survived the communication revolution:-

In 2014, for the first time, more of the world’s population, some 54%, lived in urban than rural areas. The UN forecasts this will rise to 66% by 2050. Businesses remain wedded to city locations. More of the UK’s top companies are headquartered in London than a generation ago. The lead that so-called mega cities, those with populations in excess of 10 million, such as Tokyo and Delhi, have over the rest of the country has increased.

Proximity matters, and for good reasons. Cities offer business a valuable shared pool of resources, particularly labour and infrastructure. Bringing large numbers of people and businesses together increase the chances of matching the right person with the right job. The scale of cities improves matching in other areas, from restaurants to education and the choice of a partner. Scale, in terms of the number of businesses, tend to stimulate competition and productivity.  Nor has technology fulfilled its promise to work equally well everywhere. By and large, technology tends to work better in urban areas than the country.

Urbanisation facilitates learning and the diffusion of knowledge, two vital processes for the modern economy. Workers in cities can more easily change jobs without changing homes, enabling the transfer of ideas across businesses. On-line learning has supplemented, but shows few signs of usurping the classroom, lecture theatre or face to face contact. Despite the collapsing cost of communication, competition for entry to the best schools and universities has intensified in the last three decades.

For all the transformative effects of the communication revolution the lead that cities have over the rest of the country seems to be widening. The LSE reports that in the UK workers in urban areas earn 8% more than those elsewhere; in London the premium is 24%. Buoyant property prices in major cities underscore the gap.

The world’s mega-cities have seen the highest house price inflation but at the national level the momentum of house price increases has begun to slow as prices approach the 2008 highs once more. The chart below, care of the IMF, shows the strength of momentum still increasing in Q2 2017:-

globalhousepriceindex

Source: IMF

By Q3 2017 Global Property Guide analysis suggested a sea-change had begun:-

During the year to the third quarter of 2017:

House prices rose in 24 out of the 46 world’s housing markets which have so far published housing statistics, using inflation-adjusted figures.

The more upbeat nominal figures, more familiar to the public, showed house price rises in 38 countries, and declines in 8 countries.

Upwards price momentum is weakening.

Europe, Canada, Hong Kong, and Macau continue to experience strong price rises.  But most of the Middle East, Latin America, New Zealand and some parts of Asia are experiencing either house price falls – or a sharp deceleration of house price rises.

The five strongest housing markets in our global house price survey for the third quarter of 2017 were: Iceland (+18.76%), Hong Kong (+13.14%), Macau (+10.53%), Canada (+9.69%), and Romania (+9.36%).

The biggest y-o-y house-price declines were in Egypt (-8.68%), Kiev, Ukraine (-6.81%), Russia (-6.69%), Mongolia (-5.7%), and Qatar (-2.85%).

Only 15 of the 46 markets analysed showed increased upward momentum. Hardly cause for concern, one might think; after all, during the nine year equity bull-market, stock momentum has waxed and waned. However, one market in particular (which, incidentally, is not covered by Global Property Guide analysis) has seen falling prices during the past quarter – Australia.

As the chart below shows, Australian house prices were among the fastest rising in Q2:-

housepricesaroundtheworld

Source: IMF

Sydney has been even more extreme:-

Sydney-house-price-cycle-nov-2-2017

Source: Core Logic

On the basis that, what goes up must, inevitably, come back down, one could argue that a price correction is needed, however, unlike the stock market, house prices have a much stronger impact on the spending habits of the consumer.

The consumer is impacted by the cost of financing mortgage borrowing and their ability to remortgage, relies on a steady increase in the value of housing stock. Rising bond yields, led by the US, where 10yr yields have broken through 2.62% to the upside this week, are likely to be a cause for concern. In Australia, however, fixed rate deals (where they exist) tend to be only two to three years in duration. The remainder of mortgages are variable rate. 1yr Australian bond yields are higher – touching 1.78% this month – but they are still only 40bp off their August 2016 lows.

Housing affordability is also a function of price to income and price to rent:-

pricetoincome

Source: IMF

Australia remains one of the most expensive places to buy a house, although their planning constrained neighbour New Zealand is even less affordable, which helps to explain the 1.24% fall in prices for Q3.

pricetorent

Source: IMF

Australia is not the most expensive market on a price to rent basis either, yet, despite relatively low interest rates (and rising commodity prices which have supported the currency) residential real estate prices have begun to decline. The table below shows the quarter on quarter and year on year price change for the five major cities as at 31st January:-

Australian_Cities_house_prices_31-1-2018_Core_Logi

Source: CoreLogic

The residential real estate market in Perth has been depressed for several years, but Sydney (led by high-end central Sydney apartments) has begun to follow its western neighbour.

Conclusions and Investment Opportunities

The residential real estate market often reacts to a fall in the stock market with a lag. As commentators put it, ‘Main Street plays catch up with Wall Street.’ The Central Bank experiment with QE, however, makes housing more susceptible to, even, a small rise in interest rates. The price of Australian residential real estate is weakening but its commodity rich cousin, Canada, saw major cities price increases of 9.69% y/y in Q3 2017. The US market also remains buoyant, the S&P/Case-Shiller seasonally-adjusted national home price index rose by 3.83% over the same period: no sign of a Federal Reserve policy mistake so far.

As I said at the beginning of this article, all property investment is ‘local’, nonetheless, Australia, which has not suffered a recession for 26 years, might be a leading indicator. Contagion might seem unlikely, but it could incite a riot of risk-off sentiment to ripple around the globe.

Global Real Estate and the end of QE – Is it time to be afraid?

Global Real Estate and the end of QE – Is it time to be afraid?

In the Long Run - small colour logo

Macro Letter – No 86 – 03-11-2017

Global Real Estate and the end of QE – Is it time to be afraid?

  • Rising interest rates and higher bond yields are here to stay
  • Real estate prices seem not to be affected by higher finance costs
  • Household debt continues to rise especially in advanced economies
  • Real estate supply remains constrained and demand continues to grow

During the past two months two of the world’s leading central banks have begun the process of unwinding or, at least, tapering the quantitative easing which was first initiated after the great financial recession of 2008/2009. The Federal Reserve FOMC statement for September and their Addendum to the Policy Normalization Principles and Plans from June contain the details of the US bank’s policy change. The ECB Monetary policy decision from last week explains the European position.

Whilst the Federal Reserve is reducing its balance sheet by allowing US treasury holdings to mature, the US government has already breached its debt ceiling and will need to issue new bonds. The pace of US money supply growth is unlikely to be reversed. Nonetheless, 10yr US bond yields have risen from a low of 1.35% in July 2016 to more than 2.6% earlier this year. They currently yield around 2.4%. Over the same period 2yr US bond yields have risen from 0.49% to a new high, this week, of 1.60% – their highest since October 2008.

Back in April I wrote about the anomaly in the US interest rate swaps market – US 30yr Swaps have yielded less than Treasuries since 2008 – does it matter? What is interesting to note, in relation to global real estate, is that the 10yr Swap spread over US Treasuries (which is currently negative) has remained stable at -8bp during the recent rise in yields. Normally as interest rates on government bonds declines credit spreads tighten – as rates rise these spreads widen. So far, this has not come to pass.

In the US, mortgages are, predominantly, long-term and fixed rate. US 30yr mortgage rates has also risen since July 2016 – from 2.09% to 3.18% at the end of December. Since then rates have moderated, they now stand at 2.89%, approximately 1% above US 30yr bonds. The chart below shows the spread since July 2016:-

30yr_Mortgage_-_Bond_Spread_July_2016_to_October_2

Source: Federal Reserve Bank of St Louis

Apart from the aberration during the US presidential elections the spread between 30yr US Treasuries and 30yr Mortgages has been steadily narrowing despite the tightening of short term interest rates and the increase in yields across the maturity spectrum.

Mortgage finance costs have increased since July 2016 but by less than 50bp. What impact has this had on real estate prices? The chart below shows the S&P Case-Shiller House Price Index since 2006, the increase in mortgage rates has failed to slow the rise in prices. The year on year increase is currently running at 5.6% and forecasters predict this rate to increase to 5.8% when September data is released:-

SandP_Shiller_Case_House_Price_Index_-_2006-2017_Q

Source: Federal Reserve Bank of St Louis, S&P Case-Shiller

At the global level house prices have not taken out their pre-crisis highs, as this chart from the IMF reveals:-

globalhousepriceindex_lg

Source: IMF, BIS, ECB, Federal Reserve, Savills

The latest IMF – Global Housing Watch – report for Q2 2017 is sanguine. They take comfort from the broad range of macroprudential measures which have been introduced during the past decade.

The IMF go on to examine house price increases on a country by country basis:-

housepricesaroundtheworld_lg

Source: IMF, BIS, ECB, Federal Reserve, Savills, Sinyl Real Estate

The OECD – Focus on house priceslooks at a variety of different metrics including changes in real house prices: the OECD average is more of less where it was in 2010 having dipped during 2011/2012 – here is breakdown across a selection of regions. Please note the charts are rather historic they stop at January 2014:-

OECD Real Estate charts 2010 -2014

Source: OECD

The continued fall in Japanese prices is not entirely surprising but the steady decline of the Euro area is significant.

Similarly historic data is contained in the chart below which ranks countries by Price to Income and Price to Rent. Portugal, Germany, South Korea and Japan remain inexpensive by these measures, whilst Belgium, New Zealand, Canada, Norway and Australia remain expensive. The UK market also appears inflated but the decline in Sterling may be a supportive factor: international capital is flowing into the UK after the devaluation:-

Real Estate P-E and P-R chart OECD

Source: OECD

Bringing the data up to date is the Knight Frank’s global house price index, for Q2 2017. The table below is sorted by real return:-

Real_Estate_Real_Return_Q2_2017_Knight_Frank

Source: Knight Frank, Trading Economics

There is a saying in the real estate market, ‘all property is local’. Prices vary from region to region, from street to street, however, the data above paints a picture of a global real estate market which has performed strongly in response to the lowering of interest rates. As the table below illustrates, the percentage of countries recording positive annual price changes is now at 89%, well above the levels of 2007, when interest rates were higher:-

Real_Estate_Price_Change_-_Knight_Frank

Source: Knight Frank

The low interest rate environment has stimulated a rise in household debt, especially in advanced economies. The IMF – Global Financial Stability Report October 2017 makes sombre reading:-

Although finance is generally believed to contribute to long-term economic growth, recent studies have shown that the growth benefits start declining when aggregate leverage is high. At business cycle frequencies, new empirical studies—as well as the recent experience from the global financial crisis—have shown that increases in private sector credit, including household debt, may raise the likelihood of a financial crisis and could lead to lower growth.

These two charts show the rising trend globally but the relatively undemanding levels of indebtedness typical of the Emerging Market countries:-

IMF_Household_Debt_to_GDP_ratios_-_Advanced_Econom

Source: IMF

IMF_Household_Debt_to_GDP_ratios_-_Emerging_Econom

Source: IMF

As long ago at February 2015 – McKinsey – Debt and (not too much) deleveraging – sounded the warning knell:-

Seven years after the bursting of a global credit bubble resulted in the worst financial crisis since the Great Depression, debt continues to grow. In fact, rather than reducing indebtedness, or deleveraging, all major economies today have higher levels of borrowing relative to GDP than they did in 2007. Global debt in these years has grown by $57 trillion, raising the ratio of debt to GDP by 17 percentage points.

According to the Institute of International Finance Q2 2017 global debt report – debt hit a new all-time high of $217 trln (327% of global GDP) with China leading the way:-

iif china debt to GDP

Source: IIF

Household debt is growing in China but from a relatively low base, it is as the IMF observe, the advanced economies where households are becoming addicted to low interest rates and cheap finance.

Conclusions and investment opportunities

Economist Global House prices

Source: The Economist

The chart above shows a few of the winners since 1980. The real estate market remains sanguine, trusting that the end of QE will be a gradual process. Although as a recent article by Frank Shostak – Can gradual interest rate tightening prevent shocks? reminds us, ‘…there is no such thing as “shock-free” monetary policy’:-

Can a gradual tightening prevent an economic bust?

Since monetary growth, whether expected or unexpected, gives rise to the redirection of real savings it means that any monetary tightening slows down this redirection. Various economic activities, which sprang-up on the back of strong monetary pumping, because of a tighter monetary stance get now less real funding. This in turn means that these activities are given less support and run the risk of being liquidated.  It is the liquidation of these activities what an economic bust is all about.

Obviously, then, the tighter monetary stance by the Fed must put pressure on various false activities, or various artificial forms of life. Hence, the tighter the Fed gets the slower the pace of redirection of real savings will be, which in turn means that more liquidation of various false activities will take place. In the words of Ludwig von Mises,

‘The boom brought about by the banks’ policy of extending credit must necessarily end sooner or later. Unless they are willing to let their policy completely destroy the monetary and credit system, the banks themselves must cut it short before the catastrophe occurs. The longer the period of credit expansion and the longer the banks delay in changing their policy, the worse will be the consequences of the malinvestments and of the inordinate speculation characterizing the boom; and as a result the longer will be the period of depression and the more uncertain the date of recovery and return to normal economic activity.’

Consequently, the view that the Fed can lift interest rates without any disruption doesn’t hold water. Obviously if the pool of real savings is still expanding then this may mitigate the severity of the bust. However, given the reckless monetary policies of the US central bank it is quite likely that the US economy may already has a stagnant or perhaps a declining pool of real savings. This in turn runs the risk of the US economy falling into a severe economic slump.

We can thus conclude that the popular view that gradual transparent monetary policies will allow the Fed to tighten its stance without any disruptions is based on erroneous ideas. There is no such thing as a “shock-free” monetary policy any more than a monetary expansion can ever be truly neutral to the market.

Regardless of policy transparency once a tighter monetary stance is introduced, it sets in motion an economic bust. The severity of the bust is conditioned by the length and magnitude of the previous loose monetary stance and the state of the pool of real savings.

If world stock markets catch a cold central banks will provide assistance – though not perhaps to the same degree as they did last time around. If, however, the real estate market begins to unravel the impact on consumption – and therefore on the real economy – will be much more dramatic. Central bankers will act in concert and with determination. If the problem is malinvestment due to artificially low interest rates, then further QE and a return to the zero bound will not cure the malady: but this discussion is for another time.

What does quantitative tightening – QT – mean for real estate? In many urban areas, the increasing price of real estate is a function of geography and the limitations of infrastructure. Shortages of supply are difficult (and in some cases impossible) to alleviate; it is unlikely, for example, that planning consent would be granted to develop Central Park in Manhattan or Hyde Park in London.

Higher interest rates and weakness in household earnings growth will temper the rise in property prices. If the markets run scared it may even lead to a brief correction. More likely, transactional activity will diminish. A price collapse to the degree we witnessed in 2008/2009 is unlikely to recur. Those markets which have risen most may exhibit a greater propensity to decline, but the combination of steady long term demand and supply constraints, will, if you’ll pardon the pun, underpin global real estate.

The Risks and Rewards of Asian Real Estate

400dpiLogo

Macro Letter – No 69 – 27-01-2017

The Risks and Rewards of Asian Real Estate

  • Shanghai house prices increased 26.5% in 2016
  • International investment in Asian Real Estate is forecast to grow 64% by 2020
  • Chinese and Indian Real Estate has underperformed US stocks since 2009
  • Economic and demographic growth is supportive Real Estate in several Asian countries

Donald Trump may have torn up the Trans-Pacific Partnership trade agreement, but the economic fortunes of Asia are unlikely to be severely dented. This week Blackstone Group – which at $102bln AUM is one of the largest Real Estate investors in the world – announced that they intend to raise $5bln for a second Asian Real Estate fund. Their first $5bln fund – Blackstone Real Estate Partners (BREP) Asia – which launched in 2014, is now 70% invested and generated a 17% return through September 2016. Blackstone’s new vehicle is expected to invest over the next 12 to 18 months across assets such as warehouses and shopping malls in China, India, South-East Asia and Australia.

Last year 22 Asia-focused property funds raised a total of $10.6bln. Recent research by Preqin estimates that $33bln of cash is currently waiting to be allocated by existing Real Estate managers.

Blackrock, which has $21bln in Real Estate assets, predicts the amount invested in Real Estate assets will grow by 75% in the five years to 2020. In their March 2016 Global Real Estate Review they estimated that Global REITs returned 10% over five years, 6% over 10 years and 11% over 15 years.

This year – following the lead of countries such as Australia, Japan and Singapore – India is due to introduce Real Estate Investment Trusts (REITs) they also plan to permit infrastructure investment trusts (InvITs). Other Asian markets have introduced REITs but not many have been successful in achieving adequate liquidity. India, however, has the seventh highest home ownership rate in the world (86.6%) which bodes well for potential REIT investment demand.

UK asset manager M&G, make an excellent case for Asian Real Estate, emphasis mine:-

Exposure to a diversified and maturing region which accounts for a third of the world’s economic output and offers a sustainable growth premium over the US and Europe.

Diversification benefits. An allocation to Asian real estate boosts risk-adjusted returns as part of a global property portfolio; plus there are diverse opportunities within Asia itself.

Defensive characteristics, with underlying occupier demand supported by robust economic fundamentals, as showcased by Asia’s resilience during the European and US downturns of the recent financial crisis.

What M&G omit to mention is that investing in Real Estate is unlike investing in stocks (Companies can change and evolve) or Bonds which exhibit significant homogeneity – Real Estate might be termed the ultimate Fixed AssetLocation is a critical part of any investment decision. Mark Twain may have said, “Buy land. They’re not making it anymore.” but unless the land has commercial utility it is technically worthless.

The most developed regions of Asia, such as Singapore, Hong Kong, Japan and Australia, offer similar transparency to North America and Europe. They will also benefit from the growth of emerging Asian economies together with the expansion of their own domestic middle-income population. However, some of these markets, such as China, have witnessed multi-year price increases. Where is the long-term value and how great is the risk of contagion, should the US and Europe suffer another economic crisis?

In 2013 the IMF estimated that the Asia-Pacific Region accounted for approximately 30% of global GDP, by this juncture the region’s Real Estate assets had reached $4.2trln, nearly one third of the global total. During the past decade the average GDP growth of the region has been 7.4% – more than twice the rate of the US or Europe.

The problem for investors in Asia-Pacific Real Estate is the heavy weighting, especially for REIT investors, to markets which are more highly correlated to global equity markets. The MSCI AC Asia Pacific Real Estate Index, for example, is a free float-adjusted market capitalization index that consists of large and mid-cap equity across five Developed Markets (Australia, Hong Kong, Japan, New Zealand and Singapore) and eight Emerging Markets (China, India, Indonesia, Korea, Malaysia, the Philippines, Taiwan and Thailand) however, the percentage weighting is heavily skewed to developed markets:-

Country Weight
Japan 32.94%
Hong Kong 26.40%
Australia 19.81%
China 9.62%
Singapore 6.30%
Other 4.93%

Source: MSCI

Here is how the Index performed relative to the boarder Asia-Pacific Equity Index and  ACWI, which is a close proxy for the MSCI World Index:-

msci_asian_real_estate_etf

Source: MSCI


The MSCI Real-Estate Index has outperformed since 2002 but it is more volatile and yet closely correlated to the Asia-Pacific Equity or the ACWI. The 2008-2009 decline was particularly brutal.

Under what conditions will Real Estate investments perform?

  • There are several supply and demand factors which drive Real Estate returns, this list is not exhaustive:-
  • Population growth – this may be due to internal demographic trends, such as higher birth rates, a rising working age population, inward migration or urbanisation.
  • Geographic constraints – lack of space drives prices higher.
  • Planning restrictions – limitations on development and redevelopment drive prices higher.
  • Economic growth – this can be at the country level or on a per-capita basis.
  • Economic policy – fiscal stimulus, in the form of infrastructure development, drives economic opportunity which in turn drives demand.
  • Monetary policy – interest rates – especially real-interest rates – and credit controls, drive demand: although supply may follow.
  • Taxation policy – transaction taxes directly impact liquidity – a decline in liquidity is detrimental to prices. Annual duties based on assessable value, directly reduce returns.
  • Legal framework – uncertain security of tenure and risk of curtailment or confiscation, reduces demand and prices.

The markets and countries which will offer lasting diversification benefits are those which exhibit strong economic growth and have low existing international investment in their Real Estate markets. The UN predicts that 380mln people will migrate to cities around the world in the next five years – 95mln in China alone. It is these metropoles, in growing economies, which should be the focus of investment. Since 1990, an estimated 470 new cities have been established in Asia, of which 393 were in China and India.

In their January 2017 update, the IMF – World Economic Outlook growth forecasts for Asian economies have been revised downwards, except for China:-

Country/Region 2017 Change
ASEAN* 4.90% -0.20%
India 7.20% -0.40%
China 6.50% 0.40%

*Indonesia, Malaysia, Philippines, Thailand, Vietnam

Source: IMF

The moderation of the Indian forecast is related to the negative consumption shock, induced by cash shortages and payment disruptions, associated with the recent currency note withdrawal. I am indebted to Focus Economics for allowing me to share their consensus forecast for February 2017. It is slightly lower for China (6.4%) and slightly higher for India (7.4%) suggesting that Indian growth will be less curtailed.

China and India

Research by Knight Frank and Sumitomo Mitsui from early 2016, indicates that the Prime Yield on Real Estate in Bengaluru was 10.5%, in Mumbai, 10% and 9.5% in Delhi. With lower official interest rates in China, yields in Beijing and Shanghai were a less tempting 6.3%. These yields remain attractive when compared to London and New York at 4%, Tokyo at 3.7% and Hong Kong 2.9%. They are also well above the rental yields for the broader residential Real Estate market – India 3.10% and China 3.20%: it’s yet another case of Location, Location, Location.

This brings us to three other risk factors which are especially pertinent for the international Real Estate investor: currency movements, capital flows and the correlation to US stocks.

Since the Chinese currency became tradable in the 1990’s it has been closely pegged to the value of the US$. After 2006 the currency was permitted to rise from USDCNY 8.3 to reach USDCNY 6.04 in 2014. Since then the direction of the Chinese currency has reversed, declining by around 15%.

This recent currency depreciation may be connected to the reversal in capital flows since Q4, 2014. Between 2000 and 2014 China saw $3.6trln of inflows, around 60% of which was Foreign Direct Investment (FDI). Since 2014 these flows have reversed, but the rate of outflow has been modest; the trickle may become a spate, if the new US administration continues to shoot from the hip. A move back to USDCNY 8.3 is not inconceivable:-

usdcny-1994-2017

Source: Trading Economics

Chinese inflation has averaged 3.86% since 1994, but since the GFC it has moderated to an annualised 2.38%.

The Indian Rupee, which has been freely exchangeable since 1993, has been considerably more volatile: and more inclined to decline. The chart below covers the period since January 2007:-

usdinr-10-yr

Source: Trading Economics

Since 1993 Indian inflation has averaged 7.29%, but since 2008 it has picked up to 8.65%. The sharp currency depreciation in 2013 saw inflation spike to nearly 11% – last year it averaged 5.22% helped, by declining oil prices. Official rates, which hit 8% in 2014, are back to 6.25%, bond yields have fallen in their wake. Barring an external shock, Indian inflation should trend lower.

Capital flows have had a more dramatic impact on India than China, due to the absence of Indian exchange controls. A February 2016 working paper from the World Bank – Capital Flows and Central Banking – The Indian Experience concludes:-

Going forward, under the new inflation targeting framework, monetary policy will likely respond even more than before to meet the inflation target and adjust less than before to the capital flow cycles. One concern some people have with the move of a developing country such as India to inflation targeting is that it could result in greater exchange rate flexibility. Having liberalized the capital account progressively over the last two and a half decades, the scope to use capital flow measures countercyclically has perhaps diminished as well.

Thus in years ahead, reserve management and macroprudential measures are likely to play a more significant role in helping respond to capital flow cycles, just as the policy makers and the economy develop greater tolerance for exchange rate adjustments.

The surge and sudden stop nature of international capital flows, to and from India, are likely to continue; the most recent episode (2013) is sobering – the Rupee declined by 28% against the US$ in just four months, between May and August. The Sensex Stock Index fell 10.3% over the same period. The stock Index subsequently rallied 72%, making a new all-time high in March 2015. Since March 2015 the Rupee has weakened by a further 10.3% versus the US$ and the stock market has declined by 7.7% – although the Sensex was considerably lower during the Emerging Market rout of Q1, 2016.

Stock market correlations are the next factor to investigate. The three year correlation between the S&P500 and China is 0.37 whilst for India it is 0.60. Since the Great Financial Crisis (GFC) however, the IMF has observed a marked increase in synchronicity between Asian markets and China. The IMF WP16/173 – China’s Growing Influence on Asian Financial Markets is insightful, the table below shows the rising correlation seen in Asian equity and bond markets:-

imf_china_correlation_rising_-_march_2016

Source: IMF

With so many variables, the best way to look at the relative merits, of China versus India and Real Estate versus Equities, is by translating their returns into US$. Since the GFC stock market low in March 2009, returns in US$ have been as follows. I have added the current dividend and residential rental yield:-

Index Performance – March 09 – December 16 Performance in US$ Current Yield
S&P500 207% 207% 2%
FHFA House Price Index (US) 9.70% 9.70% 2.20%
Shanghai Composite (China) 50% 49.20% 4.20%
Shanghai Second Hand House Price Index 74% 72.85% 3.20%
S&P BSE Sensex (India) 204% 135.25% 1.50%
National Housing Bank Index (India) 58%* 38.45% 3.10%
*Data to end Q1 2016

Source: Investing.com, FHFA, eHomeday, National Housing Bank, Global Property Guide

There are a number of weaknesses with this analysis. Firstly, it does not include reinvested income from dividends or rent – whilst the current yields are deceptively low. Data for the S&P500 suggests reinvested dividend income would have added a further 40% to the return over this period, however, I have been unable to obtain reliable data for the other markets. Secondly, the rental yield data is for residential property. You will note that Frank Knight estimate Prime Yields for Bengaluru at 10.5%, 10% for Mumbai and 9.5% for Delhi. Prime Yields in Beijing and Shanghai offer the investor 6.3% – Location, Location, Location.

The chart below shows the evolution of the Shanghai Second Hand House Price Index since 2003:-

china_-_ehomeday_-_shanghai_second_hand_house_pric

Source: eHomeday, Global Property Guide

For comparison here is the National Housing Bank Index since 2007:-

india_-_national_housing_bank_-_house_price_index

Source: National Housing Bank, Global Property Guide

Finally, for global comparison, this is the FHFA – House Price Index going back to 1991:-

us_-_federal_housing_finance_agency_-_house_price_

Source: FHFA, Global Property Guide

The Rest of Asia

In this Letter I have focused on China and India, but this article is about Asian Real Estate. The 2004-2014 annual return on Real Estate investment in Hong Kong was 14.4% – the market may have cooled but demand remains. Singapore has delivered 11.7% per annum over the same period. Cities such as Kuala Lumpur and Bangkok remain attractive. Vietnam, with a GDP forecast of 6.6% for 2017 and favourable demographics, offers significant potential – Hanoi and Ho Chi Minh are the cities on which to focus. Indonesia and the Philippines also offer economic and demographic potential, Jakarta and Manilla having obvious appeal. The table below, sorted by the Mortgage to Income ratio, compares the valuation for residential property and economic growth across the region:-

Country Price/Income Ratio Rental Yield City Price/Rent Ratio City Mortgage As % of Income GDP f/c 2017
Malaysia 9.53 4.07 24.6 72.87 4%
Taiwan 12.87 1.54 64.91 78.76 1.80%
South Korea 12.38 2.04 49.1 85.47 2.40%
India 10.28 3.08 32.44 123.44 7.40%
Singapore 21.63 2.75 36.41 134.33 1.60%
Pakistan 12.09 4.08 24.51 156.97 5.10%
Philippines 16.91 3.75 26.69 162.87 6.60%
Bangladesh 12.89 3.25 30.81 181.3 6.80%
China 23.29 2.23 44.83 189.71 6.40%
Mongolia 15.77 9.78 10.22 203.47 1.80%
Thailand 24.43 3.8 26.29 212.03 3.30%
Hong Kong 36.15 2.25 44.35 224.85 1.80%
Sri Lanka 17.49 4.91 20.38 238.64 4.80%
Indonesia 21.03 4.67 21.41 247.68 5.10%
Vietnam 26.76 4.52 22.1 285.55 6.60%
Cambodia 24.32 7.44 13.44 292.43 7%

Source: Numbeo, Focus Economics, Trading Economics

There are opportunities and contradictions which make it difficult to draw investment conclusions from the table above: and this is just a country by country analysis.

Conclusions and Investment Opportunities

Real Estate, more so than any of the other major asset classes, is individual asset specific. Since we are looking for diversification we need to evaluate the two types of collective vehicle available to the investor.

Investing via REITs exposes you to the volatility of the stock market as well as the underlying asset. Investing directly via unlisted funds has been the preferred choice of pension fund managers in the UK for many years. There are pros and cons to this approach, but, for diversification, this is likely to be the less correlated strategy. Make sure, however, that you understand the liquidity constraints, not just of the fund, but also of the constituents of the portfolio. The GFC was, in particular, a crisis of liquidity: and property is not a liquid investment.

Unsurprisingly Norway’s $894bln Sovereign Wealth Fund – Norges Bank Investment Management – invests in Real Estate for the long run. This is how they describe their approach to the asset class, emphasis mine:-

The fund invests for future generations. It has no short term liabilities and is not subject to rules that could require costly adjustments at inopportune times.

…Our goal is to build a global, but concentrated, real estate portfolio…The strategy is to invest in a limited number of major cities in key markets.

According to Institutional Real Estate Inc. the largest investment managers in the Asia-Pacific Region at 31st December 2014 were. I’m sure they will be happy to take your call:-

Investment Manager Asian AUM $Blns Total AUM $Blns
UBS Global Asset Management 9.33 64.89
Global Logistic Properties 9.26 20.14
CBRE Global Investors 8.56 91.27
LaSalle Investment Management 8.05 55.75
Blackstone Group 7.58 121.88
Alpha Investment Partners 7.48 8.70
Blackrock 7.32 22.92
Pramerica Real Estate Investors 6.84 59.17
Gaw Capital Partners 6.64 9.16
Prologis 6.08 29.98

Source: Institutional Real Estate Inc.

In their August 2016 H2, 2016 Outlook, UBS Global Asset Management made the following observations:-

Although property yields across the APAC region are at, or close to, historical lows, demand for real estate exposure in a multi-asset context is set to remain healthy in the near-to-medium term. Capital inflows into the asset class will continue to be supported by broad structural shifts across the region related to demographics and demand for income producing assets on the one hand, and (ex-ante) excess supply of private (household and/or corporate) sector savings on the other. Part of this excess savings will continue to find its way into real estate, both in APAC and in other regions…

Real Estate investment in Asia offers opportunity in the long run, but for markets such as Shanghai (+26.5% in 2016) the next year may see a return from the ether. India, by contrast, has stronger growth, stronger demographics, higher interest rates and an already weak currency. The currency may not offer protection, inflation is still relatively high and the Rupee has been falling for decades – nonetheless, Indian cities offer a compelling growth story for Real Estate investors. Other developing Asian countries may perform better still but they are likely to be less liquid and less transparent. The developed countries of the region offer greater transparency and liquidity but their returns are likely to be lower. A specialist portfolio manager offers the best solution for most investors – that’s assuming you’re not a Sovereign Wealth Fund.

Greece in or out – Investment Opportunities?

400dpiLogo

Macro Letter – No 34 – 24-04-2015

Greece in or out – Investment Opportunities?

  • Greece needs to reschedule its debt or default
  • Capital Controls maybe inevitable
  • A piecemeal solution is not the answer, yet it’s more likely than a “Lehman moment”
  • A definitive solution presents investment opportunities

Earlier this week I paid a visit to the Greek Island of Corfu. Whilst most of what we read and observe about the Greek economy revolves around Athens, I thought it would be useful to gain a broader perspective on the state of the economy. I wanted to consider, what things might be like, if Greece stays within the Eurozone (EZ) or, conversely, if they decide to leave.

Firstly a few Greek economic facts:-

Top of FormMarketsBottom of Form Last Date Frequency
GDP Annual Growth Rate 1.2% Nov-14 Quarterly
GDP per capita 18146 USD Dec-13 Yearly
Unemployment Rate 25.7% Jan-15 Monthly
Youth Unemployment Rate 51.2% Dec-14 Monthly
Population 10.99mln Dec-14 Yearly
Minimum Wages 684 Dec-14 Monthly
Inflation Rate -2.1% Mar-15 Monthly
Core Inflation Rate -1.2% Jan-15 Monthly
Producer Prices Change -4.8% Feb-15 Monthly
Balance of Trade -1,425mln Feb-15 Monthly
Exports 2,024mln Feb-15 Monthly
Imports 3,449mln Feb-15 Monthly
Current Account -850mln Jan-15 Monthly
Government Debt to GDP 175% Dec-13 Yearly
Government Spending to GDP 59.2% Dec-13 Yearly
Business Confidence 96.8 Mar-15 Monthly
Manufacturing PMI 48.9 Mar-15 Monthly
Industrial Production 1.9% Feb-15 Monthly
Manufacturing Production 5.8% Feb-15 Monthly
Capacity Utilization 65.7% Feb-15 Monthly
Industrial Production Mom -4.7% Jan-15 Monthly
Consumer Confidence -31 Mar-15 Monthly
Retail Sales YoY -0.1% Jan-15 Monthly
Housing Index -22% Feb-15 Monthly
Corporate Tax Rate 26% Jan-14 Yearly
Personal Income Tax Rate 46% Jan-14 Yearly
Sales Tax Rate 23% Jan-14 Yearly

Source: Trading Economics

Eurostat published their European Winter Economic forecasts 5th February – this is an extract from their, ever so rosy, forecast for Greece:-

Indicator 2013 2014 2015 2016
GDP growth (yoy) -3,9% 1,0% 2,5% 3,6%
Inflation (yoy) -0,9% -1,4% -0,3% 0,7%
Unemployment 27,5% 26,6% 25,0% 22,0%
Public budget balance to GDP -12,2% -2,5% 1,1% 1,6%
Gross public debt to GDP 174,9% 176,3% 170,2% 159,2%
Current account balance to GDP -2,3% -2,0% -1,5% -0,9%

Source: Eurostat

According to information collated from the CIA Factbook , OECD and Eurostat, the Greek public sector still accounts for 40% of GDP. The largest industry is Tourism (18%) followed by Shipping – the Hellenic Merchant Marine is the largest in the world employing 160,000 (4% of the workforce). The Greek shipping fleet is the fourth largest in the world, representing 15.17% of global deadweight tonnage in 2013, although “flag of convenience” issues can make these figures a little misleading. The labour force is estimated at 3.91mln of which immigrants account for 782,000 (20%). This makes Greece the 8th largest immigrant population in Europe – mainly unskilled or agricultural workers. As a result of the economic crisis private saving has increased from 11.2% in 2012 to 14.5% in 2014.

The largest broad industry sector is Services (which includes Tourism) accounting for 80.6% of GDP and 72.4% of employment, followed by Industry – 15.9% of GDP and 14.7% of employment. Agriculture is third in size producing 3.5% of GDP but employing 12.9% of the population.

Greece’s largest export market is Turkey (11.6%) and its largest import partner is Russia (14.1%). Little wonder they wish to maintain good relations with Moscow.

In terms of Tourism, Greece is the 7th most visited country in Europe and the 16th most visited globally. The latest figure I could unearth, from a 2008 OECD report, indicated 840,000 workers employed in the sector, from which I estimate that Tourism accounts for more than 20% of employment.

A more detailed analysis of the island economies of Greece came from a paper published by Sheffield University – A Comparative Analysis of the Economic Performance of Greek and British Small Islands – 2006. They analysed 63 islands with an average population of around 300,000. Employment was at 88.81% whilst Unemployed was a mere 11.19% – this was around the average for the whole country at that time. To my surprise, the level of reported self-employment was a relatively low 20.43%. One of the more puzzling figures was for Home Occupancy 46.05%; the Greek average for Home Ownership is 75.8% (2013). Unsurprisingly the main industry is Tourism followed by agriculture – it’s worth pointing out that Greece is the EU’s largest producer of Cotton, second largest producer of Rice and Olives, third largest producer of Tomatoes and fourth largest producer of Tobacco. It also accounts for 19% of all fish hauled from the Mediterranean, making it the third largest in the EU as of 2007 data.

The table below shows the regional breakdown of GDP by region for 2010:-

Region GDP Euro GDP % GDP Growth
Attica 106,635 48 -3.51
Northern Greece 55,163 24.83 -4.73
Central Greece 38,767 17.45 -3.03
Central Macedonia 30,087 13.54 -5.19
Aegean Islands and Crete 21,586 9.72 -4.84
Crete 10,955 4.93 -3.79
Thessaly 10,742 4.84 -6.55
West Greece 10,326 4.65 -2.9
Sterea Hellas 10,059 4.53 -1.25
Peloponnese 9,436 4.25 -3.97
East Macedonia and Thrace 9,054 4.08 -1.69
South Aegean 7,476 3.37 -5.4
West Macedonia 5,281 2.38 -3.3
Epirus 4,917 2.21 -2.36
Ionian Islands 4,029 1.81 -6.22
North Aegean 3,155 1.42 -7.04

Source: Eurostat

The islands are very much the “poor relation” in terms of economic output but, as the map below, from 2008, shows, the GDP per capita distribution is more dispersed:-

Greece_peripheries_GDP_per_capita_svg 2008 Eurostat

Source: Eurostat

I visited Corfu, the second largest island in the Ionian Sea, with a population of just over 100,000. Its main business is Tourism followed by the production of olives. Back in 2013 NCH Capital – a US investment firm, best known for their investments in agriculture in the Ukraine and Russia, agreed a deal with the Hellenic Republic Development Fund (HRDF) to build a tourist resort on the island. This was the first time the Greek state had sold land to a foreign investor for 15 years. The HRDF has been charged with raising Euro 11bln from asset sales by 2016 – this represents a small fraction of the assets available should the Hellenic Republic decide to cut and run.

The NCH investment is not moving forward as swiftly as they had hoped, as this article from Tax Law explains. It is worth pointing out that Corfu is located at the North West corner of Greece, its North East coast looking across the narrow straits to Albania; little wonder there is some concern about the reduction of a naval presence in the region. However, Albania became a full member of NATO in 2009. Since 2010 Albanians have been able to enter the EU without visas and, as of June 2014, they are officially a candidate to join the EU. As a result of these changes, property development is growing along with tourism. Prices for Albanian property are significantly lower than in neighbouring Montenegro, which in turn offer better value than Greece. Regardless of the fortunes of Albania, the prospects for a significant acceleration of Greek state asset disposals is likely, whether Greece leaves or remains within the EZ.

The residential Real Estate market is still depressed by the economic and political uncertainties of the last few years, but, from a rental perspective, tourists keep returning. The price of dining in restaurants is beginning to look attractive in comparison with other Southern European destinations; perhaps more importantly, the differential with prices in Turkey has narrowed. The cost of more expensive holiday homes in Greece is now comparable with those in Spain or Portugal – it used to command around a 40% premium due to planning restrictions. In 2013 the island of Skorpios sold to a Russian buyer for Eur100mln and the island of Oxia was purchased by a member of the Qatari Royal family for Eur 4.9mln, however, worries about a “Lehman moment” – by which I mean Grexit – have dampened enthusiasm for a number of subsequent deals.

If Greece leaves the EZ and the new currency promptly depreciates, there will still be a number of uncertainties. To begin with, the Greek government is likely to impose capital controls to prevent capital flight – Greek Prime Minister Alexis Tsipras has started the process, instructing local governments to move their funds to the central bank earlier this week. For non-domicile property owners, these controls could mean they are unable to repatriate the proceeds of sales. I was interested to notice how many restaurants no longer accept credit card payment; would you put the proceeds of a property sale into a Greek bank whilst waiting for capital controls to be relaxed?

Another factor which may delay a recovery in Real Estate is the reaction of non-EU nationals who have bought Greek property for more than Eur250,000, in order to gain EU status – a scheme also available in Portugal. This Greek Law Digest article explains.

Selling pressure on property prices will continue to come from Greek domestic investors downsizing of their rental portfolios. During the first few years of EZ membership, many Greeks bought multiple holiday rentals. Since the crisis, maintenance costs have soared as a result of the “haratsi” property tax. Meanwhile, the financial police are aggressively pursuing owners who fail to declare rental income. If Greece exits the EU, I would expect Real Estate supply to hang over the market for some while.

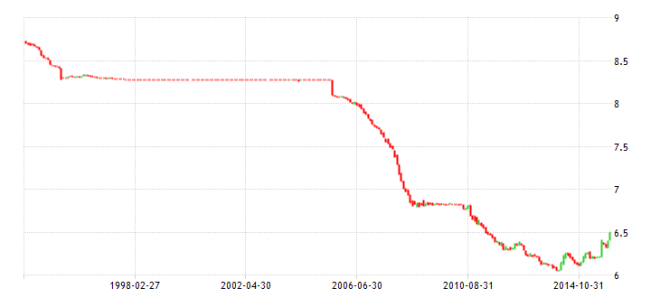
A perusal of the windows of Corfu Real Estate agents, whilst far from scientific, suggests that the price of holiday homes is still relatively high. The properties are normally foreign owned and, for the most part, the owners are not distressed sellers. I was struck, however, by the magnitude of the price reductions (up to 80%) on those properties which had “sold”. It feels like a market with low turnover where price discovery is intermittent at best. For the Greek market nationally residential property appraisals-transactions for 2014 were down 33.20% on 2013, dwelling permits fell by 19.3% between January to November 2014 compared to 2013 and total new floor space declined 13.9% y/y to November 2014. The chart below shows that the pace of decline has moderated in the last year but prices are still falling:-

Greek_House_Prices_1999_-2015

Source: Bank of Greece

The absolute level of the property index suggests that almost all the gains seen in Real Estate prices since joining the EZ have been reversed, but the economy is still not competitive due to the strait-jacket of the Euro:-

Greek_House_Price_index_-_1999-2015

Source: Bank of Greece

This article from The Guardian – Home ownership in Greece ‘a sick joke’ as property market collapses from February 2014, attempts to impart a flavour of the overall market, but, as any home owner knows, all property investment is local.

The year so far

To understand the Greek situation you need to go back to the eve of the introduction of the Euro, in 2000, but for a brief overview of the current crisis this excellent video from the Peterson Institute – Greece: An Economic Tragedy in Six Charts is well worth taking five minutes to peruse. Instead, I want to look at the last few months and consider the implications going forward.

As the Greek government begin further negotiations with EZ Finance Ministers today, in an attempt to reschedule their outstanding debt and interest rate payments, it is becoming clearer, to politicians in Brussels, that the “Greek Problem” will not be resolved by wishful thinking and continued austerity. Since January a new scene in this Greek tragedy has begun to unfold.

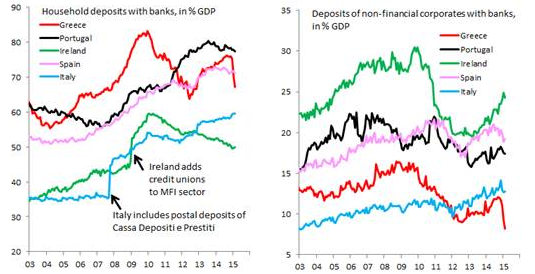
At the beginning of January Bruegal – Why Grexit would not help Greece – rebutted many commentators, but specifically the German IFO Institute’s call for Greece to leave the EZ. Bruegal focussed on the unique aspects of the Greek situation, pointing out that, unlike Portugal, Ireland and Spain, Greek imports had collapsed but their exports had only recently started to improve:-

Are high wages the main problem in Greece hampering exports? Is the absence of a real depreciation the main driver of the different adjustment experience of Greece compared to the other euro area countries?

…hourly wages have come down substantially in Greece and are in fact the lowest in the euro area with the exception of Latvia and Lithuania. This contrasts with the experience in the other three countries adjusting, where hourly wages in the private sector have increased.

Average Hourly Earnings - Eurostat

Source: Eurostat

Overall, I conclude that the Greek economy would not benefit as much as hoped for from a rapid depreciation. The reasons for the weak Greek export performance might primarily lie in other factors such as rigid product markets, a political system preventing real change and guaranteeing the benefits of the few, the lack of meritocracy among other factors…

This does not mean that the current debt trajectory and debt level is sustainable. It may be necessary to further alleviate the debt burden on Greece, especially if inflation remains low and growth is weaker than the Troika believes. This has been done a number of times before by the official creditors and already now the average maturity on the European debt is 30 years. This maturity could be increased if necessary, effectively reducing the debt burden further and I could even see a nominal debt cut at some stage.

Later in January Bruegal – How to reduce the Greek debt burden? Looked at the options available to Greece and her creditors:-

Option 1: Reducing the lending rate on the Greek Loan Facility

Option 2: Extending the maturity of the loans in the Greek Loan Facility

Option 3: Extending maturity of EFSF loans

Option 4: Buying-back the Greek government bond holdings of the ECB and National Central Banks

Option 5: Swapping the currently floating interest rate loans to fixed rate loans

Option 6: Swapping the current loans to GDP-indexed loans

Option 7: Pre-privatisation using European funds

The tone of quasi-official commentary changed in February, when the ECB ceased to accept Greek government bonds as collateral for normal refinancing operations. Bruegal – The Greek banking system: a tragedy in the making? finally acknowledged the ECBs obligation to “lend freely” but only “against good collateral”:-

One can criticize the ECB’s decision for aggravating the crisis but one can also argue that the ECB had no choice but to act as it did given the self-proclaimed insolvency of the Greek state.

Greek Finance Minister – Yanis Varoufakis – announced their new plan shortly after Syriza won the election. The FT – Greece finance minister reveals plan to end debt stand-off – 2nd February described it as:-

Attempting to sound an emollient note, Mr Varoufakis told the Financial Times the government would no longer call for a headline write-off of Greece’s €315bn foreign debt. Rather it would request a “menu of debt swaps” to ease the burden, including two types of new bonds.

The first type, indexed to nominal economic growth, would replace European rescue loans, and the second, which he termed “perpetual bonds”, would replace European Central Bank-owned Greek bonds.

He said his proposal for a debt swap would be a form of “smart debt engineering” that would avoid the need to use a term such as a debt “haircut”, politically unacceptable in Germany and other creditor countries because it sounds to taxpayers like an outright loss.

…“What I’ll say to our partners is that we are putting together a combination of a primary budget surplus and a reform agenda,”

…“I’ll say, ‘Help us to reform our country and give us some fiscal space to do this, otherwise we shall continue to suffocate and become a deformed rather than a reformed Greece’.”

After talks broke down later in February Bruegal – Europe needs a lasting solution for the Greek problem wrote:-

I expect that fear of Grexit will prompt an agreement between Greece and euro-area partners. But my concern is that the agreement will be only a short-term fix and the various constraints will prevent reaching a lasting solution, thereby just postponing the problems. That would be the next stage in the Greek tragedy, as debt sustainability problems would likely return in a few years.

The following two tables show the payment flashpoints on the Greek road to redemption:-

Greek T-Bill and Bond redemptions 2015

Source: Datastream

IMF Greek loan repayments 2015

Source: IMF

Early March saw the publication of the Greek State Budget Execution Monthly Bulletin the primary balance was only slightly below forecast, but closer inspection revealed that the majority of the improvement in the primary balance has been achieved by reducing expenditures. Revenues were Eur 7.8bln – around Eur 1bln below target. Without the benefit of currency devaluation, the broader Greek economy is still struggling to adjust.

A Closer look at the chances for a Greek recovery

The Greek government debt burden is unsustainable, in 2013 its Debt to GDP ratio was 174.9. According to Nationaldebtclocks.org the current figure is Eur 354bln. Greek 2014 GDP was $246bln (Eur189) and GDP for 2015 is estimated to be +0.7% (Eur 190bln) I assume a EURUSD 1.30 exchange rate so, perhaps, I’m painting an overly bleak picture. Official estimates put Greek government indebtedness at nearer to Eur 228bln.

Assume Greece manages to run a primary surplus of 3% in perpetuity – that equates to around Eur 5bln per annum. Assume they manage to negotiate zero interest on all their outstanding debt. It would take 70 years to repay – and 35 years to bring it back below 100% of current GDP. You may argue that 1. National Debt is the wrong measure, since Government Debt is the issue, but, if Greece leaves the EZ, creditors will need to consider all her obligations. 2. That it is unrealistic to assume no growth in GDP, but Greek GDP growth averaged 0.97% from 1996 to 2014, reaching an all-time high of 7.50% in the fourth quarter of 2003. It crashed to -9.9% in Q1 2011. Meanwhile Greek Inflation averaged 8.94% between 1960 and 2015. Recently deflation has set in, with prices falling to a record low of -2.90% in November of 2013.

These numbers don’t add up; either the creditor nations and institutions embrace substantial rescheduling and debt forgiveness, or Greece defaults, exits the EZ, devalues and potentially precipitates an EZ wide financial crisis. In PWC – Global Economy Watch – What would a Greek exit mean for the Eurozone? The authors estimate the impact of a Grexit on the rest of the EZ, Germany’s banking sector is most exposed (Eur29.5bln) although this still only amounts to 0.8% of GDP:-

Banking sector – Our analysis suggests that the Eurozone banking sector should be able to manage the impact of a Greek exit without severe consequences. The exposure of banks in the four largest Eurozone economies (Germany, France, Italy and Spain) to Greece has fallen from around $104bn in 2010 to $34bn. While the German banking system is the most exposed to Greece, this exposure equates to only around 0.8% of its GDP. For the other economies, France, Italy and Spain, the direct exposure of their banks to Greece is less than 0.1% of GDP.

Greek debt holders – around 60% of Greek government debt is held indirectly by Eurozone governments. If the Greek government defaults on its obligations, then that debt will be written off (at least in part). This could pose a risk to countries which already have a relatively large public debt burden. For example, a Greek exit could have negative implications for Italy, which guarantees around 20% of the Eurozone’s bailout funds, and has a ratio of gross government debt to GDP of around130%. Italy’s exposure to Greek government debt is equivalent to around 2% of its GDP meaning a default could lead to a fiscal squeeze in Italy as the government attempts to fill the hole left in its finances.

Unexpected contagion – A Greek exit could also have effects outside the realm of economic data and financial statistics. It would likely add to political uncertainty as other countries may push for concessions on their commitments or it could set a precedent that sees other countries leave the Eurozone. For example, Spain and Portugal are both experiencing double digit unemployment rates and must hold general elections by the end of 2015. While the domestic consequences of Greece leaving the Eurozone could deter voters in other countries from seeking to leave the single currency area, there remains a possibility of surprising developments occurring in the Eurozone. In addition to this, a Greek exit could also call Greece’s role in the European Union and NATO in to question, spurring even more uncertainty.

Of course, the largest creditors are EZ institutions, led by the ECB which holds Eur 104bln – 65% of Greek GDP, according to Governor Draghi.

By the end of March rumours were starting to circulate of Brussels preparing to impose capital controls in the event of the Greek government running out of money. The Peterson Institute – Can Greece Make a Deal with Europe? suggests a cut-off, but it’s still some way off:-

When Must a Deal Be Struck?

At the very latest, June/July 2015 would seem to be the deadline. At that point, Greece faces about €6.5 billion in euro bond repayments to the ECB, which it will not have the cash to honor without a new arrangement. A default against the ECB would end all liquidity provisions to Greek banks, including emergency liquidity assistance (ELA) from the Greek central bank. A quick economic death spiral would ensue.

According to an article this week the New York Times – European Central Bank Squeezes Greek Banks, Tightening Access to Loans the Greek banks have resorted to issuing bonds to themselves in order to access the ECBs ELA facility: –

For more than three months, Greece’s largest banks have been forced to borrow short-term, higher-interest money from their central bank — a process called emergency liquidity assistance — because the E.C.B. deemed it too risky to extend credit to the banks itself.

The banks, in turn, have to provide adequate collateral to obtain these loans, which now stand at 74 billion euros, $79.7 billion, or more than half the amount of Greek domestic deposits.

…Controversially, Greek banks have even begun to issue bonds to themselves and, after securing a government guarantee, have used the securities to secure short-term financing…

…On April 8, for example, the National Bank of Greece self-issued €4.1 billion of six-month bonds that carried state backing. 

Inevitable “Lehman”?

A number of commentators have been predicting a Greek exit for several years. This was the view expressed in February by David Stockman – History In The Balance: Why Greece Must Repudiate Its ‘Banker Bailout’ Debts And Exit The Euro:–

The true evil started with the bailouts themselves and the resulting usurpation by the EU politicians and apparatchiks of both financial market price discovery and discipline and sovereign democratic prerogatives.  Accordingly, the terms of Greece’s current servitude can’t be tweaked, “restructured” or “swapped” within the Brussels bailout framework.

Instead, Varoufakis must firmly brace his interlocutors on the true history and the condition precedent that stands before them. Namely, that the Greek state was effectively bankrupt even before the 2010 bailout, and that the massive amounts of debt piled upon it thereafter was essentially a fraudulent conveyance by the EU. 

Accordingly, Greece’s legitimate debt is perhaps $175 billion based on the pre-crisis euro debt outstanding at today’s exchange rate and the haircut that would have occurred in bankruptcy. Greece’s new government has every right to repudiate the vast amount beyond that because it arose not from the actions of the Greek people, but from the treachery of EU politicians and the Troika apparatchiks—-along with the unfaithful stooges in the Greek parliament and ministries which executed their fraudulent conveyance.

The Peterson Institute – Greece Should Ponder the Benefits of Devaluationpresents a couple of novel alternatives:-

There are two other mechanisms through which devaluation could occur, but both are more painful and less efficient than the currency (so called external) devaluation. One way is to simply reduce wages, thus achieving lower prices of domestically-produced goods and making them cheaper abroad. This is easier said than done. Wages are notoriously sticky, and even the wage cuts that Greece accepted have already brought protesters to the streets. Greece reduced wages of public-sector workers in 2010 and again in 2012 and endured months-long strikes. The new Syriza government has just started to undo these measures, with pledges to increase wages to precrisis levels.

The other mechanism to achieve internal devaluation is through tax policy—by reducing taxes on labor and increasing consumption taxes. Reducing taxes serves to reduce the overall cost of labor and hence production. It also encourages firms to look for other markets, as higher consumption prices at home reduce demand. Several European countries tried this, including Italy under Prime Minister Mario Monti in 2012—with some success.

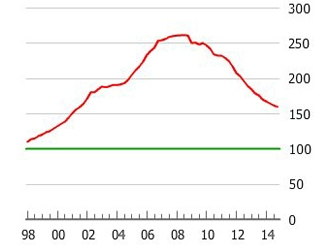
I remember discussing a “devaluation and re-joining” concept, with a hedge fund manager friend of mine back in 2010. “How would it work in practice, and what would happen to the bond holders?” were his perfectly valid responses. From the current vantage, five years on, that 20% devaluation would have been a small price for the bond holders to pay. Meanwhile Greek bank accounts are being siphoned of deposits as the crisis deepens, these charts from an article published by CFR -Greece—a Destabilizing Financial Squeezetell an alarming tale:-

EZ Bank deposits GS

Source: Goldman Sachs

It’s amazing that household deposits remain so high, but, with the majority of the Greek people wishing to remain in the Euro, perhaps this is logical.

The chart below shows the breakdown of the balance sheet of the Deutsche Bundesbank:-

Bundesbank_balance_sheet

Source: Soberlook.com

TARGET2 claims represent around 70% of the total – this is the loans of peripheral EZ national central banks. If “Grexit” leads to “Contagion” this half-trillion Euro accounting entry will start to crystallise – the hole in the Bundesbank balance sheet will have to be footed by the German tax payer.

Personally I still favour an EZ solution. Towards the end of February Michael Pettis – When do we decide that Europe must restructure much of its debt? Took up the theme, reminding us of the, less quoted, preamble to Mario Draghi’s “whatever it takes” speech:-

And this is clearly not just about Greece. Everyone understands that Greece has already restructured its debt once before and received partial forgiveness — in fact once coupon reductions are correctly accounted for Greece’s debt ratio is probably much lower than the roughly 180% of GDP the official numbers suggest. Most people also understand that the Greek debate is not just about Greece but also about whether or not several other countries — Spain, Portugal and Italy among them, and perhaps even France — will also have to restructure their debts with partial debt forgiveness.

What few people realize, however, is these countries have effectively already done so once. This happened two and a half years ago at the Global Investment Conference in London when, on July 26, 2012, Mario Draghi, President of the European Central Bank, made the following statement:

“When people talk about the fragility of the euro and the increasing fragility of the euro, and perhaps the crisis of the euro, very often non-euro area member states or leaders, underestimate the amount of political capital that is being invested in the euro. And so we view this, and I do not think we are unbiased observers, we think the euro is irreversible. And it’s not an empty word now, because I preceded saying exactly what actions have been made, are being made to make it irreversible.

“But there is another message I want to tell you. Within our mandate, the ECB is ready to do whatever it takes to preserve the euro. And believe me, it will be enough.”

Pettis puts the case for a Europe-wide debt resolution. He quotes from McKinsey – Debt and (not to much) deleveraging – but since “a picture paints a thousand words”:-

Debt since 2018 - McKinsey Haver Analytics

Source: Haver Analytics, McKinsey

As Pettis sees it, this is most certainly not about Greece in isolation:-

For now I would argue that the biggest constraint to the EU’s survival is debt. Economists are notoriously inept at understanding how balance sheets function in a dynamic system, and it is precisely for this reason that we haven’t put the resolution of the European debt crisis at the center of the debate. But Europe will not grow, the reforms will not “work”, and unemployment will not drop until the costs of the excessive debt burdens are addressed.

Conclusions and investment opportunities

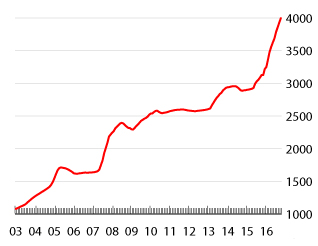
The yield on Greek 10yr government bonds has begun to rise again (see the monthly chart below) following the dramatic rise in shorter maturities – 2yr yields were at 28% on the open yesterday versus 10yr at 12.7%. This is a clear trend breakout but could be swiftly reversed by an EZ resolution of the current impasse:-

greece-government-bond-yield

Source: Trading Economics

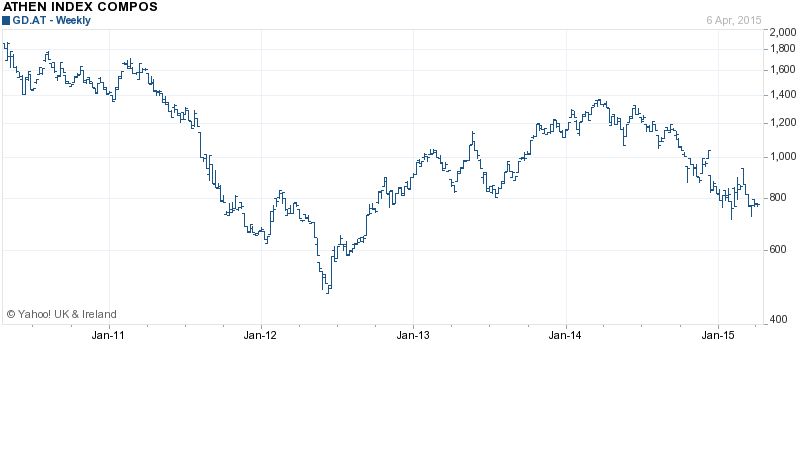
During the last year Greek stocks have trended lower losing more than 45% since the spring of 2014, yet they are still higher than during the teeth of the last storm that battered the EZ in 2012 when the index plumbed the depths of 471:-

Athhens Composite 5 yr

Source: Yahoo Finance

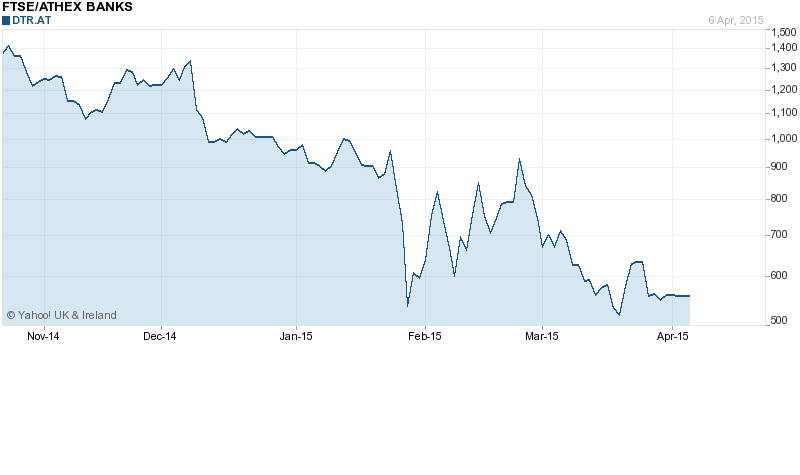
Perhaps of greater relevance, in light of the potential failure of the Greek banking system, is the Greek Bank Index. This, six month chart, highlights the degree to which the economy is being constrained by the spectre of bank defaults:-

FTSEAthex Banks index 6 months

Source: Yahoo Finance

The Greece will either remain mired in the morass of debt, successfully restructure or exit the Euro and default on its obligations. In the first scenario bonds will be rescheduled piecemeal but yields should return to single digits in 10yr maturities, reflecting the continued deflation risk associated with the over-hang of debt, the stock market will under-perform due to continued uncertainty and lack of investment but is unlikely to make fresh lows given the steady improvement in growth prospects for the rest of the EZ. Real Estate will continue to trend lower since the only buyers are likely to be domestic firms or individuals – the substantial inventory of domestic sellers will take a considerable time to clear, whilst net outward migration will increase the supply of Real Estate further. This chart shows the net changes in population since 1980:-

Net migration from Greece

Source: The Economist, Eurostat

In the second scenario, bond yields will trade in a range between high single digits and mid-teens, trading in a broadly similar way to scenario one, though, with less deflation risk, the yields are likely to be structurally higher. The stock market will clear and investment will return. House prices will recover as foreign buyers return and ex-patriot workers come home. Scenario three is the most cathartic. Bond yields will rise dramatically since there will no longer be a strong central bank and few businesses or institutions will be organised to exchange the replacement currency. The new currency will devalue and remain volatile, deterring investors from rushing to invest – once the currency stabilises, bond and equity markets will follow suit. High yield investors will be ready to invest in bonds, equity investors will look for businesses with comparative advantages due to their proximity to, and established trading links with, the EZ. Property will also gradually recover, especially in tourist destinations where “holiday homes” will suddenly become even more affordable for many EZ investors.

As I mentioned already, I think scenario two is most likely (45%) though we may have to wait until the “eleventh hour” to see it come to pass. Sadly scenario one is also quite likely (35%) since the EZ political apparatus seems incapable of addressing tough decisions head-on. This still leaves a 20% chance of a “Lehman moment”.

Prospects for the islands

As the paper from Sheffield University explains, island economies are relatively insulated from the external ebb and flow of the wider economy. Proximity to Athens is clearly a factor, but the performance of Crete is a typical example of the localised nature of these economic units. Corfu is only 30 miles from the heel of Italy and its Venetian architecture is testament to these links. The islands are most reliant on Tourism and, despite the crisis and the rioting in Athens, tourists keep coming back to these beautiful, welcoming islands. Not unlike Greece’s second industry – Shipping – Tourism is an international business; it is not held hostage to the fortunes of the hapless Greek political elite.

German resurgence – Which asset? Stocks, Bunds or Real Estate

400dpiLogo

Macro Letter – No 32 – 20-03-2015

German resurgence – Which asset? Stocks, Bunds or Real Estate

  • German domestic consumption is driving GDP growth as wages rise
  • The effect of a weaker Euro has yet to be seen in exports
  • Lower energy prices are beginning to boost corporate margins
  • Bund yields are now negative out to seven years

Last month Eurostat released German GDP data for Q 2014 at +0.7%, this was well above consensus forecasts of +0.3% and heralded a surge in the DAX stock index. For the year German growth was +1.6% this compares favourably to France which managed an anaemic +0.4% for the same period. German growth forecasts are being, feverishly, revised higher. Here is the latest data as polled by the BDA – revisions are highlighted in bold:-

Institution Survey Date 2015 Previous 2015 2016
ifo ifo Institute (Munich) Dec-14 N/A 1.5  
IfW Kiel Institute Mar-15 1.7 1.8 2
HWWI Hamburg Institute Mar-15 1.3 1.9 1.7
RWI Rheinisch-Westf. Institute (Essen) Dec-14 N/A 1.5  
IWH Institute (Halle) Dec-14 N/A 1.3 1.6
DIW German Institute (Berlin) Dec-14 N/A 1.4 1.7
IMK Macroeconomic Policy Institute (Düsseldorf) Dec-14 N/A 1.6  
Research Institutes Joint Economic Forecast Autumn 2014 Oct-14 N/A 1.2  
Council of experts Annual Report 2014/2015 Nov-14 N/A 1  
Federal Government Annual Economic Report 2015 Jan-15 1.3 1.5  
Bundesbank Forecast (Frankfurt) Dec-14 N/A 1 1.6
IW Köln IW Forecast Sep-14 N/A 1.5  
DIHK German Chambers of Industry and Commerce (Berlin) Feb-15 N/A 0.8 1.3
OECD Nov-14 N/A 1.1 1.8
EU Commission Feb-15 1.1 1.5 2
IMF Oct-14 N/A 1.5 1.8


Source: Confederation of German Employers’ Associations (BDA), Survey Date: March 13, 2015

The improvement in German growth has been principally due to increases in construction spending, machinery orders and, more significantly, domestic consumption, which rose 0.8% for the second successive quarter. This, rather than a resurgence in export growth, due to the decline in the Euro, appears to be the essence of the recovery. That the Euro has continued to fall, thanks to ECB QE and political uncertainty surrounding Greece, has yet to show up in the export data:-

germany-exports 2008-2015

Source: Trading Economics

German imports have also remained stable:-

germany-imports 2008-2015

Source: Trading Economics

This may seem surprising given the extent of the fall in the price of crude oil – it made new lows this week. German Natural Gas prices, which had been moderately elevated to around $10.4/btu during the autumn have fallen to $9.29/btu, a level last seen in early 2011. That the improved energy input has not shown up in the terms of trade data may be explained by the fact that crude oil and natural gas imports account for only 10% of total German imports. Nonetheless, I suspect the benevolent impact of lower energy prices is being delayed by the effects of long-term energy contracts running off. Watch for the February PPI data due out this morning (forecast -1.9% y/y).

The ZEW Institute – Indicator of Economic Sentiment – released on Tuesday, showed a fifth consecutive increase, hitting the highest level since February 2014 at 54.8 – the forecast, however, was a somewhat higher 58.2. This is an extract from their press release:-

“Economic sentiment in Germany remains at a high level. In particular, the continuing positive development of the domestic economy confirms the expectations of the experts. At the same time, limited progress is being made with regard to solving the Ukraine conflict and the sovereign debt crisis in Greece. This has a dampening effect on sentiment,” says ZEW President Professor Clemens Fuest. The assessment of the current situation in Germany has improved notably. Increasing by 9.6 points, the index now stands at 55.1 points.

The good news is not entirely unalloyed (pardon the pun) IG Metall – the German metal workers union which sets the benchmark for other union negotiations – achieved a +3.4% wage increase for their 800,000 members in Baden Württemberg, starting next month. Meanwhile, German CPI came in at 0.09% in February after falling -0.4% in January. This real-wage increase is an indication of the tightness of the broader labour market. Nationally wages are rising at a more modest 1.3%, this is, however, the highest in 20 years. German unemployment fell to 4.8% in January, the lowest in 33years, despite the introduction of a minimum wage of Eur8.50/hour, for the first time, on 1st January.

One of my other concerns for Germany is the declining trend of productivity growth. Whilst employment has been growing, the pace of productivity growth has not. This 2013 paper from Allianz – Low Productivity Growth in Germany examines the issue in detail, here is the abstract:-

Since the labor market reforms implemented in the first half of the last decade, Germany’s labor market has been on a marked upward trend. In 2012, there were 2.6 million (+6.8%) more people in work than in 2005 and the volume of labor was up by 2.4 million hours (+4.3%) on 2005. But the focus on this economic success, which has also earned Germany a great deal of recognition on the international stage, makes it easy to overlook the fact that productivity growth in the German economy has continued to slacken. Whereas the increase in labor productivity per person in work was still averaging 1.0% a year between 1995 and 2005, the average annual increase in the period between 2005 and 2012 was only 0.5%. The slowdown in the pace of labor productivity growth, measured per hour worked, is even more pronounced. The average growth rate of 1.6% between 1995 and 2005 had slipped back to 0.9% between 2005 and 2012.

Allianz go on to make an important observation about the importance of capital investment:-

…the capital factor is now making much less of a contribution to economic growth in Germany than in the past, thus also putting a damper on labor productivity growth.

… Since the bulk of the labor market reforms came into force – in 2005 – the German economy has been growing at an average rate of 1.5% a year. Based on the growth accounting process, the capital stock delivered a growth contribution of 0.4 percentage points, with the volume of labor also contributing 0.4 percentage points. This means that total factor productivity contribute 0.7 percentage points to growth. So if the volume of labor and capital stock were to stagnate, Germany could only expect to achieve economic growth to the tune of 0.7% a year.

Although gross domestic product also grew by 1.5% on average during that period, labor productivity growth came in at 2.0%, more than twice as high as the growth rate for the 2005 – 2012 period. Between 1992 and 2001, the contribution to growth made by the capital stock, namely 0.9 percentage points, was much greater than that made in the period from 2005 to 2012; by contrast, the growth contribution delivered by the volume of labor was actually negative in the former period, at -0.4 percentage points, and 0.8 percentage points lower than between 2005 and 2012. This could allow us to draw the conclusion that the labor market reforms boosted economic growth by 0.8 percentage points a year. Although there is no doubt that this conclusion is something of a simplification, the sheer extent of the difference supports the theory that the labor market reforms had a marked positive impact on growth. In the period between 1992 and 2001, total factor productivity contributed 1.0 percentage points to growth, 0.3 percentage points more than between 2005 and 2012. This tends to suggest that the growth contribution delivered by technical progress is slightly on the wane.

The finding that the weaker productivity growth in Germany is due, to a considerable extent, to the insufficient expansion of the capital stock and, consequently, to excessive restraint in terms of investment activity, suggests that there is a widespread cause, and one that is not specific to Germany, that is putting a stranglehold on the German productivity trend.

The hope remains, however, that especially Germany – a country that has managed to get to grips with the crisis fairly well in an international comparison – will be able to return to more dynamic investment activity as soon as possible.  

The issue of under-investment is not unique to Germany and is, I believe, a by-product of quantitative easing. Interest rates are at negative real levels in a number of countries. This encourages equity investment but, simultaneously, discourages companies from investing for fear that demand for their products will decline once interest rates normalise. Instead, corporates increase dividends and buy back their own stock. European dividends grew 12.3% in 2014 although German dividend growth slowed – perhaps another sign of a return to capital investment.

German Bunds

Bunds made new highs again last week. The 10 year yield reached 19 bp. Currently, Bunds up to seven years to maturity are trading at negative yields. These were the prices on Wednesday after then 10 year Bund auction:-

Maturity Yield
1-Year -0.18
2-Year -0.225
3-Year -0.202
4-Year -0.173
5-Year -0.099
6-Year -0.065
7-Year -0.025
8-Year 0.053
9-Year 0.127
10Y 0.212
15-Year 0.38
20-Year 0.519
30-Year 0.626


Source: Investing.com

Wednesday’s 10 year auction came in at 0.25% with a cover ratio of 2.4 times, demand is still strong. The five year Bobl auction, held on 25th February, came with a negative 0.08% yield for the first time. Negative yields are becoming common-place but their implications are not clearly understood as this article from Bruegal – The below-zero lower bound explains – the emphasis is mine):-

The negative yields observed on some government and corporate bonds, as well as the recent move into further negative territory of monetary policy rates, are shaking our understanding of the ZLB constraint.

Matthew Yglesias writes… Interest rates on a range of debt — mostly government bonds from countries like Denmark, Switzerland, and Germany but also corporate bonds from Nestlé and, briefly, Shell — have gone negative.

Evan Soltas writes… economists had believed that it was effectively impossible for nominal interest rates to fall below zero. Hence the idea of the “zero lower bound.” Well, so much for that theory. Interest rates are going negative all around the world. And not by small amounts, either. $1.9 trillion dollars of European debt now carries negative nominal yields,

Gavyn Davies writes… the Swiss and Danish central banks are testing where the effective lower bound on interest rates really lies. Denmark and Switzerland are clearly both special cases, because they have been subject to enormous upward pressure on their exchange rates. However, if they prove that central banks can force short term interest rates deep into negative territory, this would challenge the almost universal belief among economists that interest rates are subject to a ZLB.

JP Koning writes that there are a number of carrying costs on cash holdings, including storage fees, insurance, handling, and transportation costs. This means that a central bank can safely reduce interest rates a few dozen basis points below zero before flight into cash begins. The lower bound isn’t a zero bound, but a -0.5% bound (or thereabouts).

Evan Soltas writes that if people aren’t converting deposits to currency, one explanation is that it’s just expensive to carry or to store any significant amount of it… How much is that convenience worth? It seems like a hard question, but we have a decent proxy for that: credit card fees, counting both those to merchants and to cardholders… The data here suggest a conservative estimate is 2 percent annually.

Barclays writes… Coincidentally, the ECB has calculated that the social welfare value of transactions is 2.3%.

Brad Delong writes…In the late 19th century, the German economist Silvio Gesell argued for a tax on holding money. He was concerned that during times of financial stress, people hoard money rather than lend it.

Whilst none of these authors definitively tell us how negative is too negative, it is clear that negative rates may have substantially further to go. The only real deterrent is the negative cost of carry, which is likely to make price fluctuations more volatile.

German Stocks

Traditionally Germany was the preserve of the bond investor. Stocks have become increasingly popular with younger investors and those who need yield. Corporate bonds used to be an alternative but even these issues are heading towards a zero yield. I have argued for many years that a well-run company, whilst limited by liability, may be less likely to default or reschedule their debt than a profligate government. Even today, corporates offer a higher yield – the only major concern for an investor is the liquidity of the secondary market.

Nonetheless, with corporate yields fast converging on government bonds, stocks become the “least worst” liquid investment, since they should be supported at the zero-bound – I assume companies will not start charging investors to hold their shares. Putting it in finance terms; whereas we have been inclined to think of stocks as “growth” perpetuities, at the “less-than-zero-bound”, even a “non-growth” perpetuity looks good when compared to the negative yield on dated debt. We certainly live in interesting, or perhaps I should say “uninteresting” times.

A different case for investing in stocks is the potential restructuring risk inherent throughout the Eurozone (EZ). Michael Pettis – When do we decide that Europe must restructure much of its debt? Is illuminating on this issue:-

It is hard to watch the Greek drama unfold without a sense of foreboding. If it is possible for the Greek economy partially to revive in spite of its tremendous debt burden, with a lot of hard work and even more good luck we can posit scenarios that don’t involve a painful social and political breakdown, but I am pretty convinced that the Greek balance sheet itself makes growth all but impossible for many more years.

while German institutions and policymakers are as responsible as those in peripheral Europe for the debt crisis, in fact it was German and peripheral European workers who ultimately bear the cost of the distortions, and it will be German households who will pay to clean up German banks as, one after another, the debts of peripheral European countries are explicitly or implicitly written down.

In many countries in Europe there is tremendous uncertainty about how debt is going to be resolved. This uncertainty has an economic cost, and the cost only grows over time. But because most policymakers stubbornly refuse to consider what seems to have become obvious to most Europeans, there is a very good chance that Europe is going to repeat the history of most debt crises.

For now I would argue that the biggest constraint to the EU’s survival is debt. Economists are notoriously inept at understanding how balance sheets function in a dynamic system, and it is precisely for this reason that we haven’t put the resolution of the European debt crisis at the center of the debate. But Europe will not grow, the reforms will not “work”, and unemployment will not drop until the costs of the excessive debt burdens are addressed.

If Pettis is even half-right, the restructuring of non-performing EZ debt will be a dislocating process during which EZ government bond yields will vacillate wildly. If the German government ends up footing the bill for the lion’s share of Greek debt, rather than letting its banking system default, then stocks might become an accidental “safe-haven” but I think it more likely that rising Bund yields will precipitate a decline in German stocks.

Here is how the DAX Index has reacted to the heady cocktail of ECB QE, a falling Euro and a deferral of the Greek dilemma:-

DAX Jan 1998 - March 2015 Monthly

Source: Barchart.com

The DAX has more than doubled since the dark days of 2011 when the ECB saved the day with rhetoric rather than real accommodation. From a technical perspective we might have another 1,500 points to climb even from these ethereal heights – I am taking the double top of 2000 and 2007 together with the 2003 low and extrapolating a similar width of channel to the upside – around 13,500. The speed of the rally is cause for concern, however, since earnings have yet to catch up with expectations, but, as I pointed out earlier, there are non-standard reasons why the market may be inhaling ether. The current PE Ratio is 21.5 times and the recent rally has made the market look expensive relative to forward earning. At 13,500 the PE will be close to 24.5 times. This chart book from Dr Ed Yardeni makes an excellent case for caution. This is a subscriber service if you wish to sign up for a free trial.

The domestic nature of the economic resurgence is exemplified most clearly by the chart below which shows the five year performance of the DAX Index versus the mid-cap MDAX Index, I believe it is time for the large cap stocks to benefit from the external windfalls of a weaker Euro and lower energy prices:-

DAX vs MDAX 2000-2015

Source: Finanzen.net

Real Estate

In Germany, Real Estate investment is different. Government policy has been to keep housing affordable and supply is therefore plentiful. This article from Inside Housing – German Lessons elaborates:-

Do you fancy a one-bed apartment in Berlin for £35,000 or a four- bed detached house in the Rhineland for £51,000?

In many parts of Germany house prices are a fraction of their UK equivalents – in fact, German house prices have decreased in real terms by 10 percent over the past thirty years, whereas UK house prices have increased by a staggering 233 percent in real terms over the same period. Yet German salaries are equal to or higher than ours. As a consequence Germans have more cash to spend on consumer goods and a higher standard of living, and they save twice as much as us, which means more capital for industry and commerce. Is it any surprise that the German economy is consistently out-performing ours?

There are a number of reasons for the disparity between the German and UK housing markets. Firstly, German home ownership is just over 40 percent compared to our 65 percent (there are stark regional variations – in Berlin 90 percent of all homes are privately rented) and the Germans do not worship ownership in the way we do. Not only is it more difficult to get mortgage finance (20 percent deposits are a typical requirement) but the private rented sector offers high quality, secure, affordable and plentiful accommodation so there are fewer incentives to buy. You can rent an 85 square metre property for less than £500 per month in Berlin or for around £360 per month in Leipzig. There is also tight rent control and unlimited contracts are common, so that tenants, if they give notice, can stay put for the long-term. Deposits must be repaid with interest on moving out.

In addition, Germany’s tax regime is not very favourable for property owners. There is a property transfer tax and an annual land tax. But the German housebuilding industry is also more diverse than ours with more prefabraction and more self-builders. The German constitution includes an explicit “right-to-build’’ clause, so that owners can build on their property or land without permission so long as it conforms with local codes.

But the biggest advantage of the German system is that they actively encourage new housing supply and release about twice as much land for housing as we do. German local authorities receive grants based on an accurate assessment of residents, so there is an incentive to develop new homes. The Cologne Institute for Economic Research calculated that in 2010 there were 50 hectares of new housing development land per 100,000 population in Germany but only 15 hectares in the UK. That means the Germans are building three times as many new homes as us pro-rata even though our population growth is greater than theirs. This means that German housing supply is elastic and can respond quickly to rising demand…


German rental protection laws – for the renter – are stronger than in other countries – this encourages renting rather than buying. From an investment perspective this makes owning German Real Estate a much more “bond like” proposition. With wages finally rising and economic prospects brightening, Real Estate is a viable alternative to fixed income. The table below was last updated in May 2014, at that time 10 yr Bunds were yielding around 1.5%:-

Apartment Location Cost Monthly Rent Yield
Berlin
45 sq. m. 108,225 500 5.55%
75 sq. m. 230,025 779 4.07%
120 sq. m. 489,360 1,362 3.34%
200 sq. m. 935,200 2,442 3.13%
Frankfurt
45 sq. m. 164,385 788 5.75%
75 sq. m. 308,025 1,182 4.60%
120 sq. m. 538,560 1,750 3.90%
200 sq. m. n.a. 3,066 n.a.
Munich
45 sq. m. 218,160 773 4.25%
75 sq. m. 463,275 1,172 3.00%
120 sq. m. 774,120 2,066 3.20%
200 sq. m. 1,850,000 3,562 2.31%

Source: Global Property Guide Definitions: Data FAQ

For comparison, commercial office space in these three locations also offers a viable yield: –

Office Location   Yield  
  2013 2012 2011
Berlin 4.7 4.8 4.95
Frankfurt 4.65 4.75 4.9
Munich 4.4 4.6 4.75

Source: BNP Paribas

I believe longer term investors are fairly compensated for the relative illiquidity of German Real Estate.

The Euro

For the international investor, buying Euro denominated assets exposes one to the risk of a continued decline in the value of the currency. The Euro Effective Exchange Rate is still near the middle of its long-term range, as the chart below illustrates, though since this chart ends in Q4 2014 the Euro has weakened to around 90:-

Euro_Effective_Excahnge_Rate_-_ECB_1993_-_2015

Source: ECB

Investors must expect further Euro weakness whilst markets obsess about the departure of Greece from the EZ, however, a “Grexit” or a resolution (aka restructuring/forgiveness) of Greek debt will allow the markets to clear.

Conclusion and Investment Opportunities

German Bunds continue to be the safe-haven asset of choice for the EZ, however, for the longer term investor they offer negligible or negative returns. German Real Estate, both residential and commercial, looks attractive from a yield perspective, but take care to factor in the useful life of buildings, since capital gains are unlikely.

This leaves German equities. A secular shift from bond to equity investment has been occurring due to the low level of interest rates, this has, to some extent, countered the demographic forces of an aging German population. Nonetheless, on a P/E ratio of 21.5 times, the DAX Index is becoming expensive – the S&P 500 Index is trading around 20 times.

At the current level I feel it is late to “arrive at the party” but on a correction to test the break-out around 10,000 the DAX looks attractive, I expect upward revisions to earnings forecasts to reflect the weakness of the Euro and the lower price of energy.