Macro Letter – No 31 – 06-03-2015
China versus India – Currencies, Reform and Growth
- India announced a reformist budget, short on detail but market friendly
- The PBoC cut interest rates again but are still behind the curve
- Chinese and Indian Real-Estate prices continue to decline in real terms
- INR/CNY exchange rate will move higher
Last month PWC – The World in 2050 – produced a long-term forecast for economic growth in which they predicted that India could become the second largest economy in the world by 2050 in purchasing power parity (PPP) and third largest in market exchange rate (MER) terms. Putting the scale of world economies in to perspective they say:-
China has already overtaken the US for the number one spot, and will remain as the world’s largest economy in 2050. India could narrowly overtake the US for the number two spot by 2050. However, the gap between the third largest economy and the fourth largest economy will widen considerably. In 2014, the third biggest economy (India) is around 50% larger than the fourth biggest economy (Japan). In 2050, the third biggest economy (the US) is projected to be approximately 240% larger than the fourth biggest economy (Indonesia).
The prospects from the BRIC economies are mixed. Russia is entangled in the geo-politics of the Ukraine and its economy has suffered from falling energy prices as this article from Chatham House – Troubled Times: Stagnation, Sanctions and the Prospects for Economic Reform in Russia explains. Meanwhile Brazil, still reeling from the stagnation of 2013, looks set to head into a fully-fledged recession exacerbated by high, wage-squeezing, inflation resulting from the near 30% decline in its currency. The prospects for India and China are much better.
India
Last week Arun Jaitley, India’s finance minister, announced a budget which he described as “a quantum jump”. Among other things, he intends to:-
- Implement an RBI inflation target
- Maintain a national government budget deficit of 4.1% of GDP in cash terms
- Target a budget reduction to 3% of GDP in 2017-2018
- Increase Spending on road construction and power generation
- Streamline subsidies and accelerate the de-nationalization of state industries
- Introduce a harmonised goods and sales tax, by April 2016, to replace state and federal levies – potentially adding 2% to GDP by creating an India-wide “common market”
- Rationalise direct-taxation – cutting corporation tax but closing loopholes, abolishing a wealth tax in favour of an income tax surcharge on higher earners
This amounts to a decidedly reformist agenda, although the speech was light on detail. It removes several barriers to investment in India, although the issue of reform of land laws remains unresolved.
China
Meanwhile, last Saturday, the People’s Bank of China (PBoC) cut interest rates. This is the third accommodative move in as many months. Their motivation appears to be three-fold:-
- Stimulate Credit Growth.
- The fall in credit as measured by “total social financing” -13.5% y/y in January 2015 versus a +17.5% in January 2014. This may also allow SOEs and SMEs to service existing debt acquired during the indiscriminate credit expansion of 2009.
- Alleviate Falling inflation.
- The inflation rate has declined by 1.7% since Q4 2014. Lending rates are only 20bp lower over the same period. In other word a “real” tightening of 1.5% has occurred.
- Stem Capital Outflows.
- The capital and financial account deficit hit a decade high of $91.2bln in Q4 2014. This is a sharp deterioration, in 2013 the capital account surplus for the year was $326.2bln
This action may still not be sufficient to re-invigorate the Chinese economy. It fuels hopes for further accommodation later this year. This could take the form of lower interest rates, additional liquidity, reduction in bank reserve requirements or some form of fiscal stimulus. Last year the Chinese government budget deficit was 2.1% of GDP, there is plenty of room for manoeuver.
China and India as economic dynamos
Before delving into the details of monetary policy in each country, it is worth taking a broad overview of the Chinese and Indian economies from a global perspective.
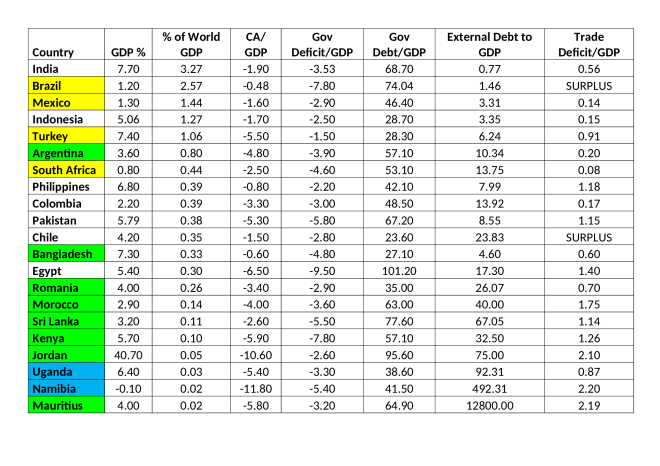
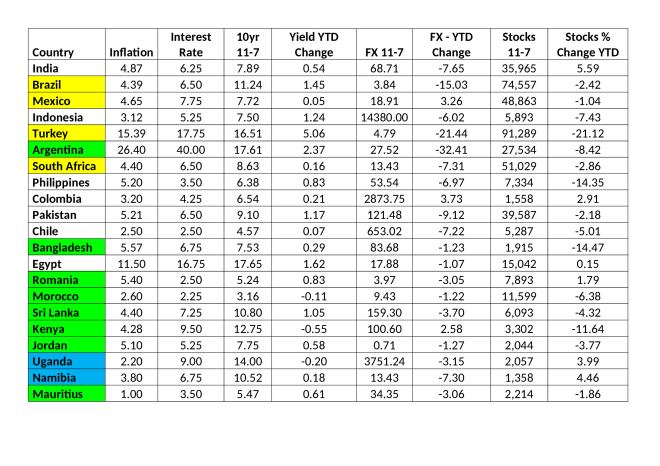
The table below shows the major economic regions of the world ranked by population: –
Source: Trading Economics
India and China stand out as the engines of economic growth. They have a combined population of more than 3.5bln. On a GDP per capita basis both countries have far to go. Indian GDP/Capita is $1,165 and China $3,583, compared to Euro Area $31,807 and USA $45,863. However, as PWC say in their report, the gap between the rich and these relatively poor countries is likely to narrow in percentage terms significantly by 2050.
Here are some more statistics which help to show the similarities and differences between the two economies:-
| Criteria |
China |
India |
| Age structure |
0-14 years: 17.1% |
0-14 years: 28.5% |
| 15-24 years: 14.7% |
15-24 years: 18.1% |
| 25-54 years: 47.2% |
25-54 years: 40.6% |
| 55-64 years: 11.3% |
55-64 years: 7% |
| 65 years and over: 9.6%(2014 est.) |
65 years and over: 5.8%(2014 est.) |
| Median age |
total: 36.7 years |
total: 27 years |
| male: 35.8 years |
male: 26.4 years |
| female: 37.5 years (2014 est.) |
female: 27.7 years (2014 est.) |
| Population growth rate |
0.44% (2014 est.) |
1.25% (2014 est.) |
| Birth rate |
12.17 births/1,000 (2014 est.) |
19.89 births/1,000 (2014 est.) |
| Death rate |
7.44 deaths/1,000 (2014 est.) |
7.35 deaths/1,000 (2014 est.) |
| Net migration rate |
-0.32 migrant(s)/1,000 (2014 est.) |
-0.05 migrant(s)/1,000 (2014 est.) |
| Urbanization – Urban |
50.6% of total population (2011) |
31.3% of total population (2011) |
| Rate of Urbanization |
2.85% annual (2010-15 est.) |
2.47% annual (2010-15 est.) |
| Major cities – population |
Shanghai 20.2mln BEIJING (capital) 15.6mln (2011) |
NEW DELHI (capital) 22.6mln Mumbai 19.7mln (2011) |
| Infant mortality rate |
14.79 deaths/1,000 live births |
43.19 deaths/1,000 live births |
| Life expectancy at birth |
75.15 years |
67.8 years |
| Total fertility rate |
1.55 children born/woman (2014 est.) |
2.51 children born/woman (2014 est.) |
| Infectious diseases |
degree of risk: intermediate |
degree of risk: very high |
| Literacy – age 15 (can read and write) |
total population: 95.1% |
total population: 62.8% |
| male: 97.5% |
male: 75.2% |
| female: 92.7% (2010 est.) |
female: 50.8% (2006 est.) |
| School life expectancy |
13 years |
12 years |
| Education expenditures |
NA |
3.2% of GDP (2011) |
| Maternal mortality rate |
37 deaths/100,000 live births (2010) |
200 deaths/100,000 live births (2010) |
| Children under weight <5yrs |
3.4% (2010) |
43.5% (2006) |
| Health expenditures |
5.2% of GDP (2011) |
3.9% of GDP (2011) |
| Physicians density |
1.46 physicians/1,000 population (2010) |
0.65 physicians/1,000 population (2009) |
| Hospital bed density |
3.8 beds/1,000 population (2011) |
0.9 beds/1,000 population (2005) |
| Adult Obesity |
5.7% (2008) |
1.9% (2008) |
Source: Index Mundi
From a Chinese perspective the main elements which stand out in the table above are:-
- Slower birth rate, aging population and lower fertility rate – according to the UN China’s working age population will decline by 16% between now and 2050
- Higher literacy, especially female literacy
- Lower mortality rate and higher health expenditure
For India, improvements in education, sanitation and healthcare are key factors.
Indian Monetary Policy
The Reserve Bank of India (RBI) cut their key Repo Rate in December 2014. Despite falling oil prices they have left this rate unchanged as the effects of the currency devaluation of 2013 work their way through the economy. This is an extract from the RBI Bulletin – February 2015:-
On the basis of an assessment of the current and evolving macroeconomic situation, it has been decided to:-
- keep the policy repo rate under the liquidity adjustment facility (LAF) unchanged at 7.75 per cent;
- keep the cash reserve ratio (CRR) of scheduled banks unchanged at 4.0 per cent of net demand and time liabilities (NDTL);
- reduce the statutory liquidity ratio (SLR) of scheduled commercial banks by 50 basis points from 22.0 per cent to 21.5 per cent of their NDTL with effect from the fortnight beginning February 7, 2015;
- replace the export credit refinance (ECR) facility with the provision of system level liquidity with effect from February 7, 2015;
- continue to provide liquidity under overnight repos of 0.25 per cent of bank-wise NDTL at the LAF repo rate and liquidity under 7-day and 14-day term repos of up to 0.75 per cent of NDTL of the banking system through auctions; and
- continue with daily variable rate term repo and reverse repo auctions to smooth liquidity
They go on to defend their hawkish stance on inflation:-
The upside risks to inflation stem from the unlikely possibility of significant fiscal slippage, uncertainty on the spatial and temporal distribution of the monsoon during 2015 as also the low probability but highly influential risks of reversal of international crude prices due to geo-political events. Heightened volatility in global financial markets, including through the exchange rate channel, also constitute a significant risk to the inflation assessment. Looking ahead, inflation is likely to be around the target level of 6 per cent by January 2016.
Their growth forecasts are also cautious:-
The outlook for growth has improved modestly on the back of disinflation, real income gains from decline in oil prices, easier financing conditions and some progress on stalled projects. These conditions should augur well for a reinvigoration of private consumption demand, but the overall impact on growth could be partly offset by the weaker global growth outlook and short-run fiscal drag due to likely compression in plan expenditure in order to meet consolidation targets set for the year. Accordingly, the baseline projection for growth using the old GDP base has been retained at 5.5 per cent for 2014-15. For 2015-16, projections are inherently contingent upon the outlook for the south-west monsoon and the balance of risks around the global outlook. Domestically, conditions for growth are slowly improving with easing input cost pressures, supportive monetary conditions and recent measures relating to project approvals, land acquisition, mining, and infrastructure. Accordingly, the central estimate for real GDP growth in 2015-16 is expected to rise to 6.5 per cent with risks broadly balanced at this point.
Since this report GDP data has surprised on the upside and the Indian Finance Ministry even suggested their own forecast could be revised to 8.5% – this is how the Wall Street Journal reported it, last week:-
India is in a “sweet spot,” the report said: Inflation has eased, international investors are bullish on India and the government in New Delhi has a strong mandate for change.
If the Modi administration continues improving the business environment and reducing government interference in the prices of food, fuel and other basic goods, the survey said, India’s GDP eventually could experience double-digit growth. That would give the country more resources to help its poor and provide opportunities for its young, growing middle class.
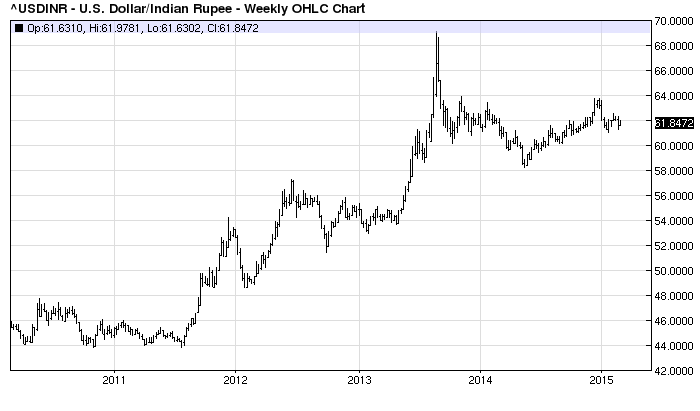
The combination of a relatively weak currency, declining inflation, accelerating growth and a structural reform package, from a government with a strong mandate from its electorate, are a heady cocktail. The RBI underpins these developments by holding back on interest rate cuts. The INR has taken this to heart as the chart below shows. It is still dangerous for the RBI to aggressively cut interest rates – the moderation in inflation needs to feed through to inflation expectations – but inward foreign direct investment could lead to a steady appreciation in the INR over the next couple of years. I wait for technical confirmation of this trend which could see at least a 61.8% correction of the 2011/2013 range (44-68) around USDINR 53:-
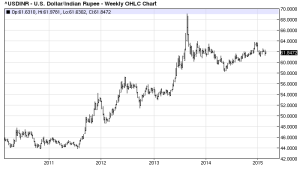
Source: Barchart.com
Chinese Monetary Policy
The Peoples Bank of China (PBoC) announced an interest rate cut last Saturday, lowering the one year rate to 5.35% from 5.6% previously. A PBoC official stated “Deflationary risk and the property market slowdown are two main reasons for the rate cut this time,” The PBoC press release was somewhat drier:-
The one-year RMB benchmark loan interest rate and deposit interest rate will both be lowered by 0.25 percentage points, to 5.35 percent and 2.5 percent, respectively. At the same time, the upper limit of the floating range for deposit interest rates will be raised from 1.2 to 1.3 times the benchmark level in support of market-oriented interest rate reform. Adjustments are made correspondingly to benchmark interest rates on deposits and loans of other maturities, and to deposit and loan interest rates on personal housing provident fund.
This is the second rate cut in four months. They also introduced a Standing Lending Facility to create better liquidity:-
To implement the decisions adopted at the Central Economic Work Conference as well as the requirements of the 2015 PBC Work Conference and PBC Money, Credit and Financial Market Work Meeting, to improve the central bank’s liquidity support channels for small and medium-sized financial institutions, to address seasonal liquidity fluctuations in the run-up to Spring Festival, and to promote stable functioning of the money market, the PBC has decided, based on the reproducible experience from the pilot Standing lending Facility (SLF) program participated by the branch offices in ten provinces (and municipalities), to introduce SLF operations in branch offices nationwide. As a result, the PBC branch offices will provide SLF on collaterals to four categories of local legal-entity financial institutions, i.e., the city commercial banks, rural commercial banks, rural cooperative banks, and rural credit cooperatives.
This followed on from a cut to Bank Reserve Requirements announced on February 5th:-
The PBC has decided to cut the RMB deposit required reserve ratio for financial institutions by 0.5 percentage points, effective from February 5, 2015. Furthermore, in order to enhance the capacity of financial institutions to support structural adjustment, and to beef up support to small and micro enterprises, the agricultural sector, rural area and farmer, and major water conservancy projects, the PBC has decided to cut the RMB deposit required reserve ratio for city commercial banks and non-county level rural commercial banks that have met the standards of targeted required reserve reduction by an additional 0.5 percentage points, and cut the required reserve ratio for the Agricultural Development Bank of China by an additional 4 percentage points.
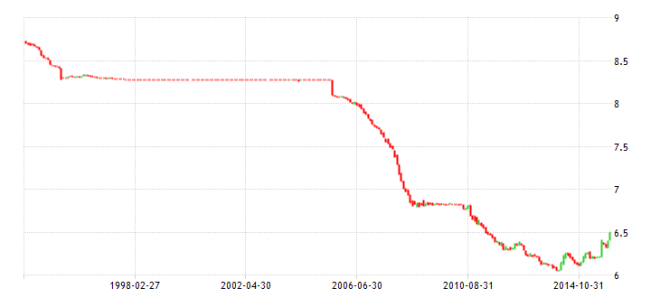
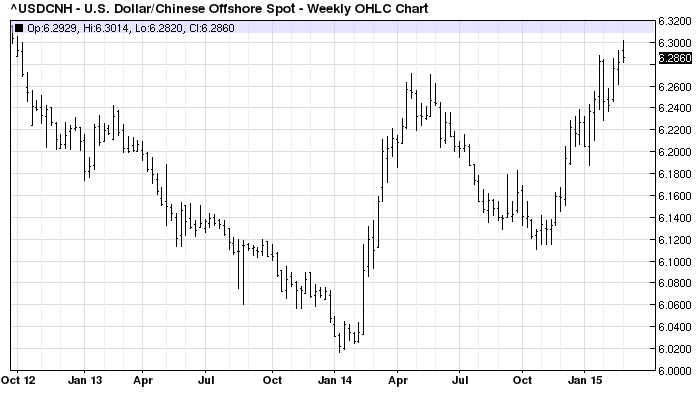
The continued pegging of the RMB – within tight parameters – to the US$ means that China is a beneficiary of the rising US$, but this is something of a double-edged sword since the currency appreciation has been damaging for Chinese exporters. The slowing of the Chinese economy over the last few months and PBoC action has heralded a much needed weakening of the CNY rate as this chart shows:-
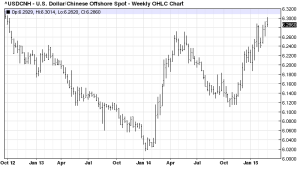
Source: Barchart.com
The PBoC rate cut will probably not be the last action to stimulate economic activity, being pegged to a currency which has been steadily rising on a trade-weighted basis whilst maintaining a substantial interest rate differential is a difficult long-term operation even for an economy as closed to international capital flows as China. The BIS – Assessing the CNH-CNY pricing differential: role of fundamentals, contagion and policy released this week, discusses some of these issues in greater detail, here is the abstract:-
Renminbi internationalisation has brought about an active offshore market where the exchange rate frequently diverges from the onshore market. Using extended GARCH models, we explore the role of fundamentals, global factors and policies related to renminbi internationalisation in driving the pricing differential between the onshore and offshore exchange rates. Differences in the liquidity of the two markets play an important role in explaining the level of the differential, while rises in global risk aversion tend to increase the differential’s volatility. On the policy front, measures permitting cross-border renminbi outflows have a particularly discernible impact in reducing the volatility of the pricing gap between the two markets.
A weaker RMB would help China more than devaluations have aided other emerging market countries since most of China’s debt is denominated in their own currency, however, a major factor acting as a drag on economic growth is over-investment. At more than 50%, China has the highest level of investment as a percentage of GDP of any major economy – in the UK, by contrast, investment amounts to less than 20%.
Asset Markets
Indian Real-Estate
With relatively high short-term interest rates and uncertainty still hanging over the market due to the currency devaluation of 2013, Indian Real-Estate transactions have been sluggish. In 2014 residential sales were down 30% y/y across India’s seven major cities. A growing inventory of unsold properties is weighing on the domestic banks. Real-Estate accounts for around 13% of Indian bank lending. With non-performing loans on the rise, lower interest rates would be very welcome for the banking sector. The chart below shows the age of property for sale and the length of time these properties are taking to sell in the major cities – a region which accounts for around 70% of India’s property development:-
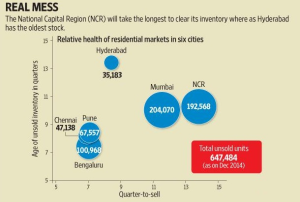
Source: Knight Frank
The National Housing Bank – a subsidiary of the RBI – publishes an index of prices. With an inverted government bond yield curve (1yr 7.83% vs 10yr 7.68% – 4-3-2015) and a substantial over-hang of inventory, it is not surprising that prices are struggling to make much real upside even in the best areas:-

Source: National Housing Bank
A new government initiative called the Smart Cities Project was launched last year with $1.2bln of funding for 2015. Long-term, this will help to deliver the housing and infrastructure India needs, but, near-term, Real-Estate is an asset class which remains supressed. Many apartment buildings stand empty and whilst real prices have not declined significantly, market activity remains very subdued. I do see value developing; there will be an opportunity to invest over the next couple of years as the economy responds to structural reforms.
Demand will emanate from urbanisation and an increase in high and middle income workers returning to India – after all, the “quality of life” for skilled workers returning home is compelling. A working paper from the Peterson Institute – The Economic Scope and Future of US-India Labor Migration Issues looks at the positive impact of both temporary and permanent Indian labour on US markets, they go on to raise concerns about recent US immigration policy:-
…but US immigration data show that India is by far the most important partner country for both permanent and temporary US employment-based migration: Indian nationals account for about half of all US employment-based permanent migration (e.g., green cards) in recent years.
…The prospects of a US-India totalization agreement for social contributions/taxation as part of an FTA are evaluated. A TA is likely to result in indirect economic losses to the United States from the loss of payroll taxes paid but never claimed by temporary Indian workers in the United States. The substantial political and economic quid pro quo that India would have to commit to in order to incentivize the United States to negotiate a TA would be daunting and seems likely to diminish the attractiveness of an FTA to India.
This 2012 paper from the Institute for European Studies – India’s Returning Elite Knowledge Workers is an excellent insight into the inward migration of skilled workers to the major cities of India’s North East. Here is a summary of the “Brain-Gain”:-
India’s rising independence in the last decade as an economic actor constitutes new issues in global governance for a large skilled workforce. What once constituted a ‘brain-drain’ for Indian actors that emigrated to the Global North (EU and US economic powers), is now resulting in a ‘brain-gain’ for the sending countries. India, as a representative power of the emerging Global South, has been a leader in creating cross-border social networks for entrepreneurship through ties between the Indian expatriate community and local entrepreneurs in industries that are enticing Western agents.
This dissertation project investigates how the ‘brain gain’ of high-skilled entrepreneurs of Indian origin has transformed the landscape of infrastructure and social relations within emergent Global South cities in India based upon elite trans-migrant imaginaries of home. India’s growth as a global power attributed to cross border diasporic networks of Indian transnationals has given rise to a generation of permanently returning migrants to India’s cosmopolitan cities. This paper explores the movement of transnational Indian elites returning from the United States and Europe to postcolonial India. Through ethnographic interviews in Silicon Valley, California, I attempt to understand why social and technological entrepreneurs of Indian origin, those who see their return as a new venture or idea, are returning to accommodate a hybridized Western lifestyle within an Indian socio-cultural context. These entrepreneurs are transforming the peripheries of the cosmopolitan global city through the gated communities where they reside and Special Economic Zones where they work toward developing new business and change in India. By examining the narratives and everyday life of elite diasporic returners in their newfound ‘home’ spaces, I question (a) what are the principle motivations that guide entrepreneurs to return to India (b) whether the cosmopolitan Global South city can function as a hybrid ‘home’ and (c) in locating ‘home’ by transforming their spatial and temporal relationships, how are power relations constituted.
Chinese Real-Estate
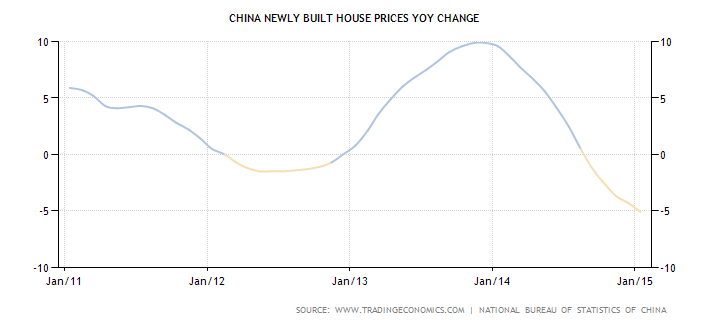
Shanghai Real-Estate has risen by 650% since 2000 and by 85% since the last peak in 2007, although nationwide the increase in the period from 2008 to 2013 was a more moderate 20%. The driving force behind this price increase has been urbanisation. In the past 12 years 220mln people have move from rural to urban districts in China. A large number of these new, often unskilled, city dwellers have been employed in construction. It is estimated that 27% of urban Real-Estate is unoccupied. This explains the recent downturn in Chinese Real-Estate prices as this chart of newly built housing shows:-
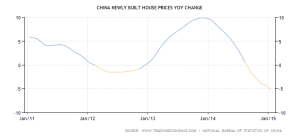
Source: Trading Economics and National Bureau of Statistics of China
In January the decline was -5.1% versus -4.3% in December and -3.7% in November 2014. Price drops were recorded in 64 of the 70 major cities, compared to 66 in December. Declines are not evenly distributed: the average price of new homes in the country’s four first-tier cities rose for the second consecutive month. The existing housing market is also more buoyant for first-tier cities, rising for the fourth month in a row. In second and third-tier cities prices continue to decline.
Writing in the FT – How addiction to debt came even to China Martin Wolf describes the problem overhanging the Chinese property market:-
China’s huge credit boom has several disquieting features. Much of the rise in debt is concentrated in the property sector; “shadow banking” — that is lending outside the balance sheets of the formal financial institutions — accounts for 30 per cent of outstanding debt, according to McKinsey; much of the borrowing has been put on off-balance-sheet vehicles of local governments; and, above all, the surge in debt was not linked to a matching rise in trend growth, but rather to the opposite.
This does not mean China is likely to experience an unmanageable financial crisis. On the contrary, the Chinese government has all the tools it needs to contain a crisis. It does mean, however, that an engine of growth in demand is about to be switched off. As the economy slows, many investment plans will have to be reconsidered. That may start in the property sector. But it will not end there. In an economy in which investment is close to 50 per cent of GDP, the downturn in demand (and so output) might be far more severe than expected.
Despite this relatively sanguine appraisal of the prospects for the housing market it is worth pointing out that 75% of Chinese individual net worth is tied up in Real-Estate – by way of comparison, in the US the figure is 28%.
Chinese Real-Estate may recover at some point, probably in response to wage growth – currently running at around 8% in real terms, buoyed by state mandated minimum wage increases (13%) and strong growth in private manufacturing (12%). For the present I expect Real-Estate prices to continue to decline. This will eventually exert significant downward pressure on private domestic consumption – an impediment to the policy of “re-balancing”.
Indian Equities
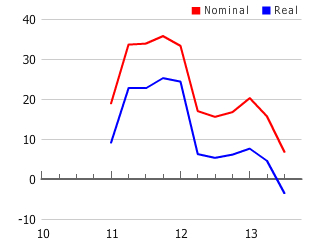
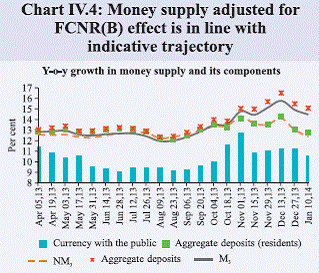
Indian equities have performed strongly due to the currency devaluation, high inflation and relatively strong economic growth. Money supply has moderated in response to higher interest rates but is still sufficient to encourage asset market speculation. The chart below covers the period up to January 2014 but the double digit expansion has continued during the last year:-
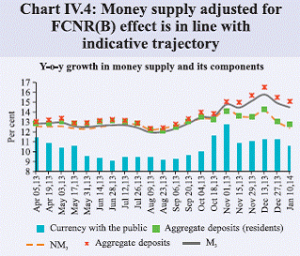
Source: RBI
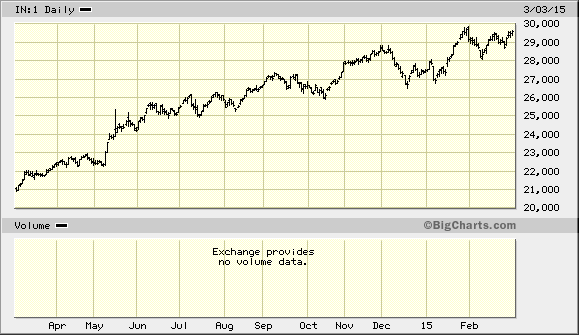
The currency devaluation of 2013 has fed through to higher inflation but the fall in oil prices has narrowed the current account deficit, whilst exports have held up well. This, among other factors, has supported a rise in stocks, despite the RBI’s hawkish stance:-
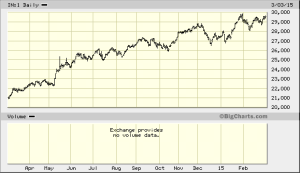
Source: Bigcharts.com
The SENSEX Index is trading on a current P/E ratio of 18.52. This is still in the lower half of the 5 year range (16.5 to 24). With growth prospects likely to be revised higher, I believe the market will continue to exhibit strong performance over the coming year.
Chinese Equities
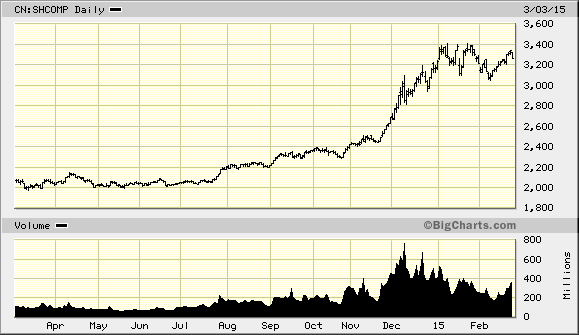
The Shanghai Composite performed strongly in Q4 2014 as markets became cognizant of the PBoCs dovish policy shift. Government policy is also supportive, with the continued development of Free Trade Zones remaining high on their agenda. The Jamestown Foundation – “Hope” versus “Hype”: Reforms in China’s Free Trade Zones provides more detail and suggests they may fail to realize their early promise:-
After a year of the Shanghai pilot FTZ, three new FTZs are now being established in the major sea-port cities of Guangdong, Tianjin and Fujian (South China Morning Post, December 13, 2014). Fujian is the closest mainland province to Taiwan, Tianjin specializes in international shipping and related sectors and Guangdong is adjacent to Hong Kong and Macao and is close to Southeast Asia. However, the troubles of the Shanghai FTZ—despite the personal high-level support of Premier Li—suggest that these new FTZs will face an uphill battle in expanding the grounds of economic liberalization in China.
Most Promises Stand Unfulfilled
China’s slowing growth has led many foreign companies to consider scaling back their expansion plans, and the Shanghai FTZ has failed to deliver on the promises of reform that appear necessary to justify foreign companies’ high hopes for a better future business environment in China.
Bi-lateral Free Trade Agreements are also being contemplated. This paper from ECFR – The European interest in an investment treaty with China explores one with the EU:-
Like the EU, China is a global player. Trade and investment talks cannot be viewed in isolation of moves with third parties. Chinese economic agents – from SOEs turning into multilateral firms, to sovereign funds or more dispersed private actors – are in a decisive phase of capital internationalisation as China maintains a large current account surplus.
Recent trade data, however, paints a vulnerable picture in the near-term. This was the data for January, admittedly a notoriously volatile period as it precedes the Chinese New Year: –
- Imports -19.9% – forecast -3.2%
- Exports -3.3% – forecast +5.9%
- Crude oil imports -41.8%
- Iron ore imports -50.3%
- Coal imports – 61.8%
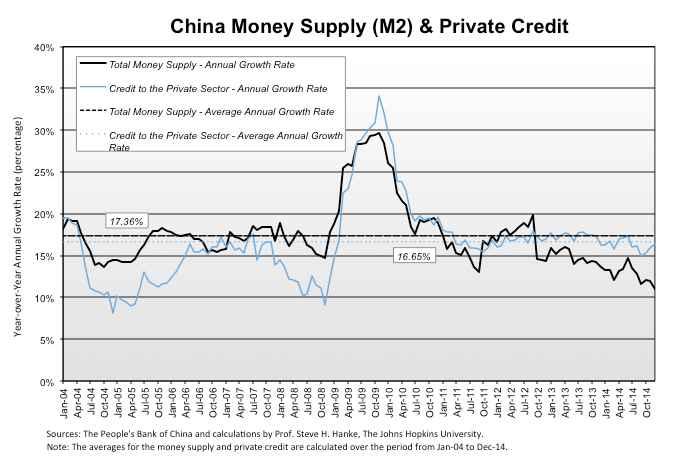
Another factor impacting the stock market is credit and money supply growth, M2 grew 12.2% in December 2014 down from a high of 13.6% in 2013, however it has regained upward momentum in the last couple of months:-

Source: Cato, John Hopkins University and PBoC
Unless it can be reversed, this declining trend will act as a drag on economic activity. Nonetheless, the stock market has surged ahead – note the dramatic increase in volume traded – anticipating the effect of the PBoC policy shift:-

Source: Bigcharts.com
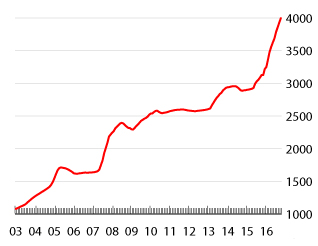
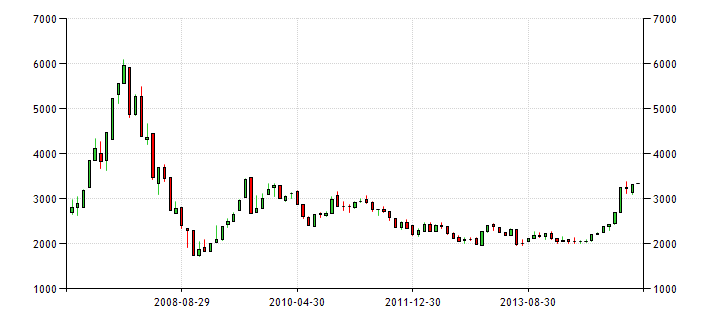
A longer-term chart shows that the market has some distance to go until it reaches its old highs:-

Source: Trading Economics
The Shanghai Composite is trading on a P/E ratio of 16.33. This is undemanding but the risk of China unpegging and devaluing their currency is a significant risk for the international investor.
Conclusions and Investment Opportunities
Bonds
I have not made much mention of the government bond markets in China or India: it is not because one cannot invest in these markets but due to the relative difficulty of accessing them and their uneven liquidity. They both offer a real yield – China 2.63% and India 2.57% for 10 year (4-3-2015). Both markets are attractive.
Real-Estate
Both China and India are suffering from an overhang of unsold property but the overvaluation is more pronounced in China. India has the additional advantage that interest rates have more room to fall in the event of a sharp downturn in economic activity. India has a younger population and its skilled ex-patriot workers are returning in significant numbers. The Chinese market will take longer to clear. Neither market has finished correcting yet.
Equities
On a price to earnings basis the Shanghai Composite (16.33 times) offers better value than the Sensex (18.52 times) however there is a real risk that the “internationalisation” of the RMB leads to its decline against the US$. The Sensex is making new highs whilst the Shanghai Composite is trading higher after a major correction from the 2008 highs. This is not to suggest that India is trouble free, however, it has more room to grow given its per capita GDP, and less signs of over-investment. Corruption is an issue in both countries but the Chinese administration’s efforts to root out officials who have “feathered their nests” is likely to act as a drag on growth. Indian reform is principally concerned with reducing bureaucratic impediments to the functioning of free markets – closing tax loopholes, reducing state interference in competitive processes and so forth.
The key for growth in both China and India is the inward flow of foreign capital. On January 29th the UN – Global Investment Trends Monitor – announced that China had become the leading destination for FDI in 2014 ($128bln) for the first time since 2003, however, its growth rate was an incremental 3%. India, by contrast, saw FDI surge by more than 26% to $35bln – this follows a 17% rise in 2013. This trend will continue, accelerated by the reforming zeal of the incumbent regime.
Indian and Chinese interest rates will decline, but Indian rates have more room to fall. Chinese and Indian stocks will rise but, with the currency devaluation behind it, Indian stocks – despite their higher P/E ratio – look better placed to rise.
Currency
Risks for the RMB are on the downside whilst for the INR they are on the upside, the trend is underway:-
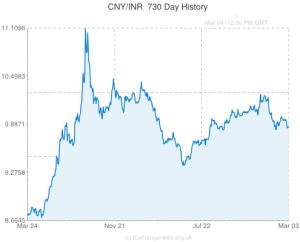
Source: Exchangerates.org.uk