Macro Letter – No 72 – 10-03-2017
Low cost manufacturing in Asia – The Mighty Five – MITI V
- Low cost manufacturing is moving away from China
- Malaysia, India, Thailand, Indonesia and Vietnam will continue to benefit
- Currency risks remain substantial
- Stock market valuations are not cheap but they offer long term value
The MITI V is the latest acronym to emerge from the wordsmiths at Deloitte’s. Malaysia, India, Thailand, Indonesia and Vietnam. All these countries have a competitive advantage over China in the manufacture of labour intensive commodity type products like apparel, toys, textiles and basic consumer electronics. According to Deloitte’s 2016 Global Manufacturing Competitiveness Index they are either among, or destined to join, the top 15 most competitive countries in the world for manufacturing, by the end of the decade. Here is the Deliotte 2016 ranking:-

Source: Deliotte
The difficulty with grouping disparate countries together is that their differences are coalesced. Malaysia and Thailand are likely to excel in high to medium technology industries, their administrations are cognizant of the advantages of international trade. India, whilst it has enormous potential, both as an exporter and as a manufacturer for its vast domestic market, has, until recently, been less favourably disposed towards international trade and investment. Vietnam continues to benefit from its proximity to China. Indonesia, by contrast, has struggled with endemic corruption: its economy is decentralised and this vast country has major infrastructure challenges.
The table below is sorted by average earnings:-
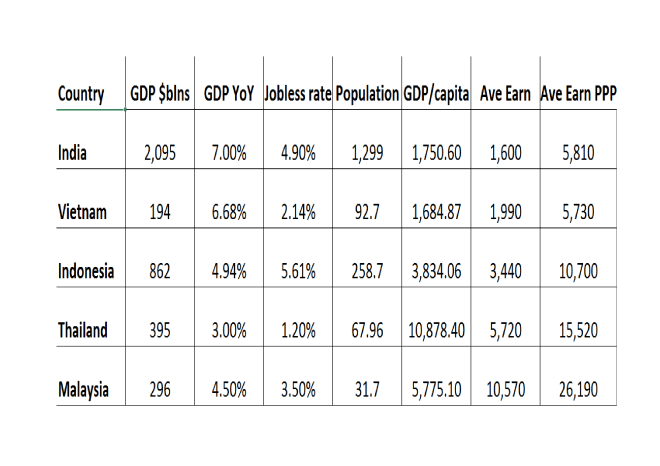
Source: World Bank, Trading Economics
India and Vietnam look well placed to become the low-cost manufacturer of choice (though there are other contenders such as Bangladesh which should not be forgotten when considering comparative advantage).
Another factor to bear in mind is the inexorable march of technology. Bill Gates recently floated the idea of a Robot Tax, it met with condemnation in many quarters – Mises Institute – Bill Gates’s Robot Tax Is a Terrible Idea – examines the issue. The mere fact that a Robot Tax is being contemplated, points to the greatest single challenge to low-cost producers of goods, namely automation. Deliotte’s does not see this aspect of innovation displacing the low-cost manufacturing countries over the next few years, but it is important not to forget this factor in one’s assessment.
Before looking at the relative merits of each market from an investment perspective, here is what Deliotte’s describe as the opportunities and challenges facing each of these Asian Tigers:-
Malaysia
…has a low cost base with workers earning a quarter of what their counterparts earn in neighboring Singapore. The country also remains strongly focused on assembly, testing, design, and development involved in component parts and systems production, making it well suited to support high-tech sectors.
…is challenged by a talent shortage, political unrest, and comparatively low productivity.
India
Sixty-two percent of global manufacturing executives’ surveyed rank India as highly competitive on cost, closely mirroring China’s performance on this metric.
…highly skilled workforce and a particularly rich pool of English speaking scientists, researchers, and engineers which makes it well-suited to support high-tech sectors. India’s government also offers support in the form of initiatives and funding that focus on attracting manufacturing investments.
…challenged by poor infrastructure and a governance model that is slow to react
…As 43 percent of its US$174 billion in manufacturing exports require high-skill and technological intensity, India may have a strong incentive to solve its regulatory and bureaucratic challenges if it is to strengthen its candidacy as an alternative to China.
Thailand
When it comes to manufacturing exports (US$167 billion in 2014), Thailand stands slightly below India, but exceeds Malaysia, Vietnam, and Indonesia. This output is driven largely by the nation’s skilled workforce and high labor productivity, supported by a 90 percent national literacy rate, and approximately 100,000 engineering, technology, and science graduates every year.
…highly skilled and productive workforce creates relatively high labor costs at US$2.78 per hour in 2013.
…remains attractive to manufacturing companies, offering a lower corporate tax rate (20 percent) than Vietnam, India, Malaysia or Indonesia. Already well established with a booming automotive industry, Thailand may provide an option for manufacturers willing to navigate the political uncertainty that persists in the region.
Indonesia
Manufacturing labor costs in Indonesia are less than one-fifth of those in China.
…The island nation’s overall 10-year growth in productivity (50 percent) exceeds that of Thailand, Malaysia, and Vietnam,
…manufacturing GDP represents a significant portion of its overall GDP and with such a strong manufacturing focus, particularly in electronics, coupled with the sheer size of its population, Indonesia remains high on the list of alternatives for manufacturers looking to shift production capacity away from China in the future.
Vietnam
…comparatively low overall labor costs.
…has raised its overall productivity over the last 10 years, growing 49 percent during the period, outpacing other nations like Thailand and Malaysia. Such productivity has prompted manufacturers to construct billion-dollar manufacturing complexes in the country.
Deliotte’s go on to describe the incentives offered to multinational corporations by these countries:-
(1) numerous tax incentives in the form of tax holidays ranging from three to 10 years, (2) tax exemptions or reduced import duties, and (3) reduced duties on capital goods and raw materials used in export-oriented production.
Forecasts for 2017
In the nearer term the MITI V have more varied prospects, here are Focus Economics latest consensus GDP growth expectations from last month:-
Malaysia Economic Outlook 2017 GDP forecast 4.3%
…GDP recorded the strongest performance in four quarters in Q4, expanding at a better-than-expected rate of 4.5%.
…acceleration in fixed investment and resilient private consumption. Exports also showed a significant improvement, growing at the fastest pace since Q4 2015, thanks to a weaker ringgit and rising oil prices. However, the external sector’s net contribution to growth remained stable as imports also gained steam. Government consumption, which contracted for the first time since Q2 2014, was the only drag on growth in Q4, reflecting the government’s commitment to its fiscal consolidation agenda for 2016.
India Economic Outlook 2017 GDP forecast – 7.4%
Economic activity is beginning to firm after demonetization shocked the economy in the October to December period. The manufacturing PMI crossed into expansionary territory in January and imports rebounded.
…Despite the backdrop of more moderate growth, the government stuck to a market friendly budget for FY 2017
…which was presented on 1 February, pursues growth-supportive policies while targeting a narrower deficit of 3.2% of GDP…
…five states will conduct elections in February, with results to be announced on 11 March. The elections will test the electorate’s mood regarding the government after the economy’s tumultuous past months and ahead of the 2019 general vote.
Thailand Economic Outlook 2017 GDP forecast 3.2%
Growth decelerated mildly in the final quarter of 2016 due to subdued private consumption and a smaller contribution from the external sector. The economy expanded 3.0% annually in Q4, down from 3.2% in Q3.
…January, consumer confidence hit a nearly one-year high, while business sentiment receded mildly. On 27 January, the government announced supplementary fiscal stimulus of USD 5.4 billion for this year’s budget, which ends in September. The sum will be disbursed specifically in rural areas in a bid to close the growing inequality between urban and rural infrastructure and income. This shows that the military government is set to continue providing fiscal stimulus to GDP this year, which should spill over in the private sector via higher employment and improved economic sentiment.
Indonesia Economic Outlook 2017 GDP forecast 5.2%
…economy lost steam in the fourth quarter of last year as diminished government revenues caused public spending to fall at a multi-year low.
…household consumption remained healthy and the recent uptick in commodities prices boosted export revenues.
…for the start of 2017…momentum firmed up: the manufacturing PMI crossed into expansionary territory in January and surging exports pushed the trade surplus to an over three-year high.
…poised for a credit ratings upgrade after Moody’s elevated its outlook from stable to positive on 8 February. All three major ratings agencies now have a positive outlook on Indonesia’s credit rating and an upgrade could be a catalyst for improving investor sentiment.
Vietnam Economic Outlook 2017 GDP forecast 6.4%
…particularly strong performance in the external sector in 2016. Despite slower demand from important trading partners, merchandise exports, which consist largely of manufactured goods, grew 9.0% annually. The manufacturing sector is quickly expanding thanks to the country’s competitive labor costs, fueling manufacturing exports and bolstering job creation in the sector.
…industrial production nearly stagnated in January, it mostly reflected a seasonal effect from the Lunar New Year, which disrupted supply chains across the region.
…manufacturing Purchasing Manager’s Index, though it inched down in January, continues to sit well above the 50-point line, reflecting that business conditions remain solid in the sector. Moreover, the New Year festivities boosted retail sales, which grew robustly in January.
Currency Risk
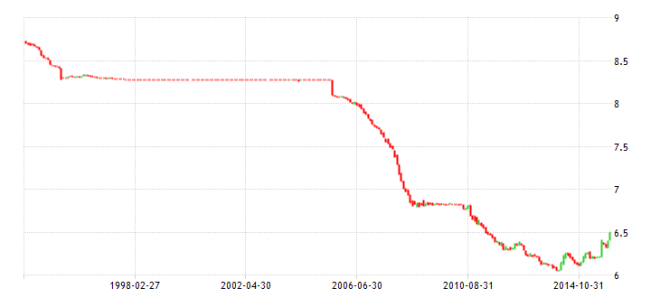
The table below shows the structural nature of the MITI V’s exchange rate depreciation against the US$. The 20 year column winds the clock back to the period just before the Asian Financial Crisis in 1997:-
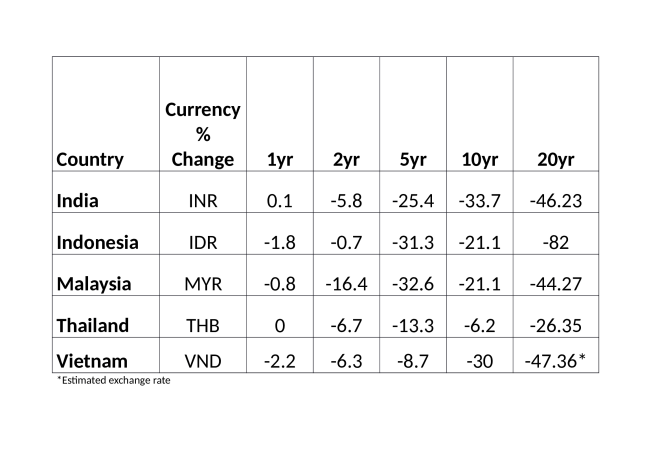
Source: Trading Economics, World Bank
Looking at the table another way, when investing in Indonesia it would make sense to factor in a 4% annual decline in the value of the Rupiah, a 2.2% to 2.4% decline in the Ringgit, Rupee and Dong and a 1.3% fall in the value of the Baht.
The continuous decline in these currencies has fuelled inflation and this is reflected to the yield and real yields available in their 10 year government bond markets. The table below shows the current bond yields together with inflation and their governments’ fiscal positions:-

Source: Trading Economics
Indonesian bonds offer insufficient real-yield to cover the average annual decline in the value of the Rupiah. Vietnam has an inverted yield curve which suggests shorter duration bonds would offer better value, its 10 year maturity offers the lowest real-yield of the group.
Whilst all these countries are running government budget deficits, Malaysia, Thailand and Indonesia have current account surpluses and Indonesia’s government debt to GDP is a more manageable 27% – this is probable due to its difficulty in attracting international investors on account of the 82% decline in its currency over the past two decades.
Stock Market Valuations
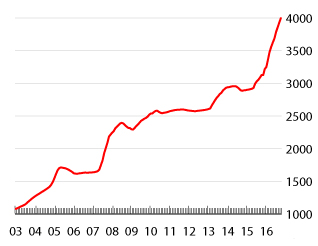
All five countries have seen their stock markets rise this year, although the SET 50 (Thailand) has backed off from its recent high. To compare with the currency table above here are the five stock markets, plus the S&P500, over one, two, five, ten and twenty years:-

Source: Investing.com
For the US investor, India and Indonesia have been the star performers since 1997, each returning more than six-fold. Thailand, which was at the heart of the Asian crisis of 1997/98, has only delivered 114% over the same period whilst Malaysia, which imposed exchange controls to stave off the worst excesses of the Asian crisis, has failed to deliver equity returns capable of countering the fall in its currency. Finally, Vietnam, which only opened its first stock exchange in 2000, is still recovering from the boom and bust of 2007. The table below translates the performance into US$:-
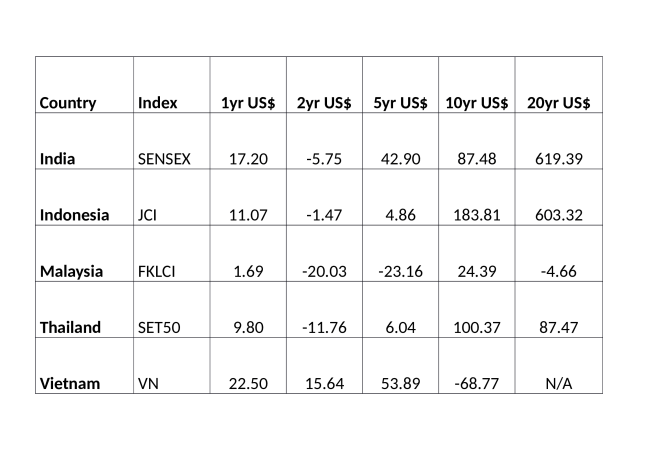
Source: Investing.com
Putting this data in perspective, over the last five years the S&P has beaten the MITI V not only in US$, but also in absolute terms. Looking forward, however, there are supportive valuation metrics which underpin some of the MITI V stock markets. The table below is calculated at 30-12-2016:-

Source: Starcapital.de, *Author’s estimates
Conclusion and Investment Opportunities
Vietnamese stocks look attractive, the country has the highest level of FDI of the group (6.1% of GDP) but there is a favourable case for investing in the stocks of the other members of the MITI V, even with FDI nearer 3%. They all have favourable demographics, except perhaps Thailand, and its age dependency ratio is quite low. High literacy, above 90% in all except India, should also be advantageous.
Thailand and Malaysia look less expensive from a price to earnings perspective, than India and Indonesia. Their dividend yields also look attractive relative to their bond yields, perhaps a hangover from the Asian Crisis of 1997.
Technically all five stock markets are at or near recent highs:-

Source: Investing.com
The Vietnamese VN Index is a long way below its high and on a P/E, P/B and dividend yield basis it is the cheapest of the five stock markets, but it is worth remembering that it is still regarded at a Frontier Market, It was not included in the MSCI Emerging Markets indices last year. This remains a prospect at the next MSCI review in May/June.
Given how far global equity markets have travelled since the November US elections, it makes sense to be cautious about stock markets in general. Technically a break to new highs in any of these markets is likely to generate further upside momentum but Vietnam looks constructive both over the shorter term (as it makes new highs for the year) and over the longer term (being well below its all-time highs of 2007). In the Long Run, I expect these economies to the engines of world growth and their stock markets to reflect that growth.