
With another $1.9trln of US fiscal relief set to be voted through, attention is likely to switch back to Europe. This article from August 2020 seems relevant to the debate.
ECB


A Rose by Any Other Name – Corona Bonds and the Future of the Eurozone
![]()
Macro Letter – No 128 – 17-04-2020
A Rose by Any Other Name – Corona Bonds and the Future of the Eurozone
- A European fiscal spending package worth Euro 540bln has been agreed
- Eurozone bonds have crashed and recovered
- Corona Bonds have been found unnecessary
- The issue of Eurozone backed Eurobonds will not go away
On April 9th the Eurogroup of Finance Ministers eventually agreed upon a three-pronged package to avert some of the economic impact of the Covid-19 pandemic. For financial markets this was a relief, had the Eurogroup broken up, for the second time in a week, without a deal markets would have reacted badly. The three-pronged package included health expenditure funding from the European Stability Mechanism (ESM), loans for businesses from the European Investment Bank (EIB) and further funding from the European Commission’s unemployment fund. The total package is a modest Euro 540bln, the political ramifications are much less so.
What was not agreed, despite the unprecedented circumstances surrounding the pandemic, was a collective pooling of Eurozone (EZ) resources in the form of ‘Eurobonds,’ deftly renamed ‘Corona Bonds,’ by their advocates. For the fiscally responsible countries of Northern Europe, even the current crisis was insufficient for them to contemplate underwriting the prodigal South.
The compromise, agreed last week, included the use the ESM. The ESM itself, together with the outright monetary transactions (OMT) undertaken by the ECB, were forged in the 2010/2012 Eurozone crisis. At that time the convergence of Eurozone government bond yields, which had begun long before the advent of the Euro, was unravelling as investors realised that Europe would not collectively underwrite any individual state’s obligations. The North/South divide became a chasm, with Greek, Portuguese, Italian and Spanish bond yields rising sharply whilst German, Dutch and Finnish yields declined. The potential default of a Eurozone government was only averted by the actions of the then President of the ECB, Mario Draghi, when he stated that the central bank would do, ‘Whatever it takes.’
Once again, a motley deal has been forged, recriminations will follow. Whilst lower government financing costs remain a major attraction of EZ membership for newer members of the EU, the benefit is by no means guaranteed, as this 2017 paper – Eurozone Debt Crisis and Bond Yields Convergence: Evidence from the New EU Countries – by Minoas Koukouritakis, reveals: –
Based on the empirical results, there is some clear evidence of strong monetary policy convergence for each of the Czech Republic, Lithuania and Slovakia to Germany. Alternatively, under the UIP and ex-ante relative PPP conditions, the expected inflation rate of these three countries has converged to the expected inflation rate of Germany. This is an expected result not only because Lithuania and Slovakia are already Eurozone members, but also because Germany plays a very important role in the economies of these three countries. Furthermore, the empirical results provide evidence of weak monetary policy convergence for each of Croatia and Romania to Germany. In contrast, for the remaining seven new EU countries, namely Bulgaria, Cyprus, Hungary, Latvia, Malta, Poland and Slovenia, the empirical evidence suggests yields’ divergence for each of these countries in relation to Germany. For Cyprus, Latvia and Slovenia, which as Eurozone members they have common monetary policy with Germany, the empirical evidence could probably be attributed to the increased sovereign default risk of these countries, which in turn led to large and persistent risk premia.
In summary, the empirical evidence indicates that in the context of the Eurozone debt crisis, even though Germany has established its dominance and sets the macroeconomic policies in the Eurozone, several new EU countries are unable to follow these policies. And this conclusion addresses once more the issue of core-periphery in the Eurozone and, thus, the Eurozone’s future prospects.
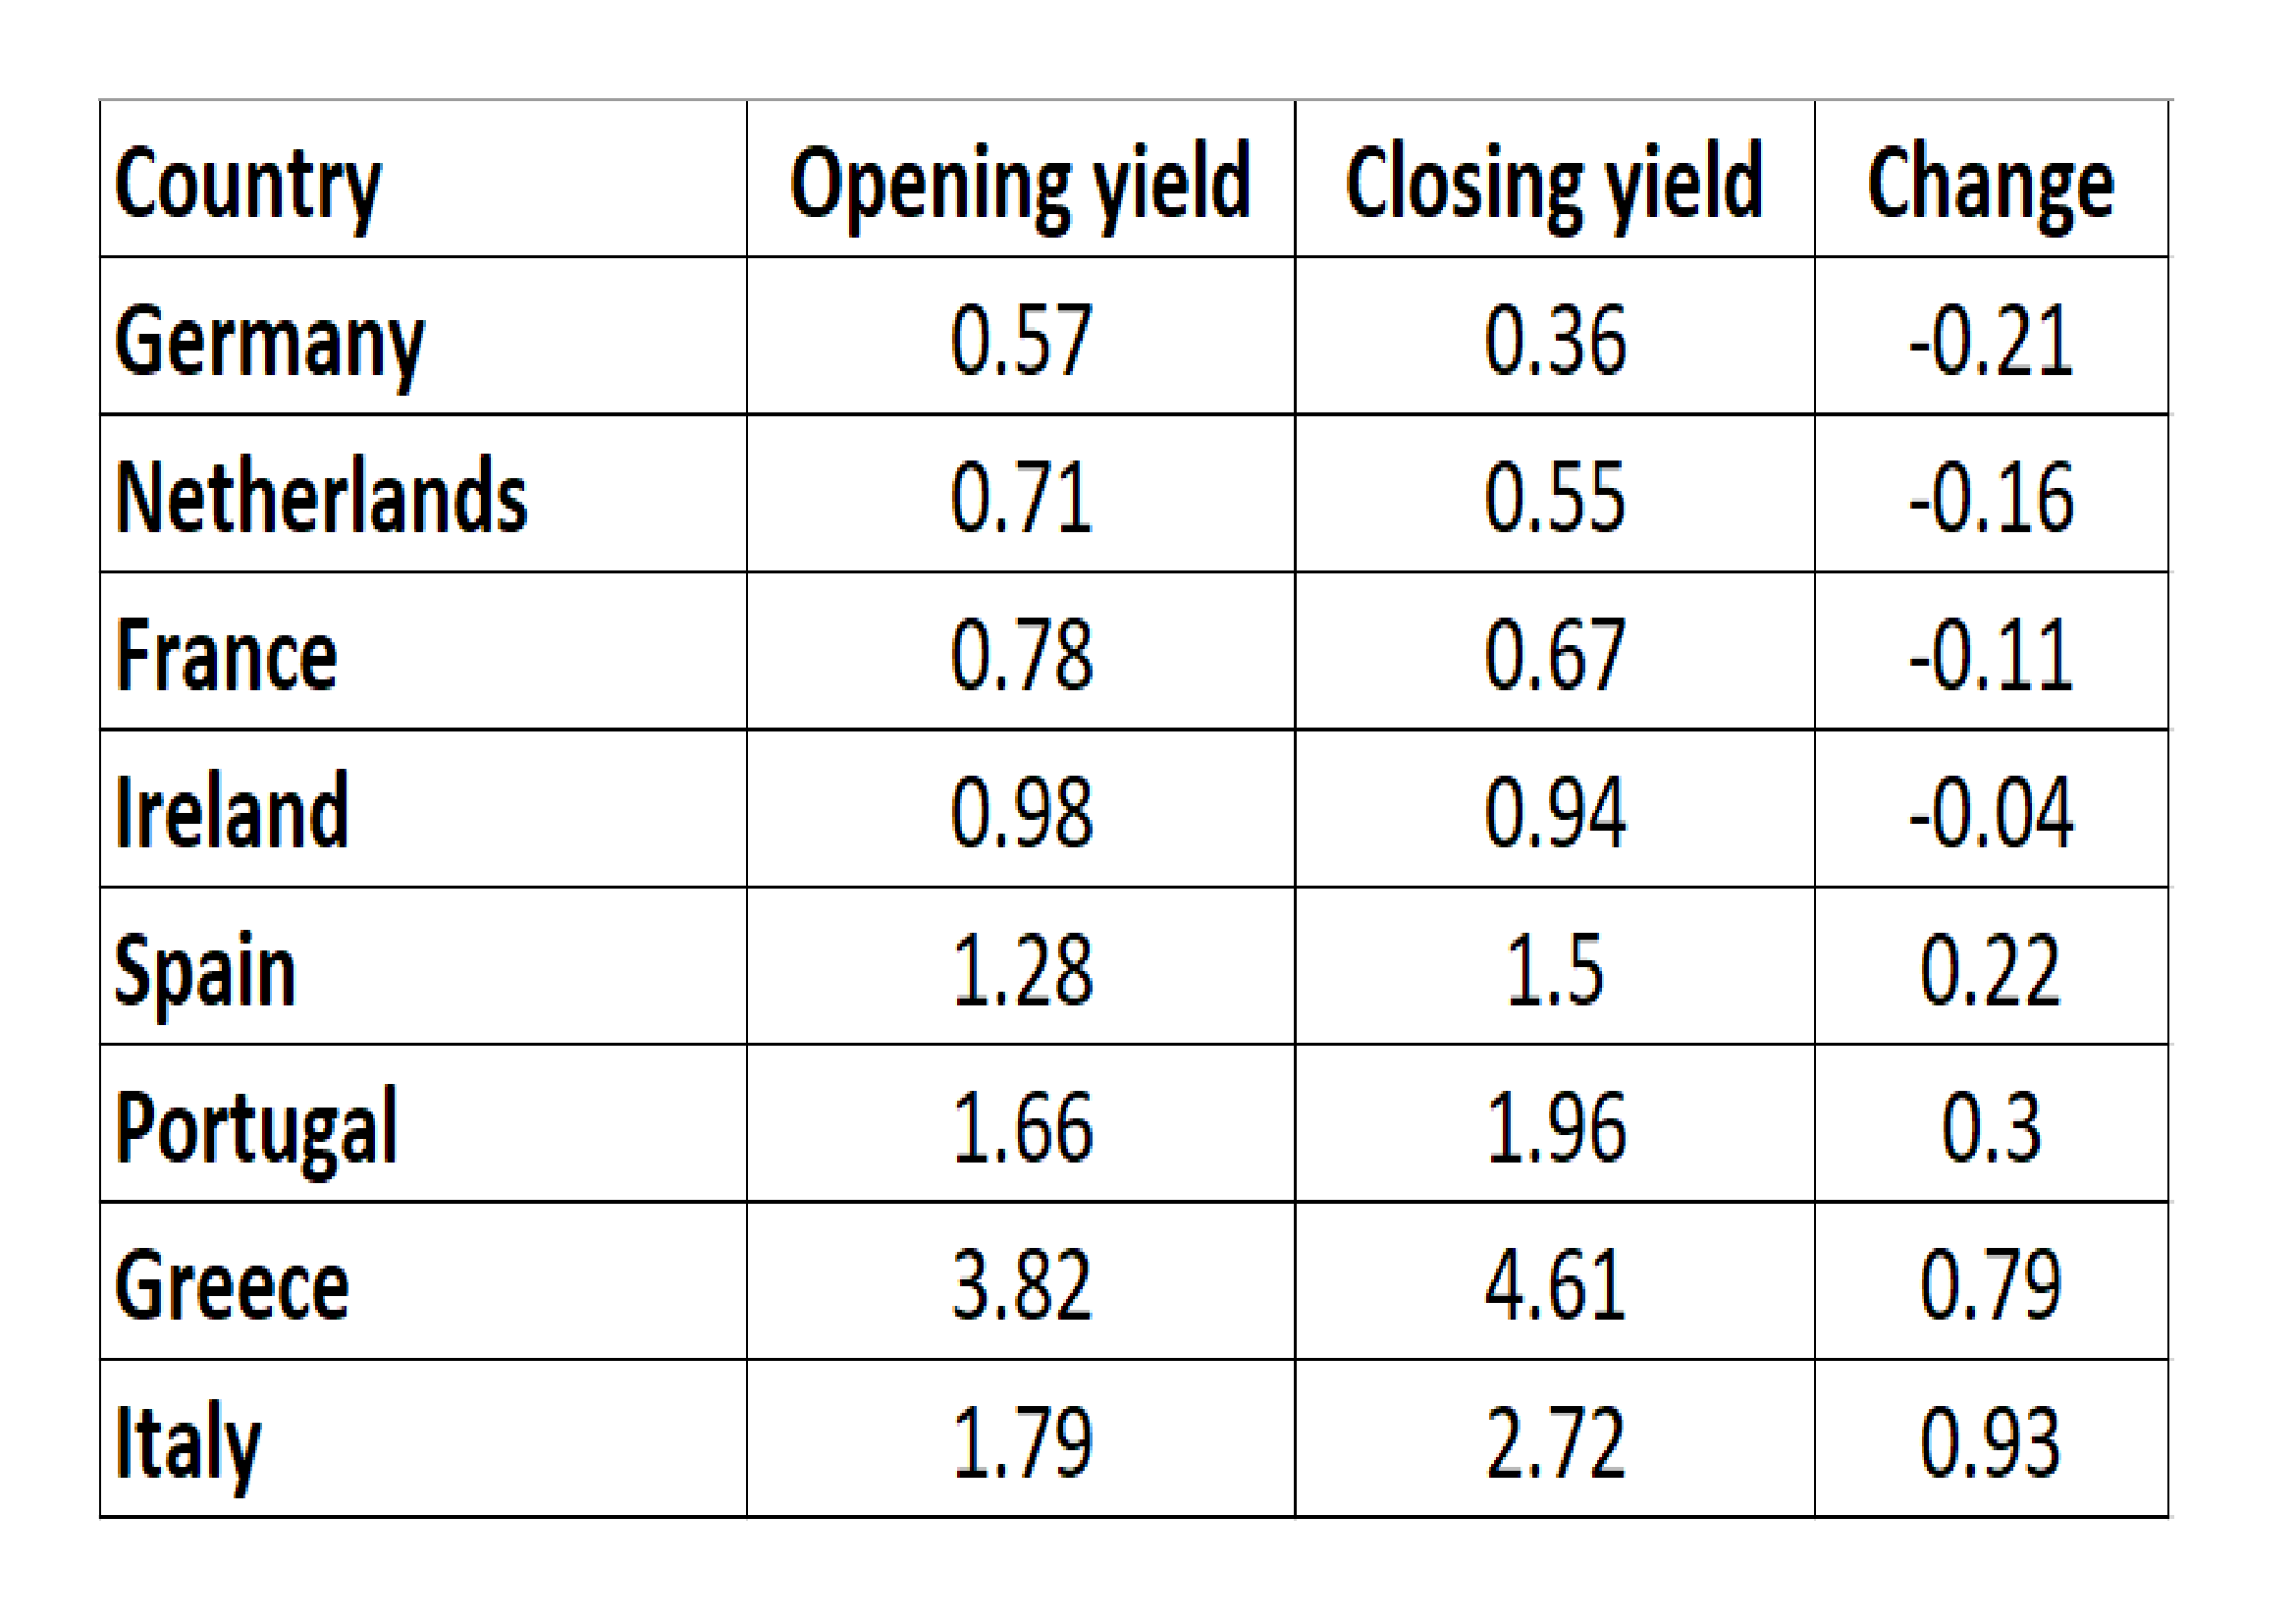
The past six weeks has seen a global fiscal response to the pandemic. Stock markets have declined and credit spreads in corporate bond markets have widened. In European government bonds the pattern has been similar, the migratory flight to quality saw flocks of investors head north, especially into Switzerland and Germany. The simplified chart below shows three data points;
March 9th, when German Bund yields reached their recent nadir,
March 18th, the date investors became spooked by the sheer magnitude of the fiscal response required by EZ governments: and
April 14th, the day on which Italy and Spain announced the first relaxation their lockdown restrictions: –
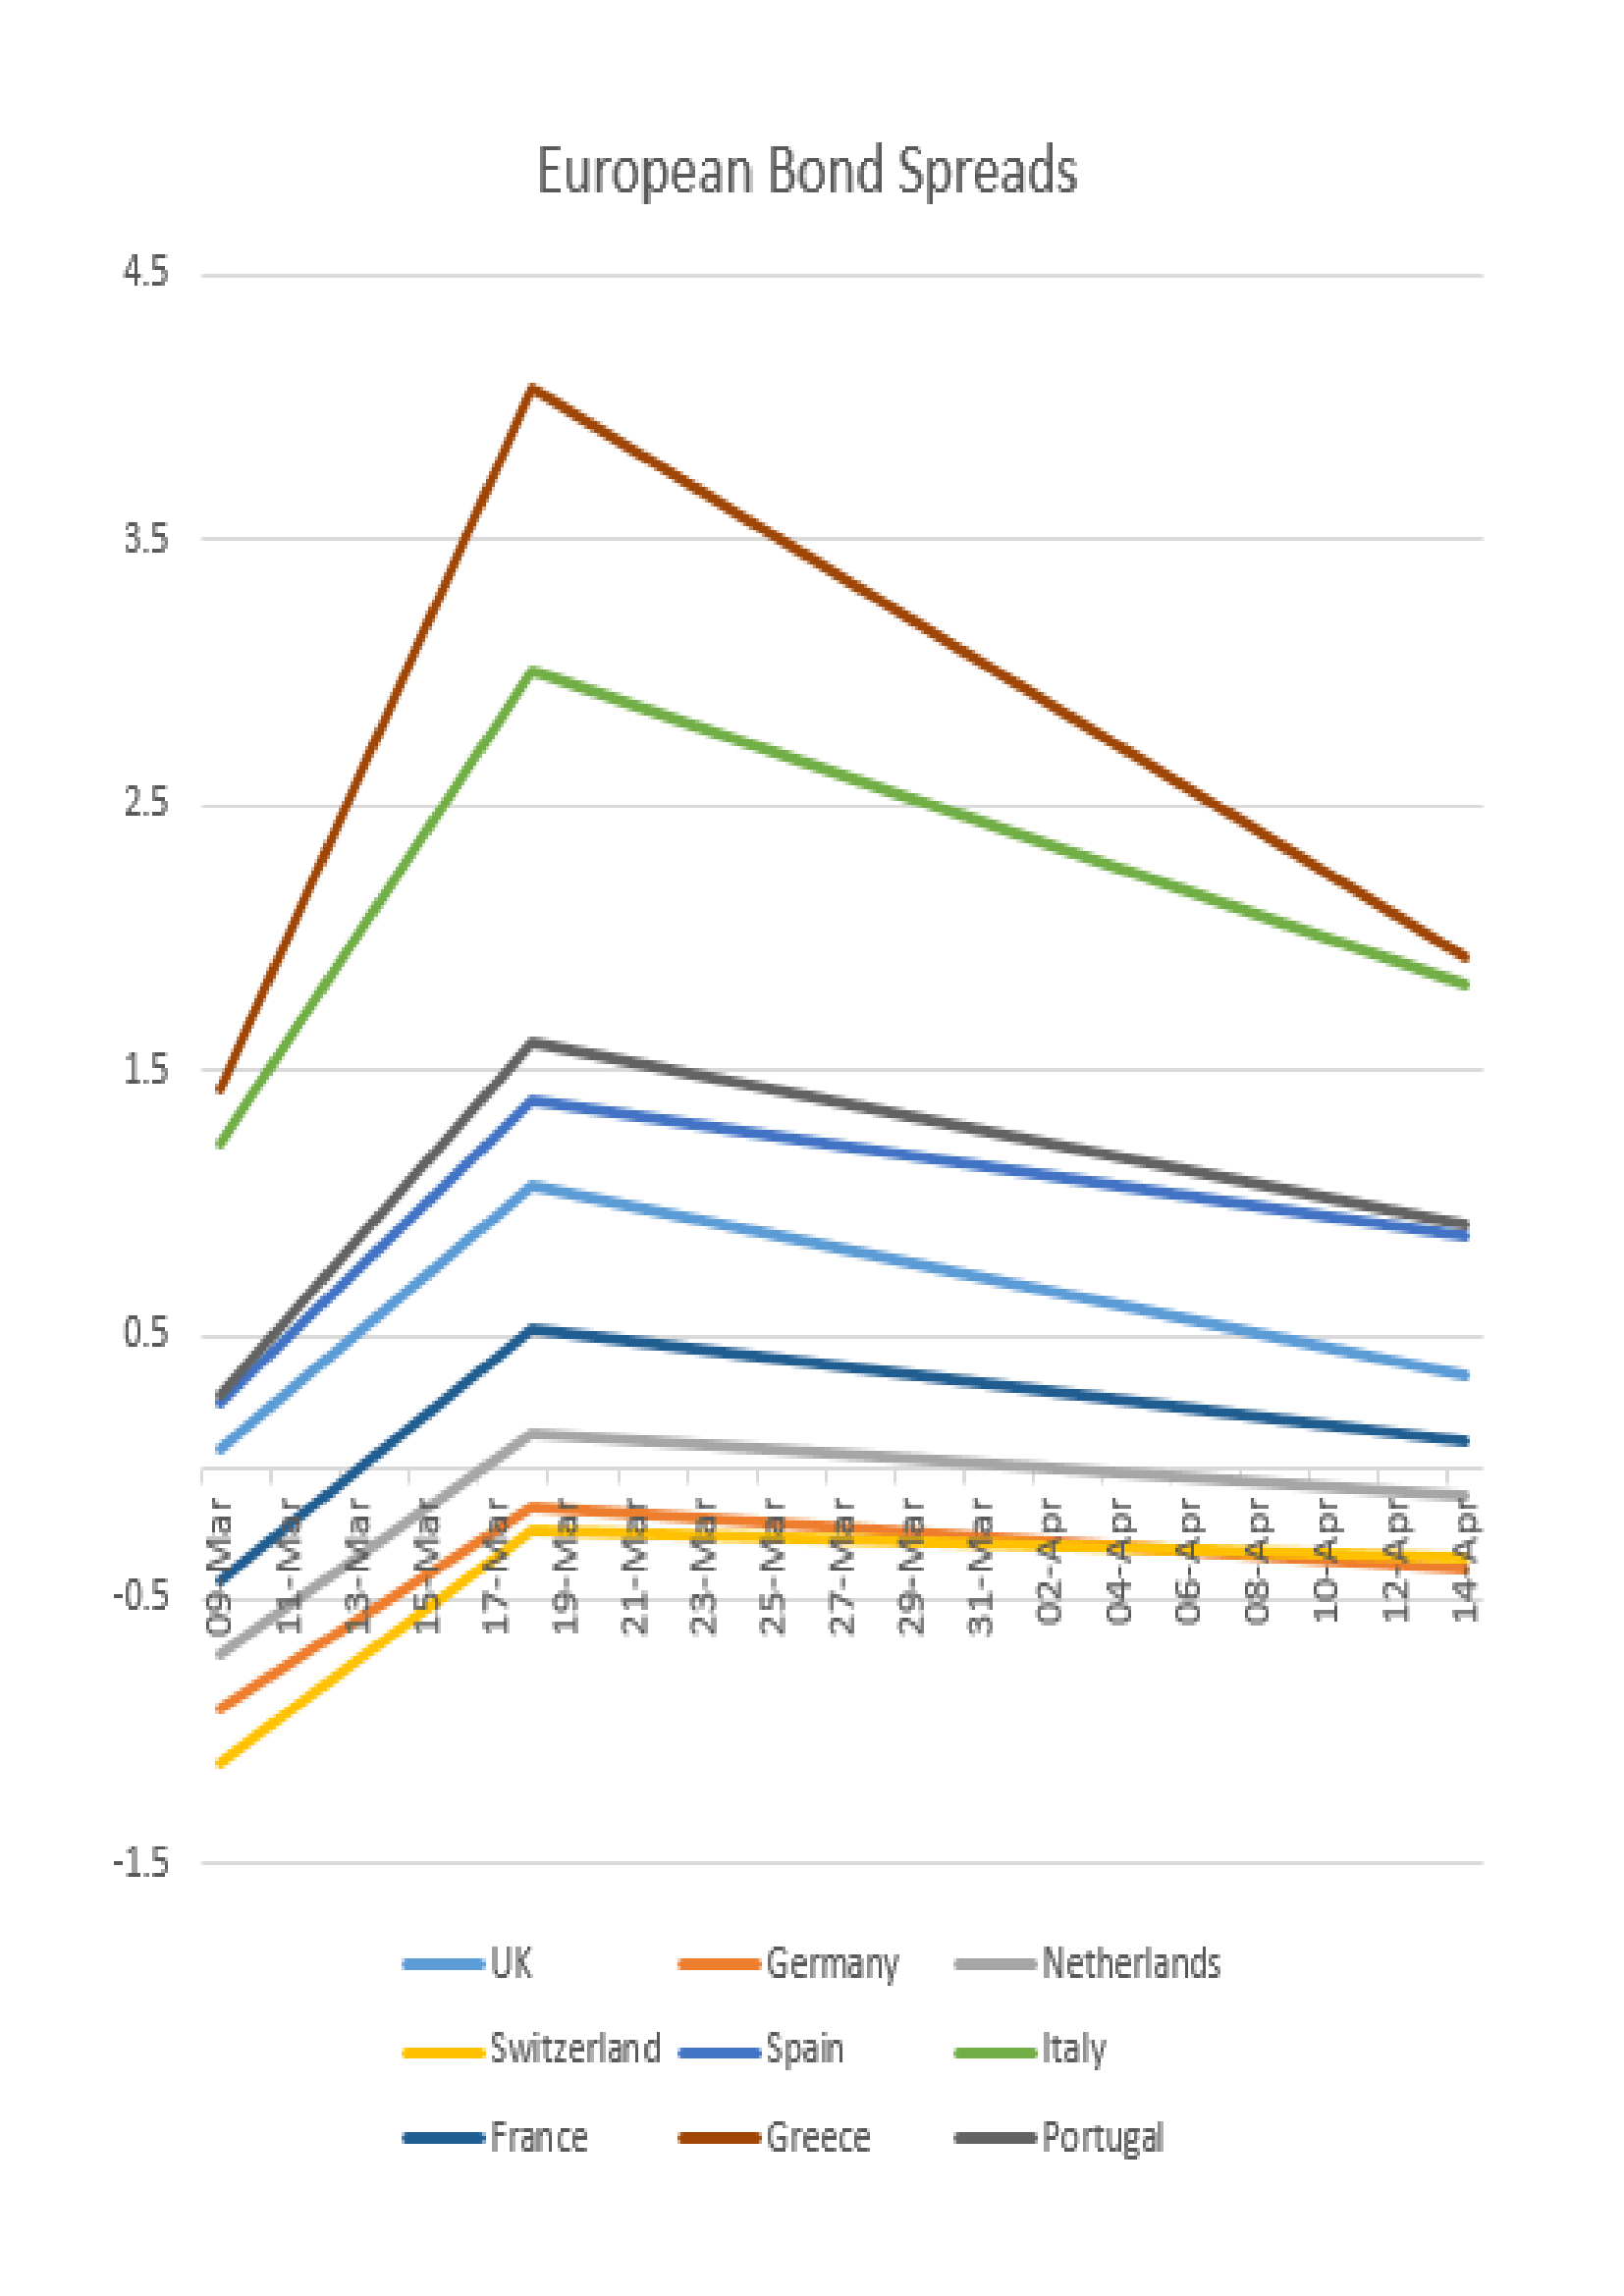
Source: Trading Economics, Investing.com
There are several observations; firstly, even as the lockdown comes towards its end, bond yields are higher, reflecting concerns about the impact of fiscal spending on government budgets as tax receipts collapse. Secondly, German Bund yields are now lower than Swiss Confederation bonds, despite expectations that Germany may end up footing the bill for the lion’s share of government borrowing across the EZ. This may be a reflection of the lower percentage fatality rate in Germany – 2.5% versus 4.4% in Switzerland – or simply a function of the greater liquidity available in the German bond market.
A third observation concerns the higher yielding countries of Greece, Italy, Portugal and Spain. Despite a larger number of Covid-19 infections, Spanish Bonos have maintained their lower yield relative to Italian BTPs, meanwhile, Greek bonds have converged towards Italy and Portuguese bonds trade within 4bp of Spain.
Convergence, divergence and political will
This is not the first macro letter on the topic of EZ bond convergence, the chart below is taken from Macro Letter – No 10 – 25-04-2014 – The Limits Of Convergence – Eurozone Bond Yield Compression Cracks the second of eight previous articles on subject: –
Source: Bloomberg
At that time I suggested three scenarios: –
- Full Banking Union and further federalisation of Europe
- Full Banking Union but limitation of federalisation
- Eurozone break-up
The EZ crisis had finally disapated but the full impact of QE had not yet been appreciated, the table below shows the yield to maturity and spread over German Bunds of the 10 year bonds of Italy, Spain, Greece and Portugal traded on 24th April 2014 (roughly six years ago): –
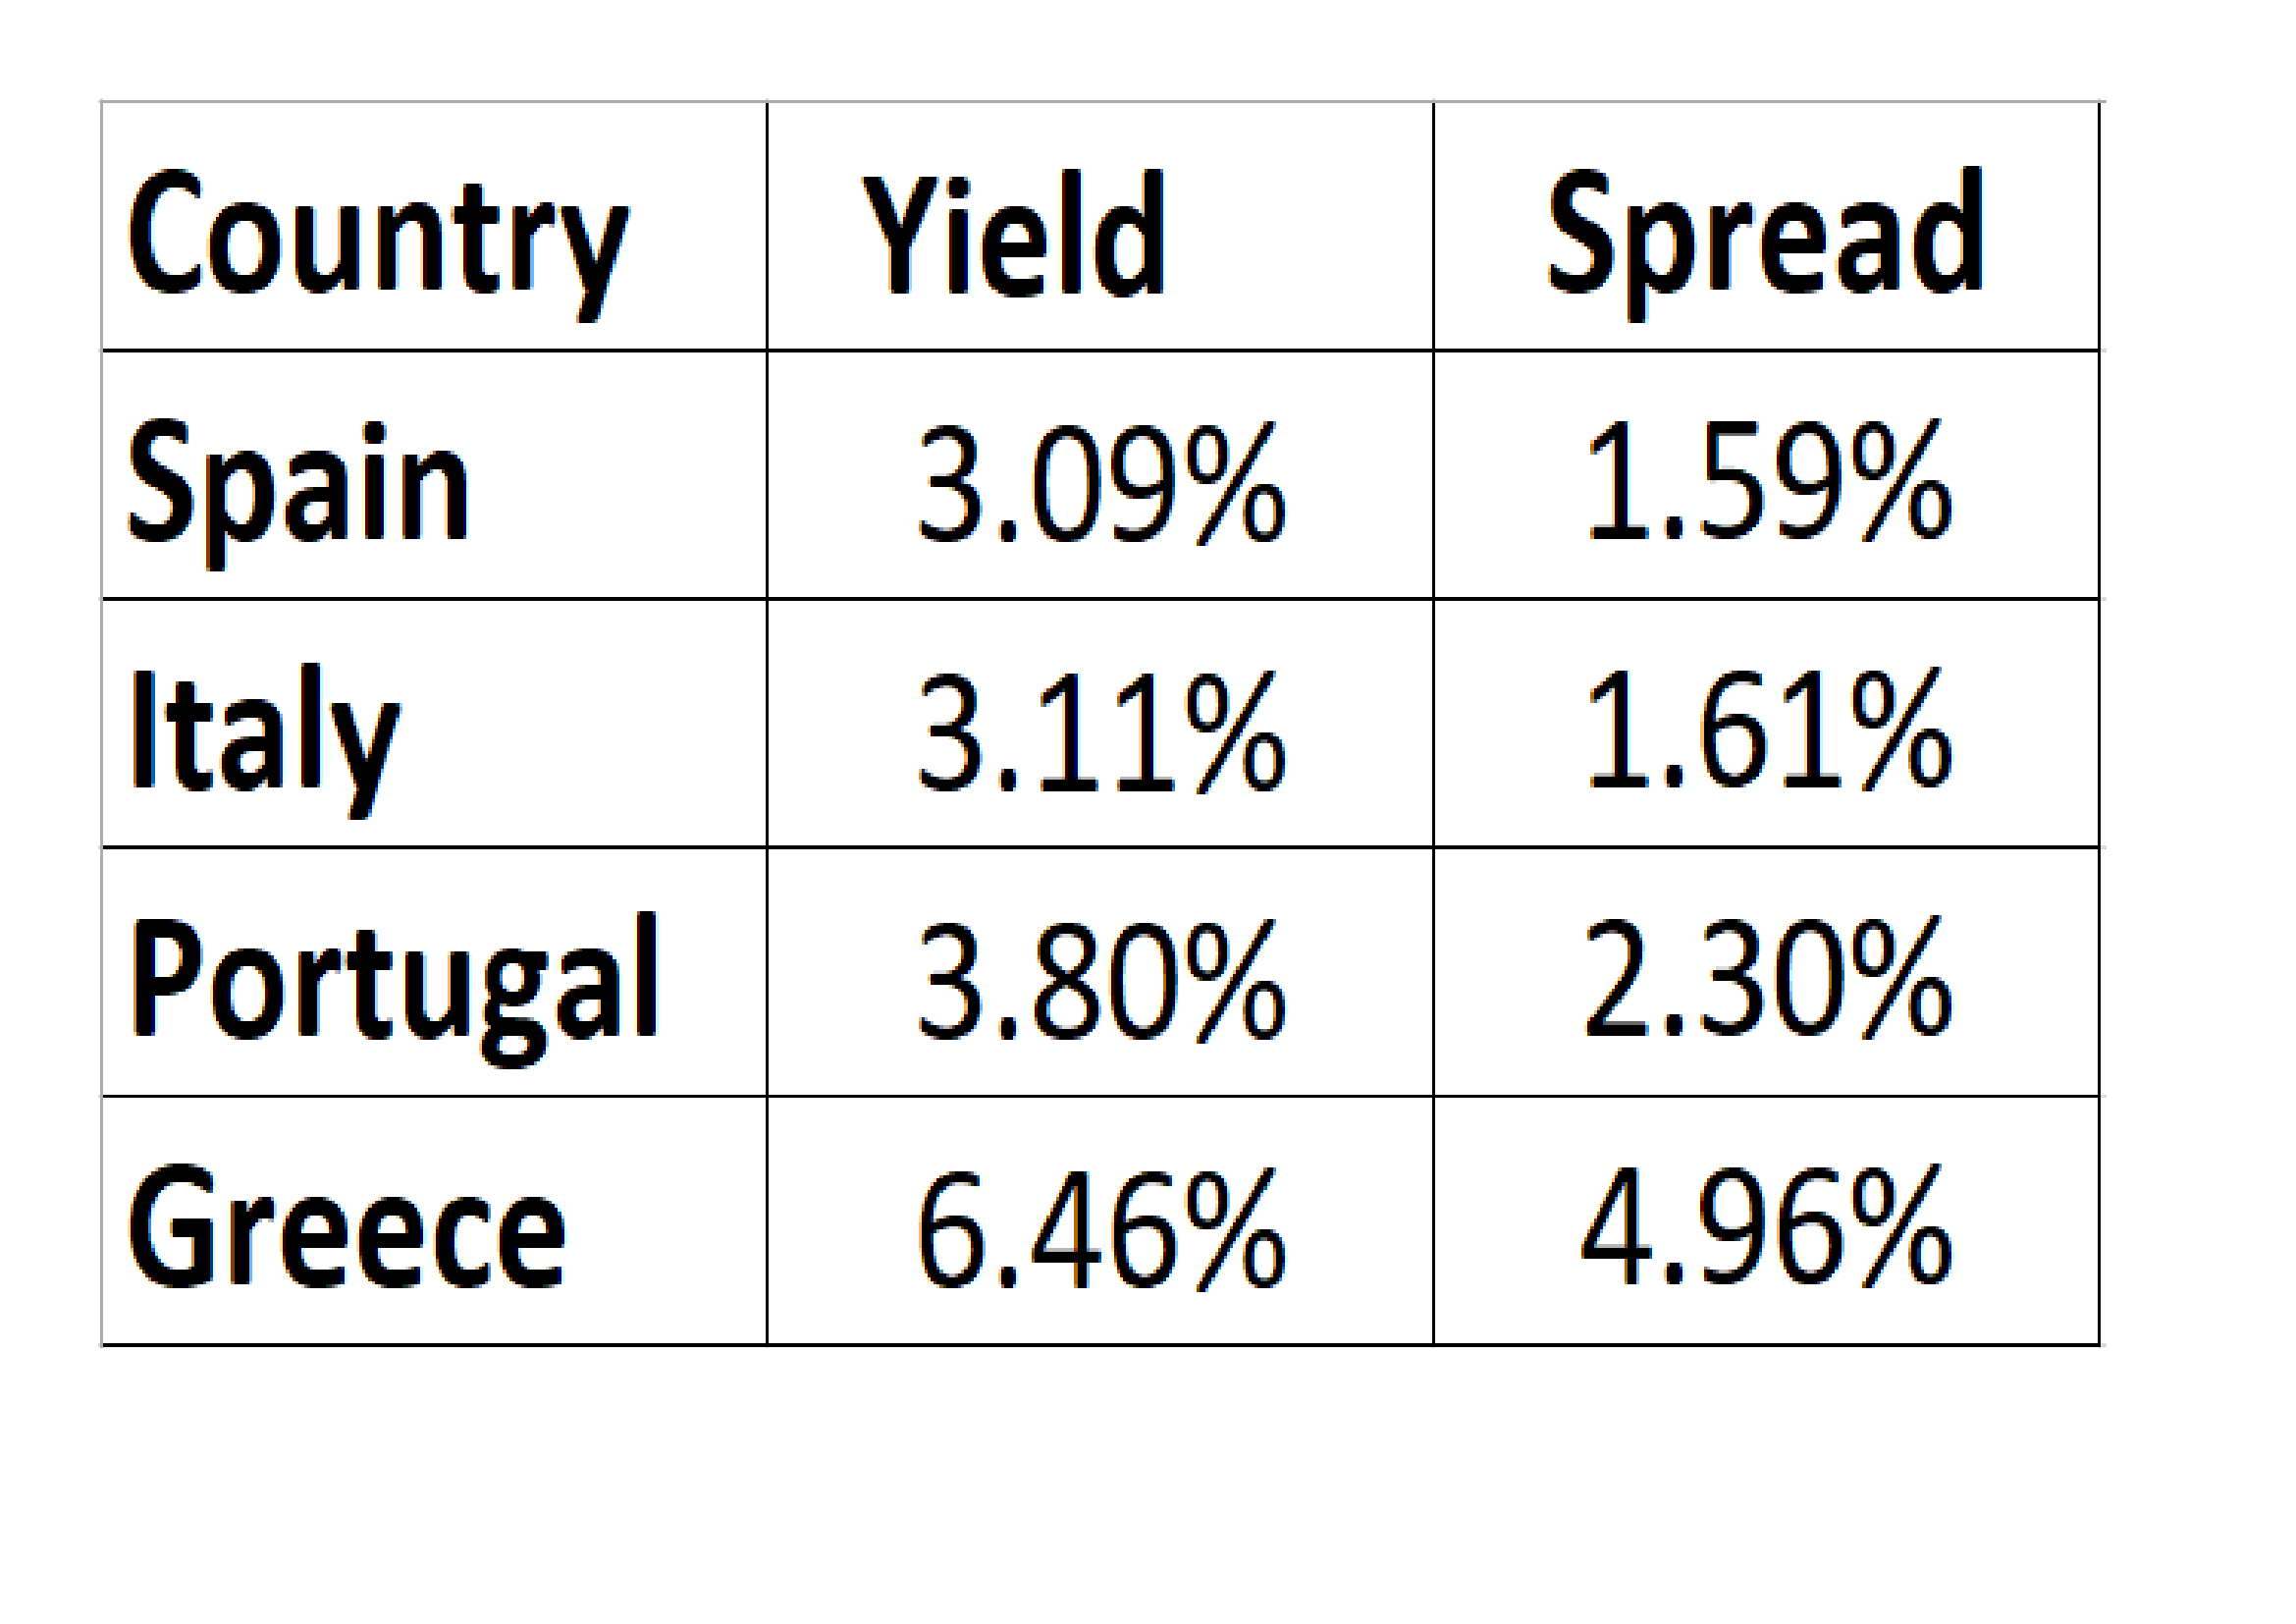
Source: Bloomberg
In April 2014 I saw the second scenario as most likely. I anticipated limited ‘Eurobond’ issuance, this has not yet come to pass, but last week’s stimulus looks like a federal bail-out by any other name. Last month, as the Covid-19 pandemic took hold, the spread between German Bunds and Spanish Bonos touched 1.54%, whilst the spread against Greek bonds reached 4.22% and Portugal, 1.75%. Only Italy fared less well, the Bund/BTP spread reached 3.15; a marked deterioration since 2014.
Conclusions and Investment Opportunities
By the time I penned Macro Letter – No 73 – 24-03-2017 – Can a multi-speed European Union evolve? it was becoming clear that Italy was the focus of concern among fixed income investors. I concluded (a little too late) that: –
Spanish 10yr Bonos represents a better prospect than Italian 10yr BTPs, but one would have to endure negative carry to set up this spread trade: look for opportunities if the spread narrows towards zero.
The spread never returned to parity.
When I last wrote about EZ bonds, I focussed once again on Italy in Macro Letter – No 98 – 08-06-2018 – Italy and the repricing of European government debt. BTP yields had risen to a spread of 1.22% over Spanish Bonos and I expected a retracement. As the chart below reveals, BTP yields rose further before than regained composure: –
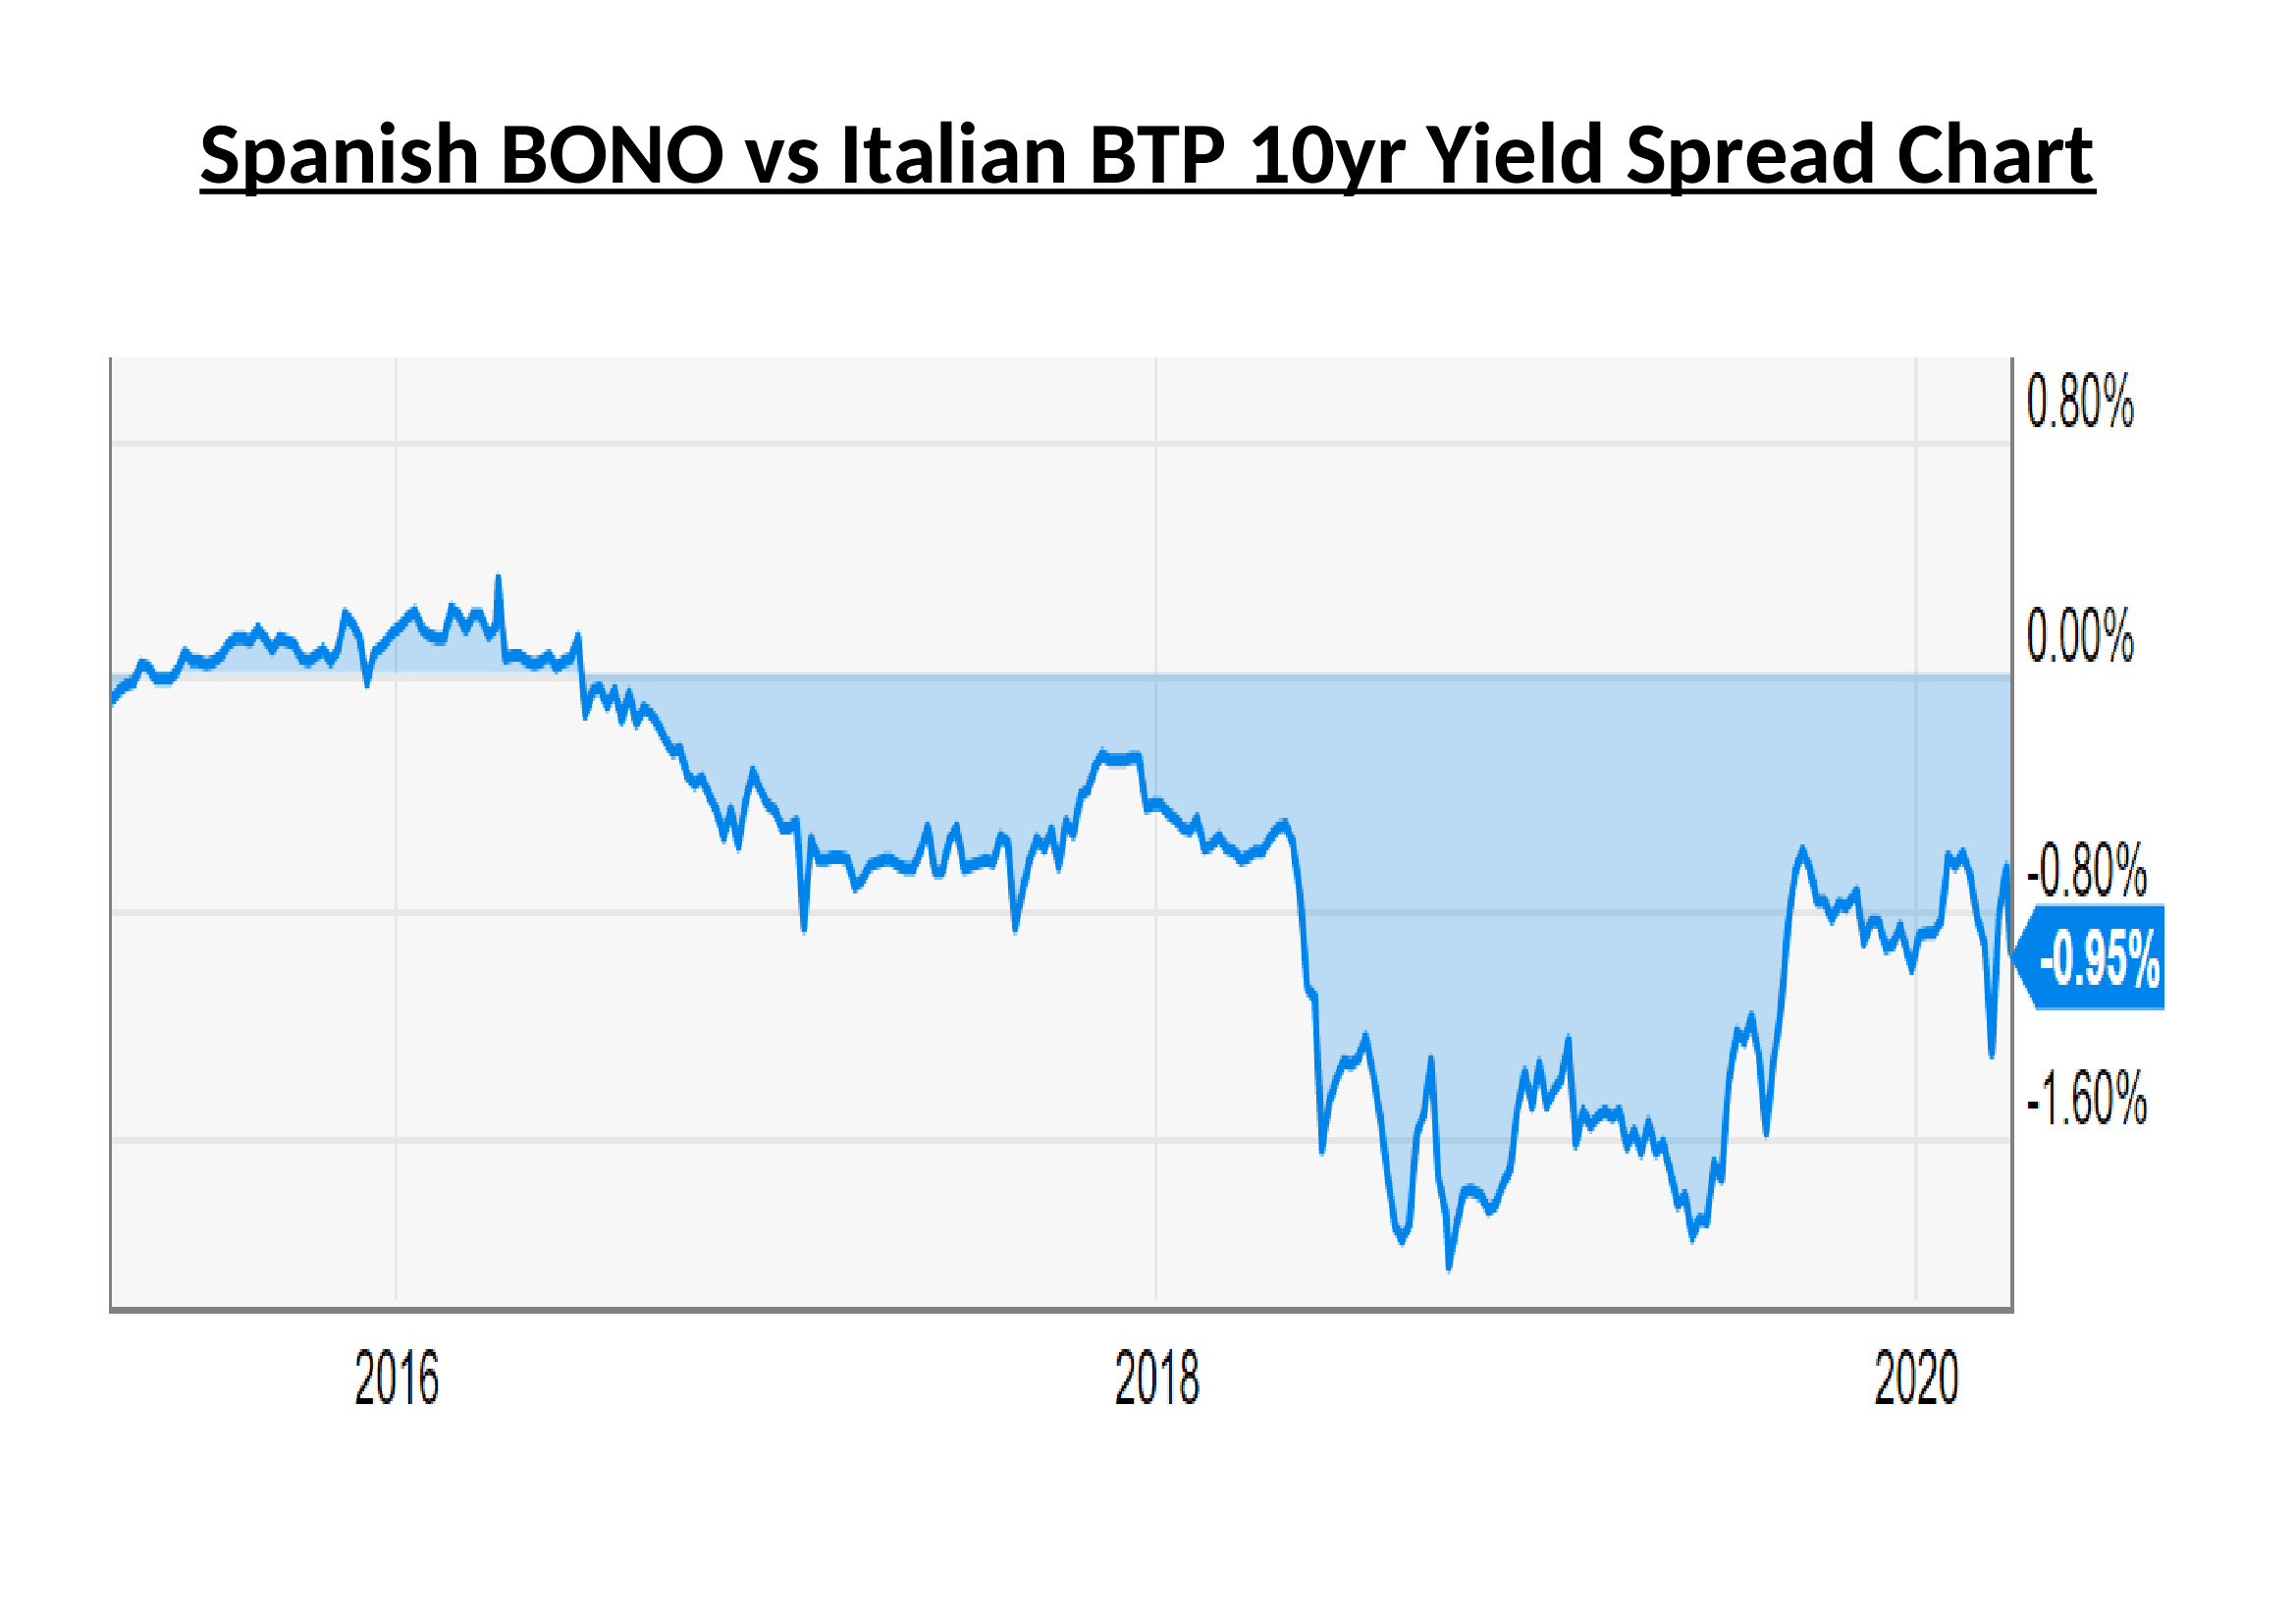
Source: Y-Charts
Eurobonds are still not on the agenda even in a time of pandemic, therefore, Italian indebtedness remains the single greatest risk to the stability of the EZ. The convergence trade is fraught with geopolitical risk as cracks in the European Project are patched and papered over. Now is not the time for revolution, but the ongoing fiscal strain of the pandemic means the policy of issuing Eurobonds backed by a European guarantor will not go away. I expect EZ government bond yield compression accompanied by occasional violent reversals to become the pattern during the next few years, together with increasing political tension between European countries north and south.

The Economic Future of a Negative Interest Rate World
The Economic Future of a Negative Interest Rate World
In this second AIER article I look at the wider implications of negative interest rates.
To read the previous article, please click here
The Pension Fund Apocalypse

The Pension Fund Apocalypse
This is the first of two articles about negative real interest rates.
https://www.aier.org/article/pension-fund-apocalypse


Low yield, no yield, negative yield – Buy now but don’t forget to sell
![]()
Macro Letter – No 118 – 12-06-2019
Low yield, no yield, negative yield – Buy now but don’t forget to sell
- The amount of negative yielding fixed securities has hit a new record
- The Federal Reserve and the ECB are expected to resume easing of interest rates
- Secondary market liquidity for many fixed income securities is dying
- Outstanding debt is setting all-time highs
To many onlookers, since the great financial crisis, the world of fixed income securities has become an alien landscape. Yields on government bonds have fallen steadily across all developed markets. As the chart below reveals, there is now a record US$13trln+ of negative yielding fixed income paper, most of it issued by the governments’ of Switzerland, Japan and the Eurozone: –
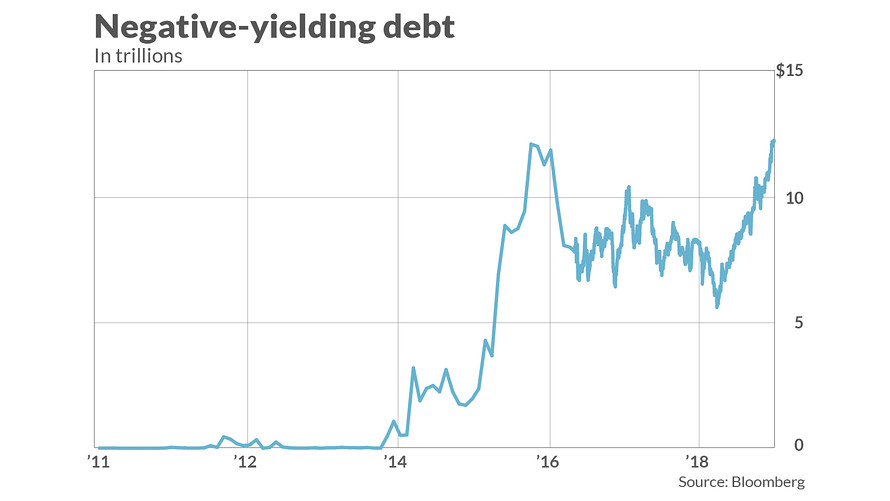
Source: Bloomberg
The percentage of Eurozone government bonds with negative yields is now well above 50% (Eur4.3trln) and more than 35% trades with yields which are more negative than the ECB deposit rate (-0,40%). If one adds in investment grade corporates the total amount of negative yielding bonds rises to Eur5.3trln. Earlier this month, German 10yr Bund yields dipped below the deposit rate for the first time, amid expectations that the ECB will cut rates by another 10 basis points, perhaps as early as September.
The idea that one should make a long-term investment in an asset which will, cumulatively, return less at the end of the investment period, seems nonsensical, except in a deflationary environment. With most central banks committed to an inflation target of around 2%, the Chinese proverb, ‘we live in interesting times,’ springs to mind, yet, negative yielding government bonds are now ‘normal times’ whilst, to the normal fixed income investor, they are anything but interesting. As Keynes famously observed, ‘Markets can remain irrational longer than I can remain solvent.’ Do not fight this trend, yields will probably turn more negative, especially if the ECB cuts rates and a global recession arrives regardless.
Today, government and investment grade corporate debt has been joined by a baker’s dozen of short-dated high yield Euro names. This article from IFR – ‘High-yield’ bonds turn negative – explains: –
About 2% of the euro high-yield universe is now negative yielding, according to Bank of America Merrill Lynch.
That percentage would rise to 10% if average yields fall by a further 35bp, said Barnaby Martin, European credit strategist at the bank.
He said the first signs of negative yielding high-yield bonds emerged about two weeks ago in the wake of Mario Draghi’s speech in Sintra where the ECB president hinted at a further dose of bond buying via the central bank’s corporate sector purchase programme. There are now more than 10 high-yield bonds in negative territory…
The move to negative yields for European high-yield credits is unprecedented; it didn’t even happen in 2016 when the ECB began its bond buying programme.
During Q4, 2018, credit spreads widened (and stock markets declined) amid expectations of further Federal Reserve tightening and an end to ECB QE. Now, stoked by fears of a global recession, rate expectation have reversed. The Fed are likely to ease, perhaps as early as this month. The ECB, under their new broom, Christine Lagarde, is expected to embrace further QE. The corporate sector purchase program (CSPP) which commenced in June 2016, already holds Eur177.8bln of corporate bonds, but increased corporate purchases seem likely; it is estimated that the ECB holds between 25% and 30% of the outstanding Eurozone government bond in issue, near to its self-imposed ceiling of 33%. Whilst the amount in issues is less, the central bank has more flexibility with Supranational and Euro denominated non-EZ Sovereigns (50%) and greater still with corporates (70%). In this benign interest rate environment, a continued compression of credit spreads is to be expected.
Yield compression has been evident in Eurozone government bonds for decades, but now a change in relationship is starting become evident. Even if the ECB does not increase the range of corporate bonds it purchases, its influence, like the rising tide, will float all ships. Bund yields are likely to remain most negative and the government obligations of Greece, the least, but, somewhere between these two poles, corporate bonds will begin to assume the mantle of the ‘nearly risk-free.’ With many Euro denominated high-yield issues trading below the yield offered for comparable maturity Italian BTPs, certain high-yield corporate credit is a de facto alternative to poorer quality government paper.
The chart below is a snap-shot of the 3m to 3yr Eurozone yield curve. The solid blue line shows the yield of AAA rated bonds, the dotted line, an average of all bonds: –
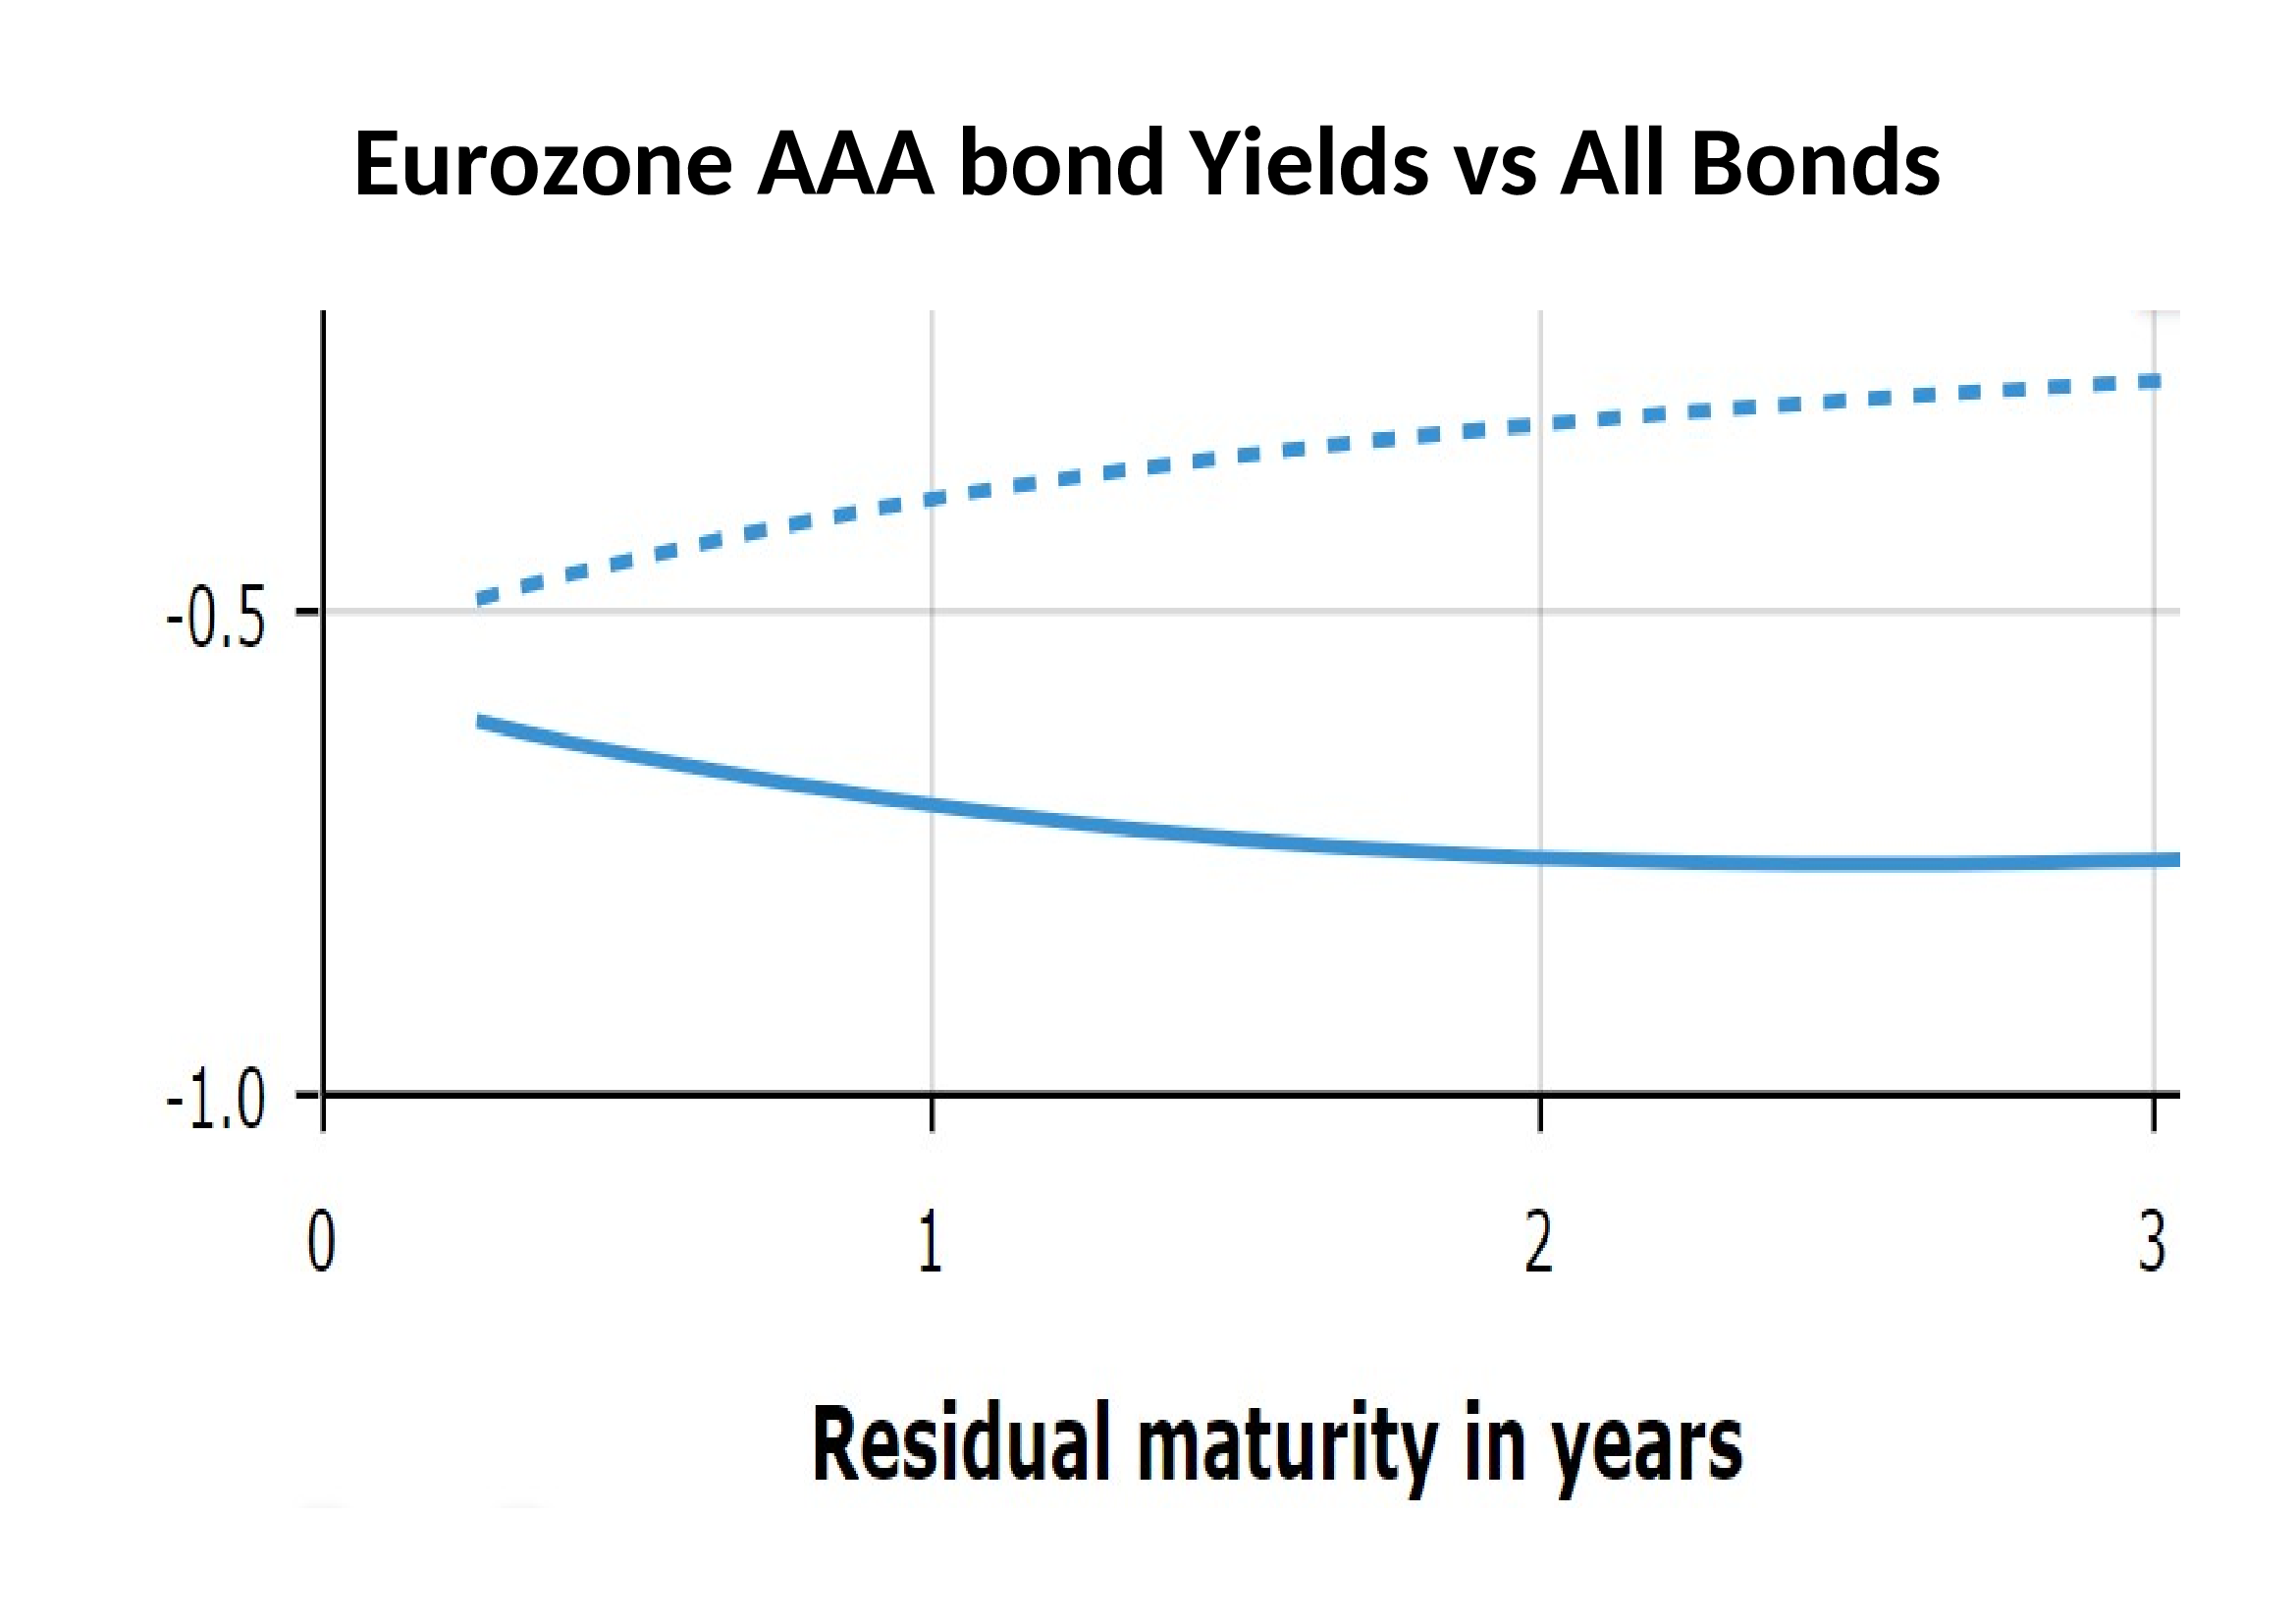
Source: ECB
It is interesting to note that the yield on AAA bonds, with a maturity of less than two years, steadily becomes less negative, whilst the aggregated yield of all bonds continues to decline.
The broader high-yield market still offers positive yield but the Eurozone is likely to be the domicile of choice for new issuers, since Euro high-yield now trades at increasingly lower yields than the more liquid US market, the liquidity tail is wagging the dog: –
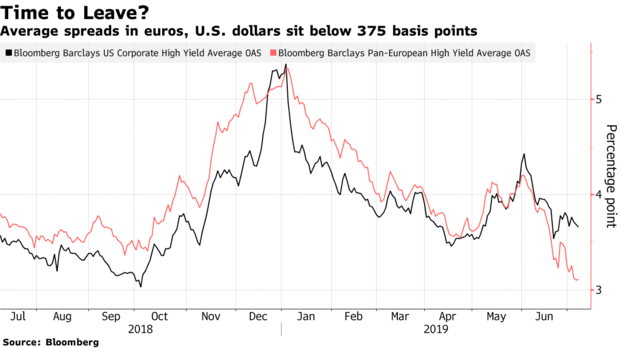
Source: Bloomberg, Barclays
The yield compression within the Eurozone has been more dramatic but it has been mirrored by the US where the spread between BBB and BB narrowed to a 12 year low of 60 basis points this month.
Wither away the dealers?
Forgotten, amid the inexorable bond rally, is dealer liquidity, yet it is essential, especially when investors rush for the exit simultaneously. For corporate bond market-makers and brokers the impact of QE has been painful. If the ECB is a buyer of a bond (and they pre-announce their intentions) then the market is guaranteed to rise. Liquidity is stifled in a game of devil take the hindmost. Alas, non-eligible issues, which the ECB does not deign to buy, find few natural buyers, so few institutions can justify purchases when credit default risk remains under-priced and in many cases the yield to maturity is negative.
An additional deterrent is the cost of holding an inventory of fixed income securities. Capital requirements for other than AAA government paper have increased since 2009. More damaging still is the negative carry across a wide range of instruments. In this environment, liquidity is bound to be impaired. The danger is that the underlying integrity of fixed income markets has been permanently impaired, without effective price intermediation there is limited price discovery: and without price discovery there is a real danger that there will be no firm, ‘dealable’ prices when they are needed most.
In this article from Bloomberg – A Lehman Survivor Is Prepping for the Next Credit Downturn – the interviewee, Pilar Gomez-Bravo of MFS Investment Management, discusses the problem of default risk in terms of terms of opacity (the emphasis is mine): –
Over a third of private high-yield companies in Europe, for example, restrict access to financial data in some way, according to Bloomberg analysis earlier this year. Buyers should receive extra compensation for firms that curb access to earnings with password-protected sites, according to Gomez-Bravo.
Borrowers still have the upper hand in the U.S. and Europe. Thank cheap-money policies and low defaults. Speculation the European Central Bank is preparing for another round of quantitative easing is spurring the rally — and masking fragile balance sheets.
Borrowers still have the upper hand indeed, earlier this month Italy issued a Eur3bln tranche of its 2.8% coupon 50yr BTP; there were Eur17bln of bids from around 200 institutions (bid/cover 5.66, yield 2.877%). German institutions bought 35% of the issue, UK investors 22%. The high bid/cover ratio is not that surprising, only 1% of Euro denominated investment grade paper yields more than 2%.
I am not alone in worrying about the integrity of the bond markets in the event of another crisis, last September ESMA – Liquidity in EU fixed income markets – Risk indicators and EU evidence concluded: –
Episodes of short-term volatility and liquidity stress across several markets over the past few years have increased concerns about the worsening of secondary market liquidity, in particular in the fixed income segment…
…our findings show that market liquidity has been relatively ample in the sovereign segment, potentially also due to the effects of supportive economic policies over more recent years. This is different from our findings in the corporate bond market, where in recent years we did not find systematic and significant drop in market liquidity but we observed episodes of decreasing market liquidity when market conditions deteriorated…
We find that in the sovereign bond segment, bonds that have a benchmark status and are characterised by larger outstanding amounts tend to be more liquid while market volatility is negatively related to market liquidity. Outstanding amounts are the main bond-level drivers in the corporate bond segment…
With reference to corporate bond markets, the sensitivity of bond liquidity to bond-specific and market factors is larger when financial markets are under stress. In particular, bonds characterised by more volatile market liquidity are found to be more vulnerable in periods of market stress. This empirical result is consistent with the market liquidity indicators developed for corporate bonds pointing at episodes of decreasing market liquidity when wider market conditions deteriorate.
ESMA steer clear of discussing negative yields and their impact on the profitability of market-making, but the BIS annual economic report, published last month, has no such qualms (the emphasis is mine): –
Household debt has reached new historical peaks in a number of economies that were not at the heart of the GFC, and house price growth has in many cases stalled. For a group of advanced small open economies, average household debt amounted to 101% of GDP in late 2018, over 20 percentage points above the pre-crisis level… Moreover, household debt service ratios, capturing households’ principal and interest payments in relation to income, remained above historical averages despite very low interest rates…
…corporate leverage remained close to historical highs in many regions. In the United States in particular, the ratio of debt to earnings in listed firms was above the previous peak in the early 2000s. Leverage in emerging Asia was still higher, albeit below the level immediately preceding the 1990s crisis. Lending to leveraged firms – i.e. those borrowing in either high-yield bond or leveraged loan markets – has become sizeable. In 2018, leveraged loan issuance amounted to more than half of global publicly disclosed loan issuance loans excluding credit lines.
… following a long-term decline in credit quality since 2000, the share of issuers with the lowest investment grade rating (including financial firms) has risen from around 14% to 45% in Europe and from 29% to 36% in the United States. Given widespread investment grade mandates, a further drop in ratings during an economic slowdown could lead investors to shed large amounts of bonds quickly. As mutual funds and other institutional investors have increased their holdings of lower-rated debt, mark-to-market losses could result in fire sales and reduce credit availability. The share of bonds with the lowest investment grade rating in investment grade corporate bond mutual fund portfolios has risen, from 22% in Europe and 25% in the United States in 2010 to around 45% in each region.
How financial conditions might respond depends also on how exposed banks are to collateralised loan obligations (CLOs). Banks originate more than half of leveraged loans and hold a significant share of the least risky tranches of CLOs. Of these holdings, US, Japanese and European banks account for around 60%, 30% and 10%, respectively…
…the concentration of exposures in a small number of banks may result in pockets of vulnerability. CLO-related losses could reveal that the search-for-yield environment has led to an underpricing and mismanagement of risks…
In the euro area, the deterioration of the growth outlook was more evident, and so was its adverse impact on an already fragile banking sector. Price-to-book ratios fell further from already depressed levels, reflecting increasing concerns about banks’ health…
Unfortunately, bank profitability has been lacklustre. In fact, as measured, for instance, by return-on-assets, average profitability across banks in a number of advanced economies is substantially lower than in the early 2000s. Within this group, US banks have performed considerably better than those in the euro area, the United Kingdom and Japan…
…persistently low interest rates and low growth reduce profits. Compressed term premia depress banks’ interest rate margins from maturity transformation. Low growth curtails new loans and increases the share of non-performing ones. Therefore, should growth decline and interest rates continue to remain low following the pause in monetary policy normalisation, banks’ profitability could come under further pressure.
Conclusion and investment opportunities
Back in 2006, when commodity investing, as part of a diversified portfolio, was taking the pension fund market by storm, I gave a series of speeches in which I beseeched fund managers to consider carefully before investing in commodities, an asset class which had for more than 150 years exhibited a negative expected real return.
An astonishingly large percentage of fixed income securities are exhibiting similar properties today. My advice, then for commodities and today, for fixed income securities, is this, ‘By all means buy, but remember, this is a trading asset, its long-term expected return is negative; in other words, please, don’t forget to sell.’
Central bank balance sheet reductions – will anyone follow the Fed?
![]()
Macro Letter – No 110 – 15-02-2019
Central bank balance sheet reductions – will anyone follow the Fed?
- The next wave of QE will be different, credit spreads will be controlled
- The Federal Reserve may continue to tighten but few other CB’s can follow
- ECB balance sheet reduction might occur if a crisis does not arrive first
- Interest rates are likely to remain structurally lower than before 2008
The Federal Reserve’s response to the great financial recession of 2008/2009 was swift by comparison with that of the ECB; the BoJ was reticent, too, due to its already extended balance sheet. Now that the other developed economy central banks have fallen into line, the question which dominates markets is, will other central banks have room to reverse QE?
Last month saw the publication of a working paper from the BIS – Risk endogeneity at the lender/investor-of-last-resort – in which the authors investigate the effect of ECB liquidity provision, during the Euro crisis of 2010/2012. They also speculate about the challenge balance sheet reduction poses to systemic risk. Here is an extract from the non-technical summary (the emphasis is mine): –
The Eurosystem’s actions as a large-scale lender- and investor-of-last-resort during the euro area sovereign debt crisis had a first-order impact on the size, composition, and, ultimately, the credit riskiness of its balance sheet. At the time, its policies raised concerns about the central bank taking excessive risks. Particular concern emerged about the materialization of credit risk and its effect on the central bank’s reputation, credibility, independence, and ultimately its ability to steer inflation towards its target of close to but below 2% over the medium term.
Against this background, we ask: Can central bank liquidity provision or asset purchases during a liquidity crisis reduce risk in net terms? This could happen if risk taking in one part of the balance sheet (e.g., more asset purchases) de-risks other balance sheet positions (e.g., the collateralized lending portfolio) by a commensurate or even larger amount. How economically important can such risk spillovers be across policy operations? Were the Eurosystem’s financial buffers at all times sufficiently high to match its portfolio tail risks? Finally, did past operations differ in terms of impact per unit of risk?…
We focus on three main findings. First, we find that (Lender of last resort) LOLR- and (Investor of last resort) IOLR-implied credit risks are usually negatively related in our sample. Taking risk in one part of the central bank’s balance sheet (e.g., the announcement of asset purchases within the Securities Market Programme – SMP) tended to de-risk other positions (e.g., collateralized lending from previous – longer-term refinancing operations LTROs). Vice versa, the allotment of two large-scale (very long-term refinancing operations) VLTRO credit operations each decreased the one-year-ahead expected shortfall of the SMP asset portfolio. This negative relationship implies that central bank risks can be nonlinear in exposures. In bad times, increasing size increases risk less than proportionally. Conversely, reducing balance sheet size may not reduce total risk by as much as one would expect by linear scaling. Arguably, the documented risk spillovers call for a measured approach towards reducing balance sheet size after a financial crisis.
Second, some unconventional policy operations did not add risk to the Eurosystem’s balance sheet in net terms. For example, we find that the initial OMT announcement de-risked the Eurosystem’s balance sheet by e41.4 bn in 99% expected shortfall (ES). As another example, we estimate that the allotment of the first VLTRO increased the overall 99% ES, but only marginally so, by e0.8 bn. Total expected loss decreased, by e1.4 bn. We conclude that, in extreme situations, a central bank can de-risk its balance sheet by doing more, in line with Bagehot’s well-known assertion that occasionally “only the brave plan is the safe plan.” Such risk reductions are not guaranteed, however, and counterexamples exist when risk reductions did not occur.
Third, our risk estimates allow us to study past unconventional monetary policies in terms of their ex-post ‘risk efficiency’. Risk efficiency is the notion that a certain amount of expected policy impact should be achieved with a minimum level of additional balance sheet risk. We find that the ECB’s Outright Monetary Transactions – OMT program was particularly risk efficient ex-post since its announcement shifted long-term inflation expectations from deflationary tendencies toward the ECB’s target of close to but below two percent, decreased sovereign benchmark bond yields for stressed euro area countries, while lowering the risk inherent in the central bank’s balance sheet. The first allotment of VLTRO funds appears to have been somewhat more risk-efficient than the second allotment. The SMP, despite its benefits documented elsewhere, does not appear to have been a particularly risk-efficient policy measure.
This BIS research is an important assessment of the effectiveness of ECB QE. Among other things, the authors find that the ‘shock and awe’ effectiveness of the first ‘quantitative treatment’ soon diminished. Liquidity is the methadone of the market, for QE to work in future, a larger and more targeted dose of monetary alchemy will be required.
The paper provides several interesting findings, for example, the Federal Reserve ‘taper-tantrum’ of 2013 and the Swiss National Bank decision to unpeg the Swiss Franc in 2015, did not appear to influence markets inside the Eurozone, once ECB president, Mario Draghi, had made its intensions plain. Nonetheless, the BIS conclude that (emphasis, once again, is mine): –
…collateralized credit operations imply substantially less credit risks (by at least one order of magnitude in our crisis sample) than outright sovereign bond holdings per e1 bn of liquidity owing to a double recourse in the collateralized lending case. Implementing monetary policy via credit operations rather than asset holdings, whenever possible, therefore appears preferable from a risk efficiency perspective. Second, expanding the set of eligible assets during a liquidity crisis could help mitigate the procyclicality inherent in some central bank’s risk protection frameworks.
In other words, rather than exacerbate the widening of credit spreads by purchasing sovereign debt, it is preferable for central banks to lean against the ‘flight to quality’ tendency of market participants during times of stress.
The authors go on to look at recent literature on the stress-testing of central bank balance sheets, mainly focussing on analysis of the US Federal Reserve. Then they review ‘market-risk’ methods as a solution to the ‘credit-risk’ problem, employing non-Gaussian methods – a prescient approach after the unforeseen events of 2008.
Bagehot thou shouldst be living at this hour (with apologies to Wordsworth)
The BIS authors refer on several occasions to Bagehot. I wonder what he would make of the current state of central banking? Please indulge me in this aside.
Walter Bagehot (1826 to 1877) was appointed by Richard Cobden as the first editor of the Economist. He is also the author of perhaps the best known book on the function of the 19th century money markets, Lombard Street (published in 1873). He is famed for inventing the dictum that a central bank should ‘lend freely, at a penalty rate, against good collateral.’ In fact he never actually uttered these words, they have been implied. Even the concept of a ‘lender of last resort’, to which he refers, was not coined by him, it was first described by Henry Thornton in his 1802 treatise – An Enquiry into the Nature and Effects of the Paper Credit of Great Britain.
To understand what Bagehot was really saying in Lombard Street, this essay by Peter Conti-Brown – Misreading Walter Bagehot: What Lombard Street Really Means for Central Banking – provides an elegant insight: –
Lombard Street was not his effort to argue what the Bank of England should do during liquidity crises, as almost all people assume; it was an argument about what the Bank of England should openly acknowledge that it had already done.
Bagehot was a classical liberal, an advocate of the gold standard; I doubt he would approve of the nature of central banks today. He would, I believe, have thrown his lot in with the likes of George Selgin and other proponents of Free Banking.
Conclusion and Investment Opportunities
Given the weakness of European economies it seems unlikely that the ECB will be able to follow the lead of the Federal Reserve and raise interest rates in any meaningful way. The unwinding of, at least a portion of, QE might be easier, since many of these refinancing operations will naturally mature. For arguments both for and against CB balance sheet reduction this paper by Charles Goodhart – A Central Bank’s optimal balance sheet size? is well worth reviewing. A picture, however, is worth a thousand words, although I think the expected balance sheet reduction may be overly optimistic: –
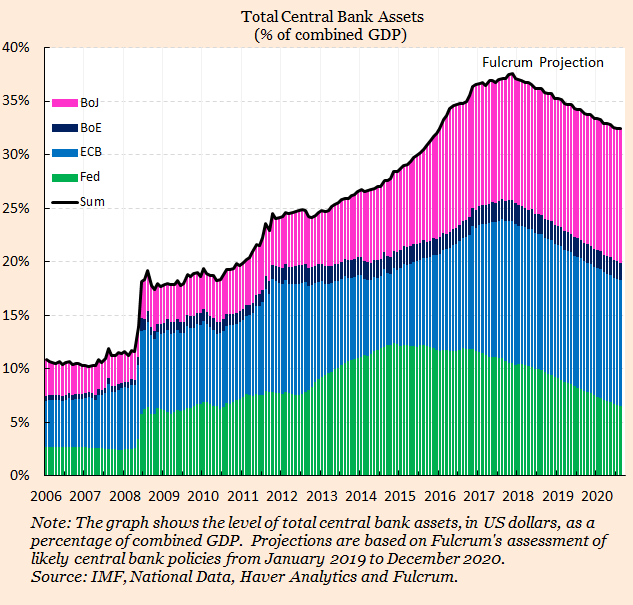
Source: IMF, Haver Analytics, Fulcrum Asset Management
Come the next crisis, I expect the ECB to broaden the range of eligible securities and instruments that it is prepared to purchase. The ‘Draghi Put’ will gain greater credence as it encompasses a wider array of credits. The ‘Flight to Quality’ effect, driven by swathes of investors forsaking equities and corporate bonds, in favour of ‘risk-free’ government securities, will be shorter-lived and less extreme. The ‘Convergence Trade’ between the yields of European government bonds will regain pre-eminence; I can conceive the 10yr BTP/Bund spread testing zero.
None of this race to zero will happen in a straight line, but it is important not to lose sight of the combined power of qualitative and quantitative easing. The eventual ‘socialisation’ of common stock is already taking place in Japan. Make no mistake, it is already being contemplated by a central bank near you, right now.
Italy and the repricing of European government debt
![]()
Macro Letter – No 98 – 08-06-2018
Italy and the repricing of European government debt
- The yield spread between 10yr BTPs and Bunds widened 114bp in May
- Populist and anti-EU politics were the catalyst for this repricing of risk
- Spain, Portugal and Greece all saw yields increase as Bund yields declined
- The ECB policy of OMT should help to avoid a repeat of 2011/2012
I have never been a great advocate of long-term investment in fixed income securities, not in a world of artificially low official inflation indices and fiat currencies. Given the de minimis real rate of return I regard them as trading assets. I will freely admit that this has led me to make a number of investment mistakes, although these have generally been sins of omission rather than actual investment losses. The Italian political situation and the sharp rise in Italian bond yields it precipitated, last week, is, therefore, some justification for an investor like myself, one who has not held any fixed income securities since 2010.
An excellent overview of the Italian political situation is contained in the latest essay from John Mauldin of Mauldin Economics – From the Front Line – The Italian Trigger:-
Italy had been without a government since its March 4 election, which yielded a hung parliament with no party or coalition holding a majority. The Five Star Movement and Lega Nord finally reached a deal, to most everyone’s surprise since those two parties, while both broadly populist, have some big differences. Nonetheless, they found enough common ground to propose a cabinet to President Sergio Mattarella.
Italian presidents are generally seen as rubberstamp figureheads. They really aren’t supposed to insert themselves into the process. Yet Mattarella unexpectedly rejected the coalition’s proposed finance minister, 81-year-old economist Paolo Savona, on the grounds Savona had previously opposed Italy’s eurozone membership. This enraged Five Star and Lega Nord, who then ended their plans to form a government and threatened to impeach Mattarella.
The whole article is well worth reading and goes on to look at debt from a global perspective. John anticipates what he calls, ‘The Great Reset,’ when the reckoning for the excessive levels of debt arrives.
Returning to the repricing of Eurozone (EZ) debt last month, those readers who have followed my market commentaries since the 1990’s, might recall an article I penned about the convergence of European government bond yields in the period preceding the introduction of the Euro. At that juncture (1998) excepting Greece, every bond market, whose government was about to adopt the Euro, was trading at a narrower credit spread to 10yr German bunds than the yield differential between the highest and lowest credit in the US municipal bond market. The widest differential in the muni-market at that time was 110bp. It was between Alabama and California – remember this was prior to the bursting of the Tech bubble.
In my article I warned about the risk of a significant repricing of European credit spreads once the honeymoon period of the single currency had ended. I had to wait more than a decade, but in 2010/2011 it looked as if I might be vindicated – this column is not entitled In the Long Run without just cause – then what one might dub the Madness of Crowds of Central Bankers intervened, saved the EZ and consigned my cautionary oracles, on the perils of the quest for yield, to the dustbin of history.
In the intervening period, since 2011, I have watched European yields inexorably converge and absolute yields turn negative, in several EZ countries, with a temerity which smacks of permanence. I have also arrived at a new conclusion about the limits of credit risk within a currency union: that they are governed by fiat in much the same manner as currencies. As long as the market believes that Mr Draghi will do, ‘…whatever it takes,’ investors will be enticed by relatively small yield enhancements.
Let me elaborate on this newly-minted theory by way of an example. Back in March 2012, Greek 10yr yields reached 41.77% at that moment German 10yr yields were a mere 2.08%. The risk of contagion was steadily growing, as other peripheral EZ bond markets declined. Greece, in and of itself, was and remains, a small percentage of EZ GDP, but, as Portuguese and Spanish bonds began to follow the lead of Greece, the fear at the ECB – and even at the Bundesbank – was that Italy might succumb to contagion. Due to its size, the Italian bond market, was then, and remains today, the elephant in the room.
During the course of last month, European bond markets diverged. The table below shows the change in 10yr yields between 1st and 31st May:-
Source: Investing.com
A certain degree of contagion is evident, although the PIGS have lost an ‘I’ as Irish Gilts have escaped the pejorative acronym.
At the peaks of the previous crisis, Irish 10yr Gilts made a yield high of 14.61% in July 2011, at which point their spread versus 10yr Bunds was 11.34%. When Italy entered her own period of distress, in November of that year, the highest 10yr BTP yield recorded was 7.51% and the spread over Germany reached 5.13%. By the time Greek 10yr yields reached their zenith, in March 2012, German yields were already lower and Irish and Italian spreads had begun to narrow.
During the course of last month the interest rate differential between 10yr Bunds and their Irish, Greek and Italian counterparts widened by 41, 100 and 114bp respectively. Italian 10yr yields closed at 4.25% over Bunds, less than 100bp from their 2011 crisis highs. With absolute yields significantly lower today (German 10yr yields were 2.38% in November 2011 they ended May 2018 at 36bp) the absolute percentage return differential is even higher than during the 2011 period. At 2.72% BTPs offer a return which is 7.5 times greater than 10yr Bunds. Back in 2011 the 7.51% yield was a little over three times the return available from 10yr Bunds.
I am forced to believe the reaction of the BTP market has been excessive and that spreads will narrow during the next few months. If I am incorrect in my expectation, it will fall to Mr Draghi to intervene. The Outright Monetary Transactions – OMT – policy of the ECB allows it to purchase a basket of European government bonds on a GDP weighted basis. If another crisis appears immanent they could adjust this policy to duration weight their purchases. It would then permit them to buy a larger proportion of the higher yielding, higher coupon bonds of the southern periphery. There would, no doubt, be complaints from those countries that practice greater fiscal rectitude, but the policy shift could be justified on investment grounds. If the default risk of all members of the EZ is equal due to the political will of the European Commission, then it makes sense from an investment perspective for the ECB to purchase higher yielding bonds if they have the same credit risk. A new incarnation of the Draghi Put could be implemented without too many objections from Frankfurt.
Conclusions and investment opportunities
I doubt we will see a repeat of the 2011/2012 period. Lightening seldom strikes twice in the same way. The ECB will continue with its QE programme and this will ensure that EZ government bond yields remain at artificially low levels for the foreseeable future.
Unusually, I have an actionable trade idea: caveat emptor! I believe the recent widening of the 10yr Italian BTP/Spanish Bonos spread has been excessive. If there is bond market contagion, as a result of the political situation in Italy, Bonos yields may have difficulty defying gravity. If the Italian political environment should improve, the over-sold BTP market should rebound. If the ECB are forced to act to avert a new EZ crisis by increasing OMT or implementing a duration weighted approach to QE, Italy should benefit more than Spain until the yield differential narrows.

Is the US exporting a recession?
![]()
Macro Letter – No 96 – 04-05-2018
Is the US exporting a recession?
- The Federal Reserve continue to raise rates as S&P earnings beat estimates
- The ECB and BoJ maintain QE
- Globally, corporations rely on US$ financing, nonetheless
- Signs of a slowdown in growth are clearer outside the US
After last week’s ECB meeting, Mario Draghi gave the usual press conference. He confirmed the continuance of stimulus and mentioned the moderation in the rate of growth and below-target inflation. He also referred to the steady expansion in money supply. When it came to the Q&A he revealed rather more:-
It’s quite clear that since our last meeting, broadly all countries experienced, to different extents of course, some moderation in growth or some loss of momentum. When we look at the indicators that showed significant, sharp declines, we see that, first of all, the fact that all countries reported means that this loss of momentum is pretty broad across countries.
It’s also broad across sectors because when we look at the indicators, it’s both hard and soft survey-based indicators. Sharp declines were experienced by PMI, almost all sectors, in retail, sales, manufacturing, services, in construction. Then we had declines in industrial production, in capital goods production. The PMI in exports orders also declined. Also we had declines in national business and confidence indicators.
I quote this passage out of context because the entire answer was more nuanced. My reason? To highlight the difference between the situation in the EU and the US. In Europe, money supply (M3) is growing at 4.3% yet inflation (HICP) is a mere 1.3%. Meanwhile in the US, inflation (CPI) is running at 2.4% and money supply (M2) is hovering a fraction above 2%. Here is a chart of Eurozone M3 since 1999:-
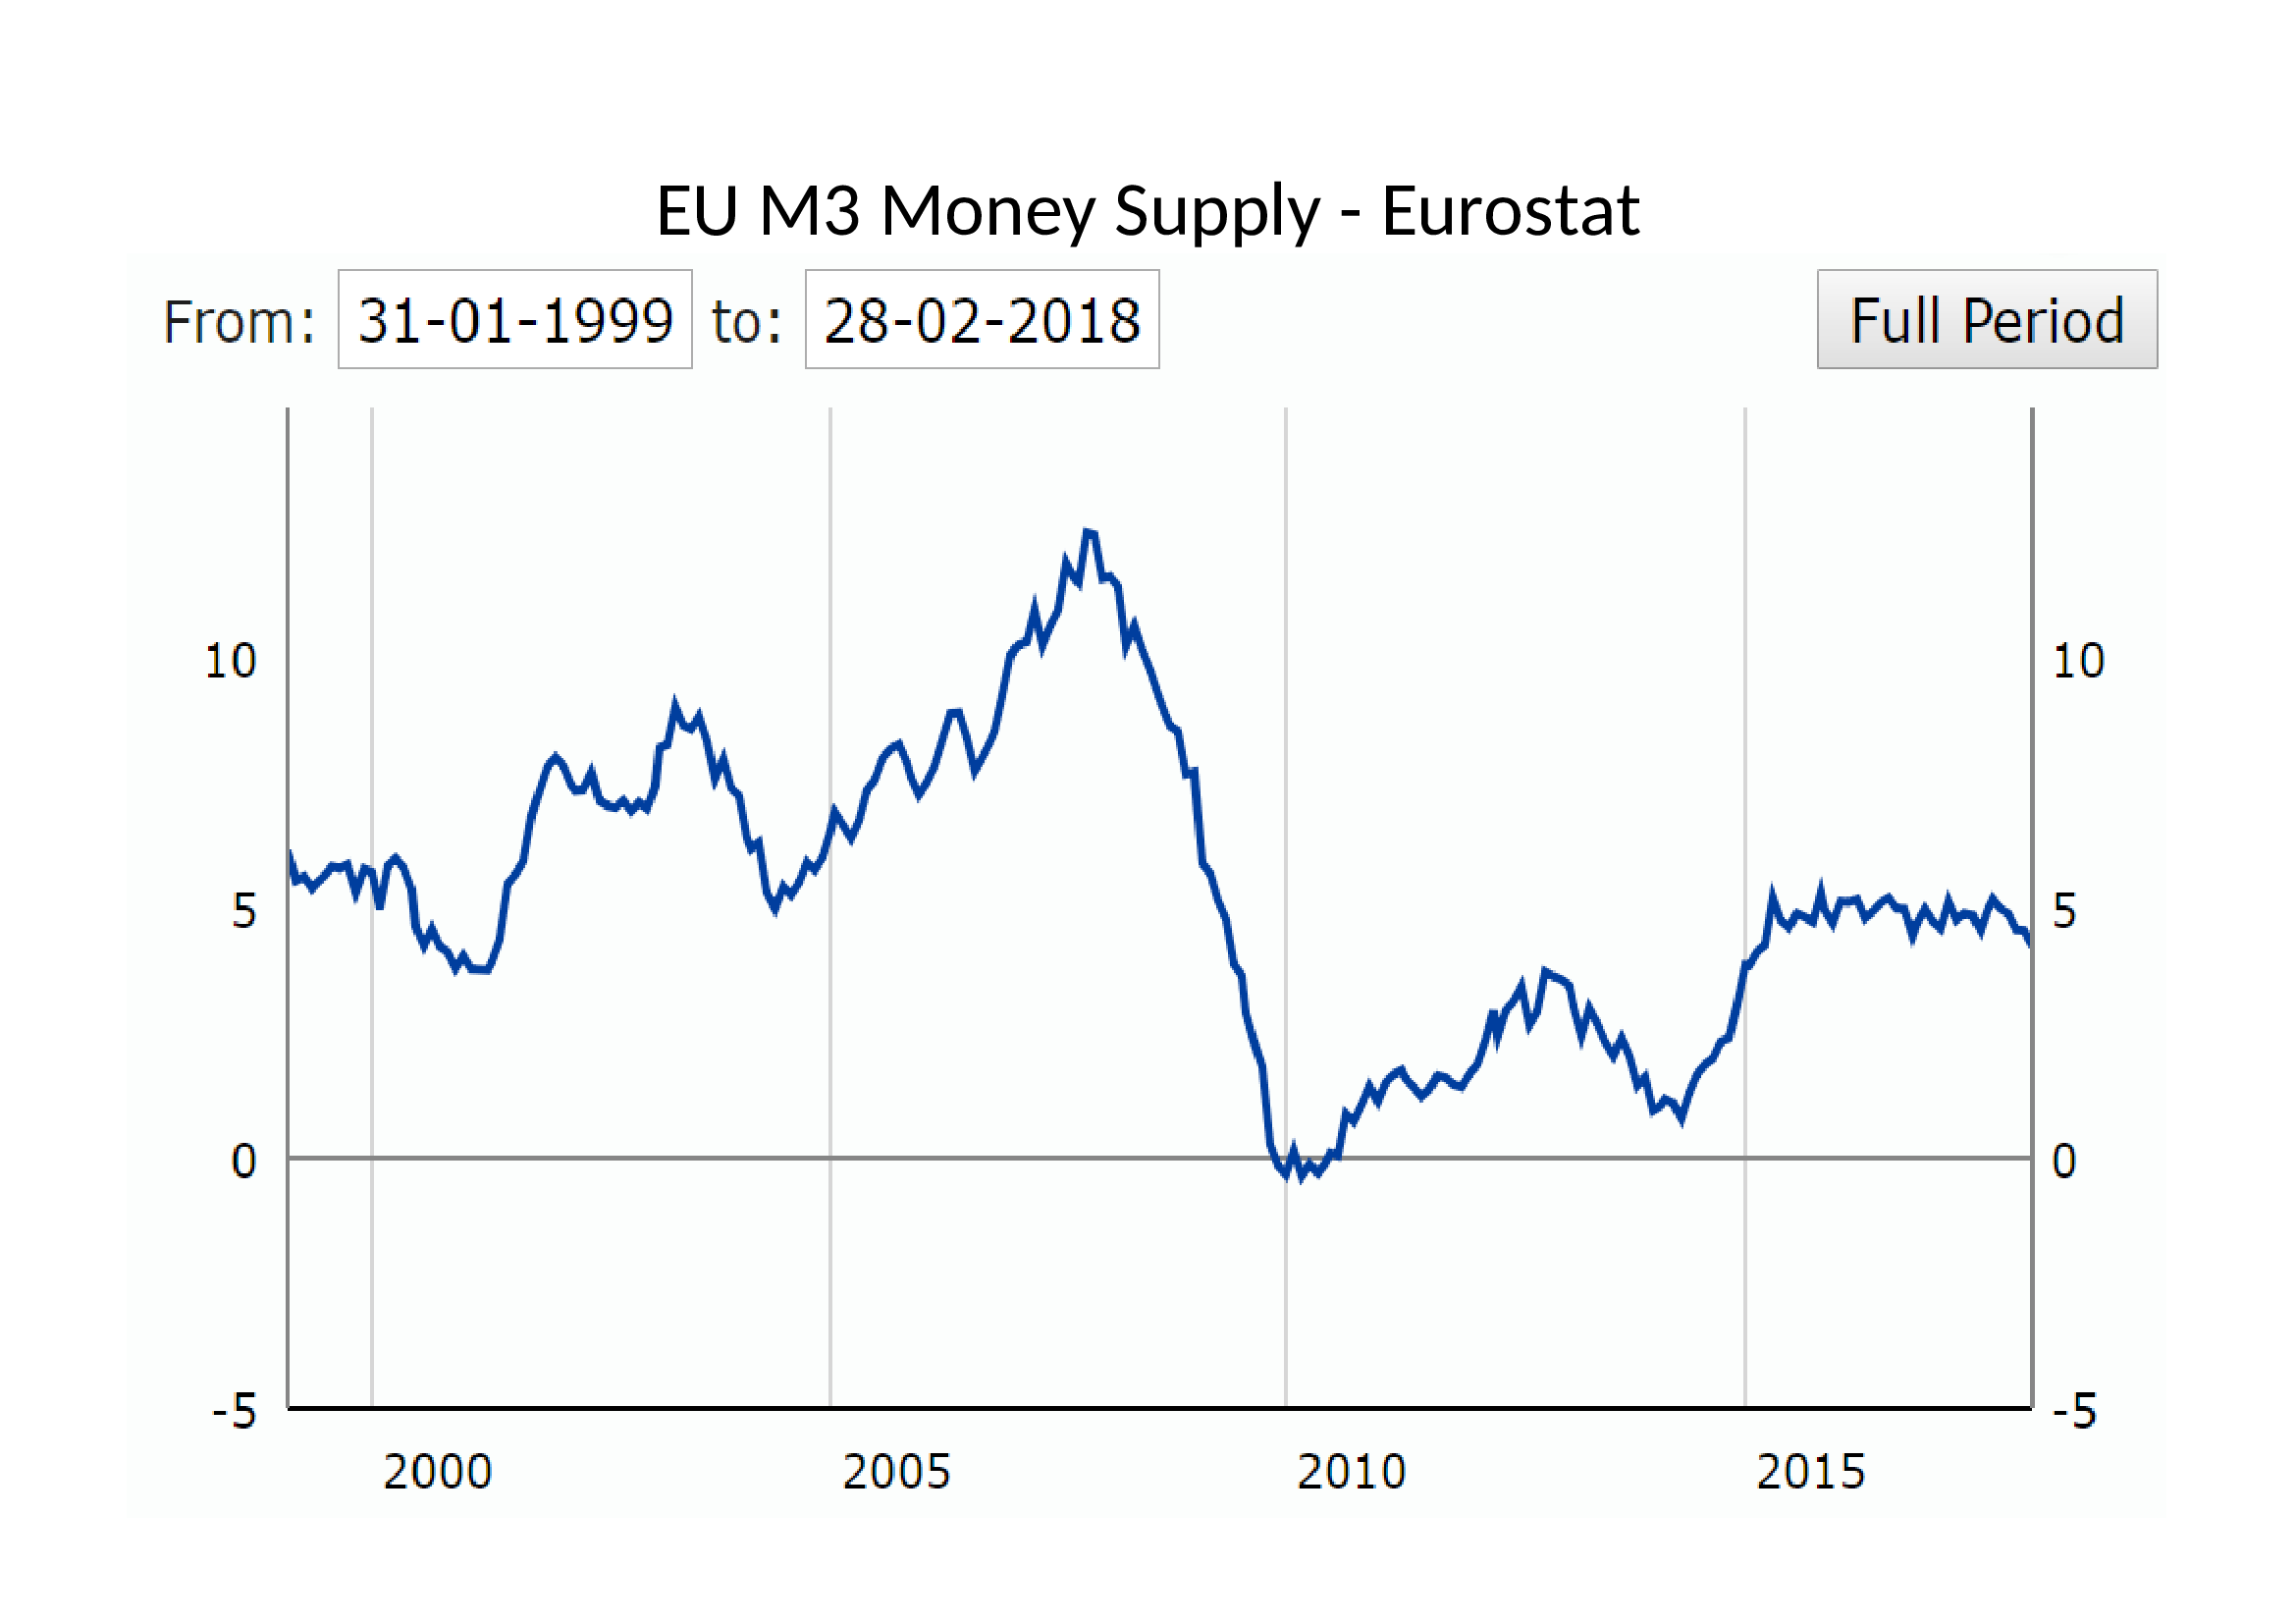
Source: Eurostat
The recent weakening of momentum is a concern, but the absolute level is consistent with a continued expansion.
Looked at over a rather longer time horizon, here is a chart of US M2 since 1900:-
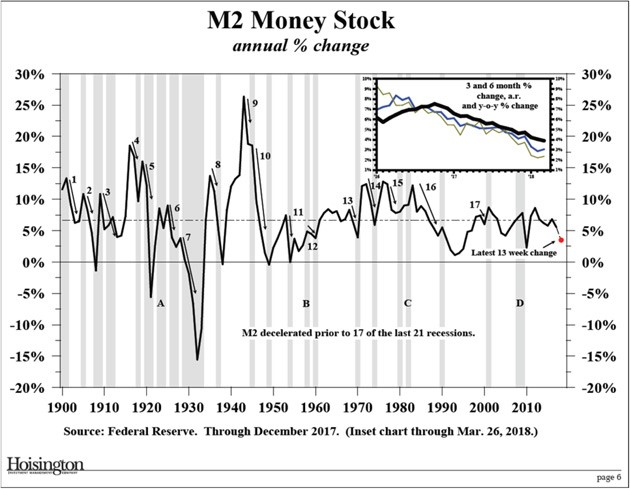
Source: Hoisington Asset Management, Federal Reserve
The letters A, B, C, D denote the only occasions, during the last 118 years, when a decline in the expansion (or, during the 1930’s, contraction) of M2 did not lead to a recession. 17 out of 21 is a quite compelling record.
Another concern for markets is the flatness of the US yield curve. Here is the 2yr – 10yr yield differential since 1990:-
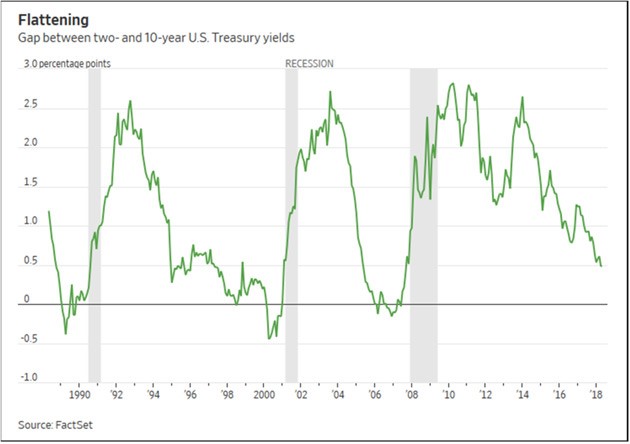
Source: Factset, Mauldin Economics
More importantly, for international borrowers, the 6-month LIBOR rate has risen by more than 60 basis points since the start of the year (from 1.8% to 2.5%) whilst 30yr Swap rates have increased by only 40 basis points (2.6% to 3%). The 10yr – 30yr Swap curve is now practically flat.
Also worthy of comment, as US Treasury yields have risen, the relationship between Bonds and Swaps has begun to normalise – 30yr T-Bond yields are only 40 basis points above their level of January and roughly at the same level as in the spring of last year. In April 2017 I wrote in Macro Letter – No 74 – US 30yr Swaps have yielded less than Treasuries since 2008 – does it matter?:-
Today the IRS market increasingly determines the cost of finance, during the next crisis IRS yields may rise or fall by substantially more than the same maturity of US T-bond, but that is because they are the most liquid instruments and are only indirectly supported by the Central Bank.
It looks like I may have to eat my words, here is the Bond vs Swap table revisited:-
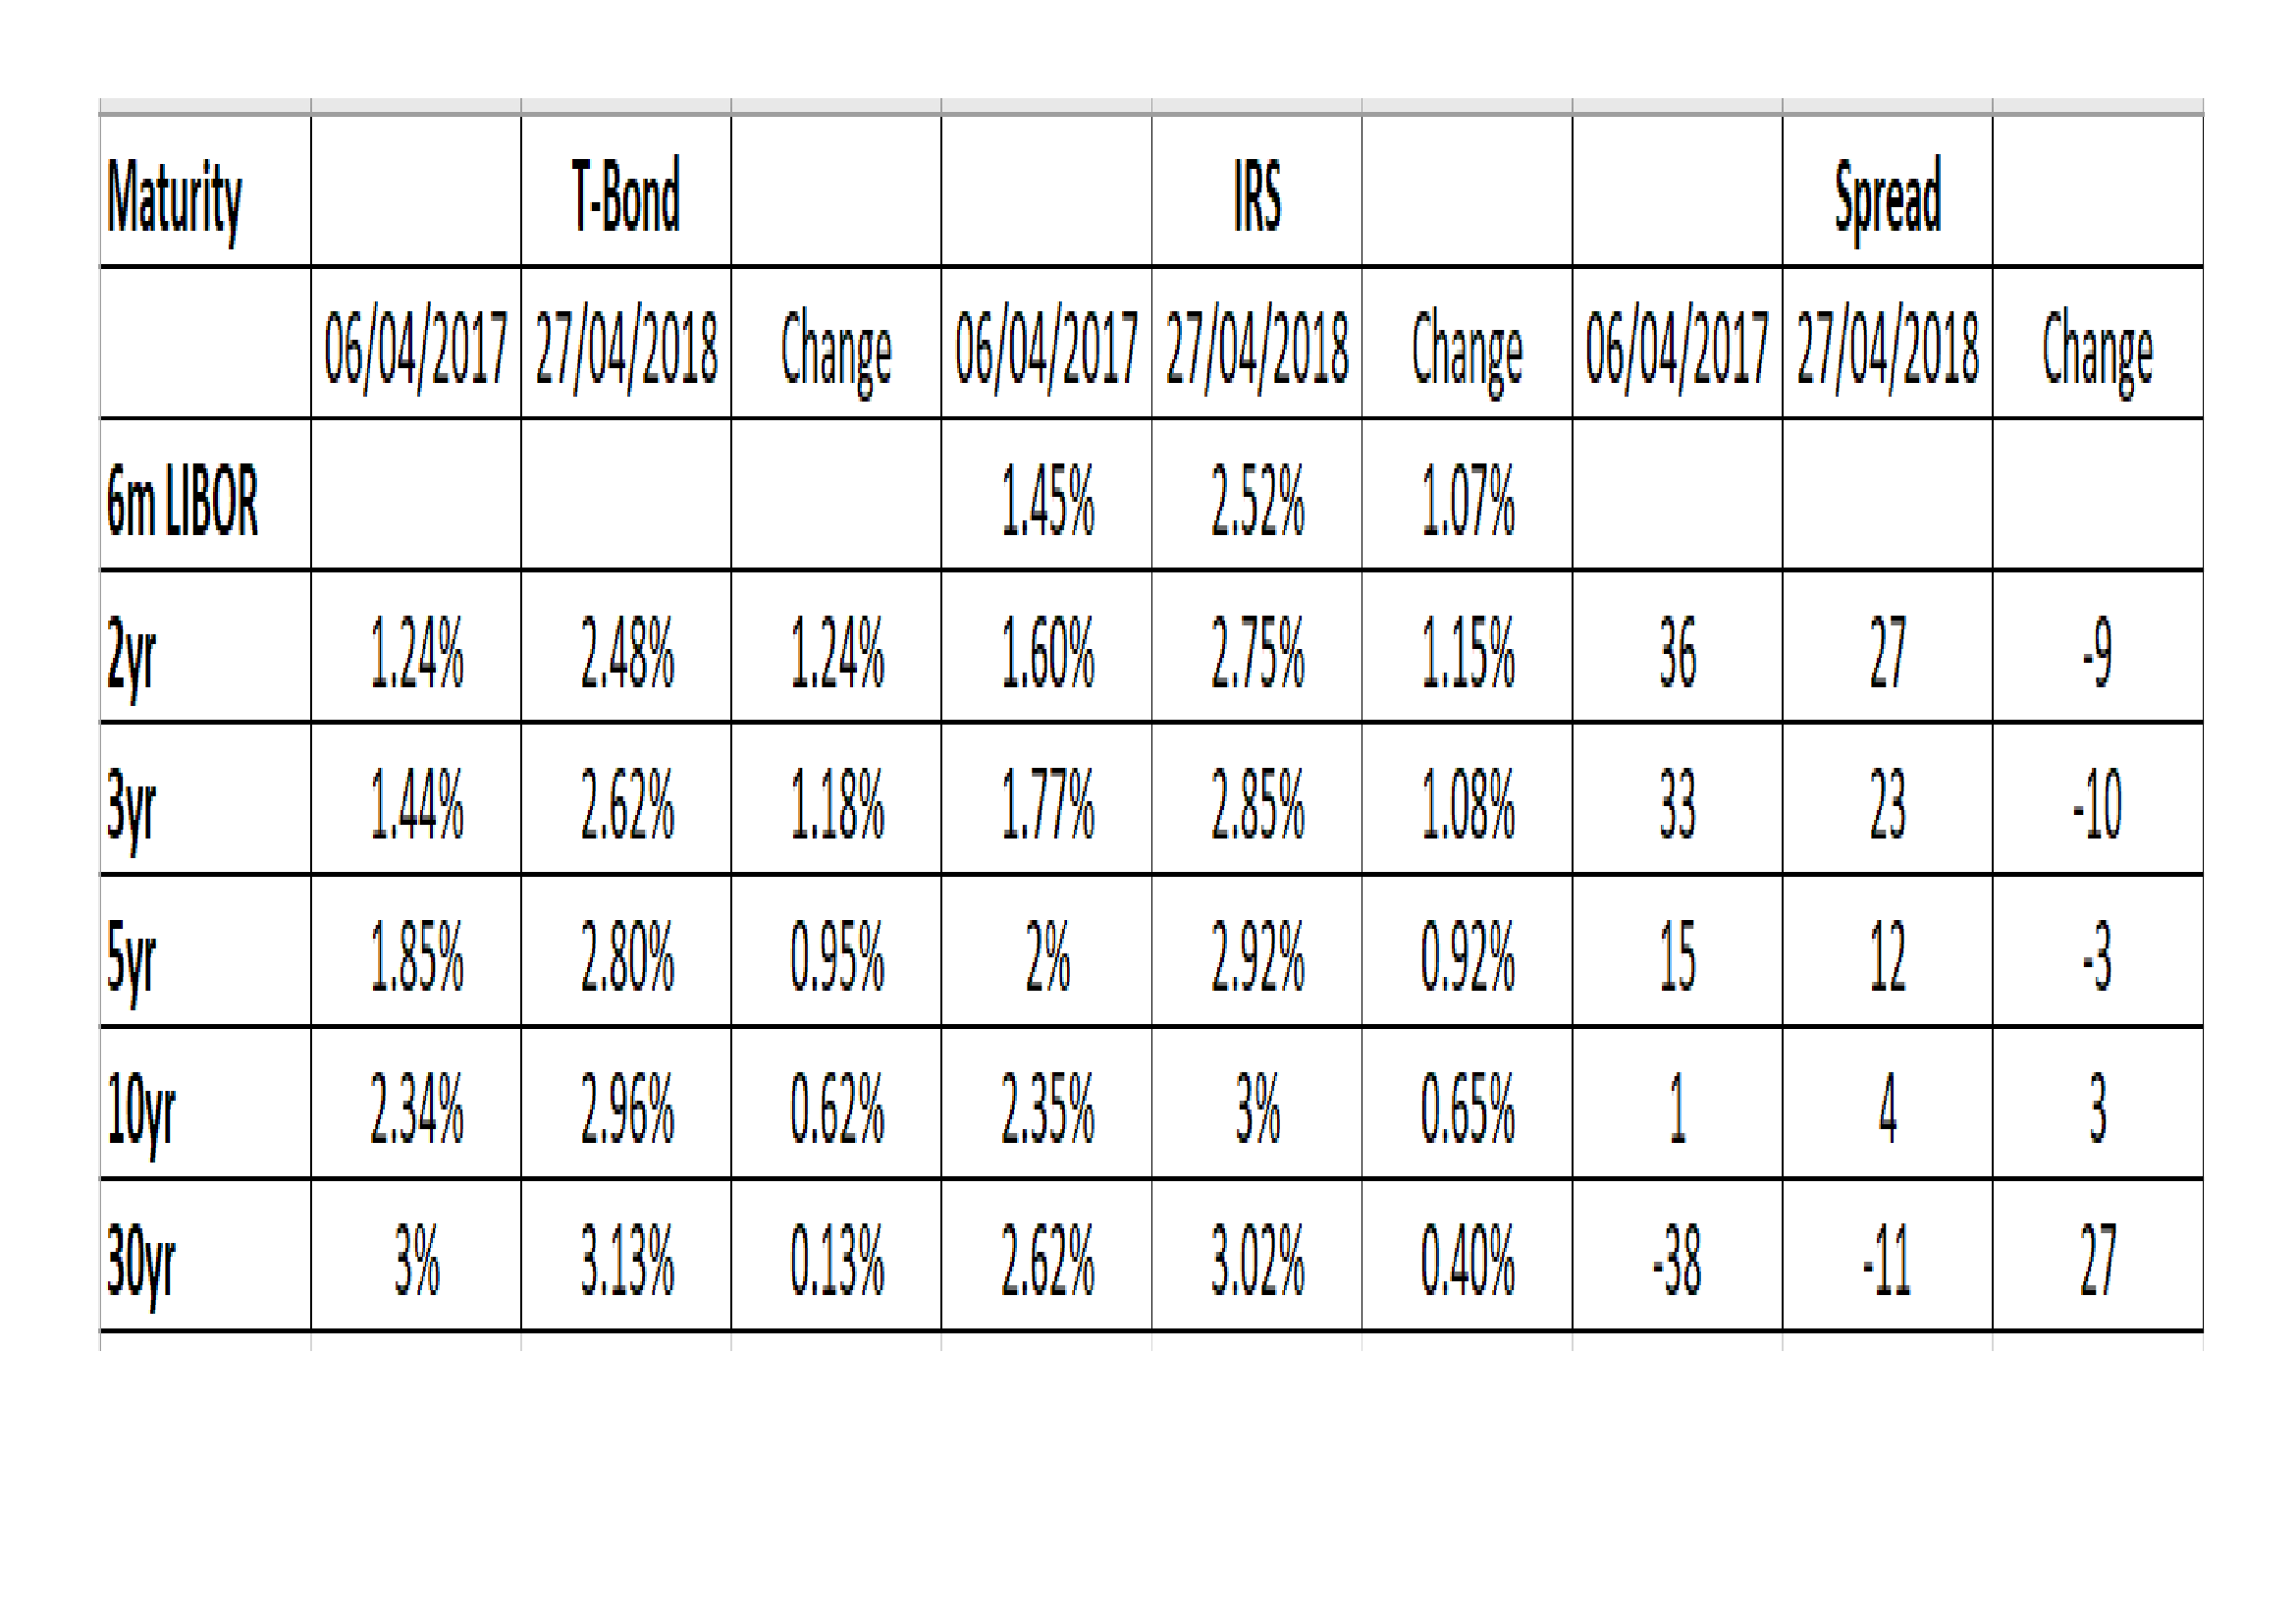
Source: Investing.com, Interestrateswaps.com, BBA
What is evident is that the Bond/Swap inversion in the longer maturities has closed substantially even as shorter maturity spreads have narrowed. Federal Reserve policy has been the dominate factor.
Why is it, however, that the effect of higher US rates is, seemingly, felt more poignantly in Europe than the US? Does this bring us back to protectionism? Perhaps, but in less contentious terms, the US has run a capital account surplus for many years. Outside the US investment is closely tied to LIBOR financing costs, these have remained higher, except in the longest maturities, and these rates have risen most precipitously this year. Looked at another way, the higher interest rate policies of the Federal Reserve, despite the continued largesse of other central banks, is exporting the next recession to the rest of the world.
I ended Macro Letter – No 74 back in April 2017 – saying:-
Meanwhile, although interest rates have risen from historic lows they remain far below their long run average. Pension funds and other long-term investors still require 7% or more in annualised returns in order to meet their liabilities. They are being forced to continuously increase their investment risk and many have chosen to use the swap market. The next crisis is likely to see an even more pronounced unravelling than in 2008/2009. The unravelling may not happen for some while but the stresses are likely to be focused on the IRS market.
One year on, cracks in the capital markets edifice are beginning to become more evident. GDP growth has started to rollover in the US, Eurozone and Japan. Yields are still relatively low but the absolute increase in rates for shorter maturities (e.g. the near doubling of US 2yr yields from 1.25% to 2.5% in a single year) is guaranteed to take its toll on corporate interest servicing costs. US capital markets are the envy of the world. They are deep and allow borrowers to finance far into the future. The rest of the world is forced to borrow at shorter tenors. A three basis point narrowing of 5yr spreads between Swaps and Bonds is hardly compensation for the near 1% increase in interest rates, or, put in starker terms, a 46% increase in absolute borrowing costs.
Conclusion and investment opportunities
How is the rise in borrowing costs impacting the US stock market? Volatility is back, but earnings are robust. Factset – S&P 500 Earnings Season Update: April 27, 2018 – described it thus:-
To date, 53% of the companies in the S&P 500 have reported actual results for Q1 2018. In terms of earnings, more companies are reporting actual EPS above estimates (79%) compared to the five-year average. If 79% is the final percentage for the quarter, it will mark the highest percentage of S&P 500 companies reporting actual EPS above estimates since FactSet began tracking this metric in Q3 2008. In aggregate, companies are reporting earnings that are 9.1% above the estimates, which is also above the five-year average. In terms of sales, more companies (74%) are reporting actual sales above estimates compared to the five-year average. In aggregate, companies are reporting sales that are 1.7% above estimates, which is also above the five-year average. If 1.7% is the final percentage for the quarter, it will mark the largest revenue surprise percentage since FactSet began tracking this metric in Q3 2008.
… The blended (combines actual results for companies that have reported and estimated results for companies that have yet to report), year-over-year earnings growth rate for the first quarter is 23.2% today, which is higher than the earnings growth rate of 18.5% last week. Positive earnings surprises reported by companies in multiple sectors (led by the Information Technology sector) were responsible for the increase in the earnings growth rate for the index during the past week. All 11 sectors are reporting year-over-year earnings growth. Nine sectors are reporting double-digit earnings growth, led by the Energy, Materials, Information Technology, and Financials sectors.
We are more than halfway through Q1 earnings (I’m writing this letter on Wednesday 2nd May). Results have generally been above forecast and now the Fed seems conscious that they must not be too hasty to reverse the effects of both zero rates and QE. Added to which, while US stocks have been languishing mid-range, European stocks have recently broken out of their recent ranges to the upside, despite discouraging economic data.
The US stock market looks less expensive than it did in January 2017, when I wrote Macro Letter – 68 – Equity valuation in a de-globalising world. Then I was looking for stock markets with a low correlation to the US: they were (and remain) hard to find.
Other indicators to watch which exert a strong influence on stocks include the US PMI Index – last at 54.8 up from 54.2 in March. Above 50 there is little cause for concern. For the Eurozone it is even higher at 55.2, whilst throughout G20 no economy is recording a PMI below 50.
The chart below shows the Citigroup Economic Surprises Index (blue) vs the S&P500 Forward P/E estimates (red):-
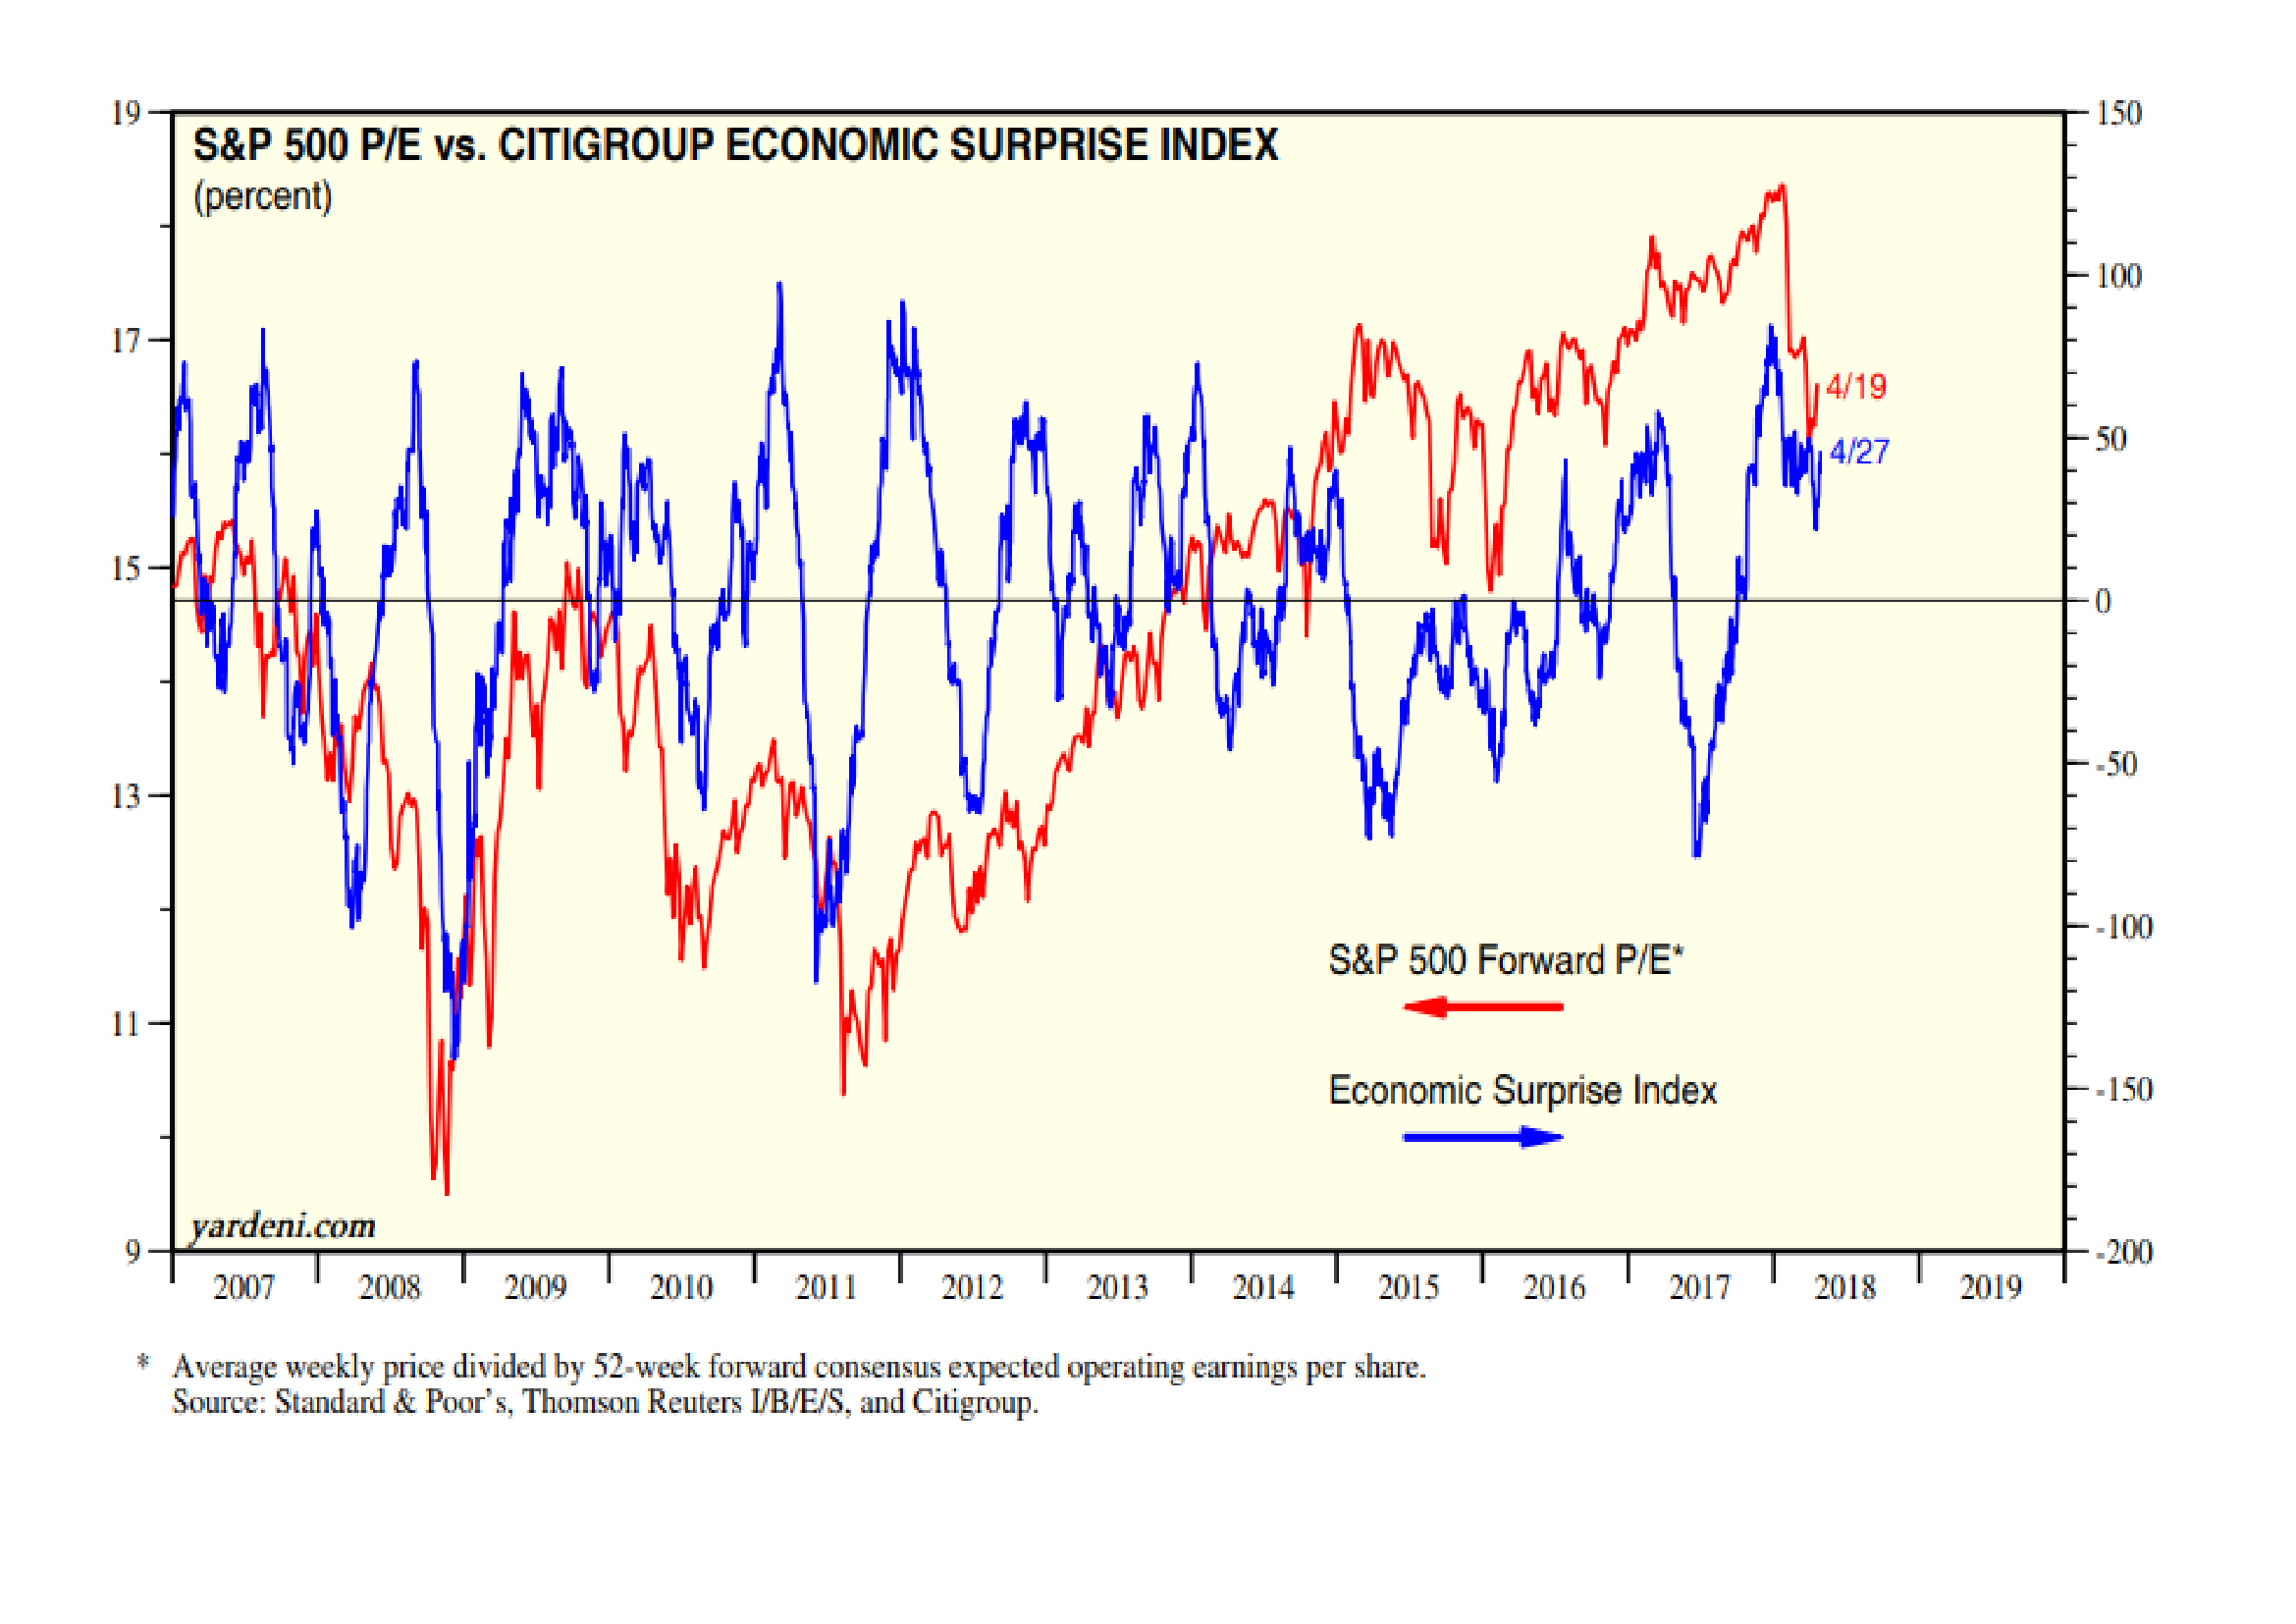
Source: Yardeni Research, S&P, Thompson Reuters, Citigroup
Economic surprises remain positive rather than negative for the US. In the Eurozone it is quite another matter:-
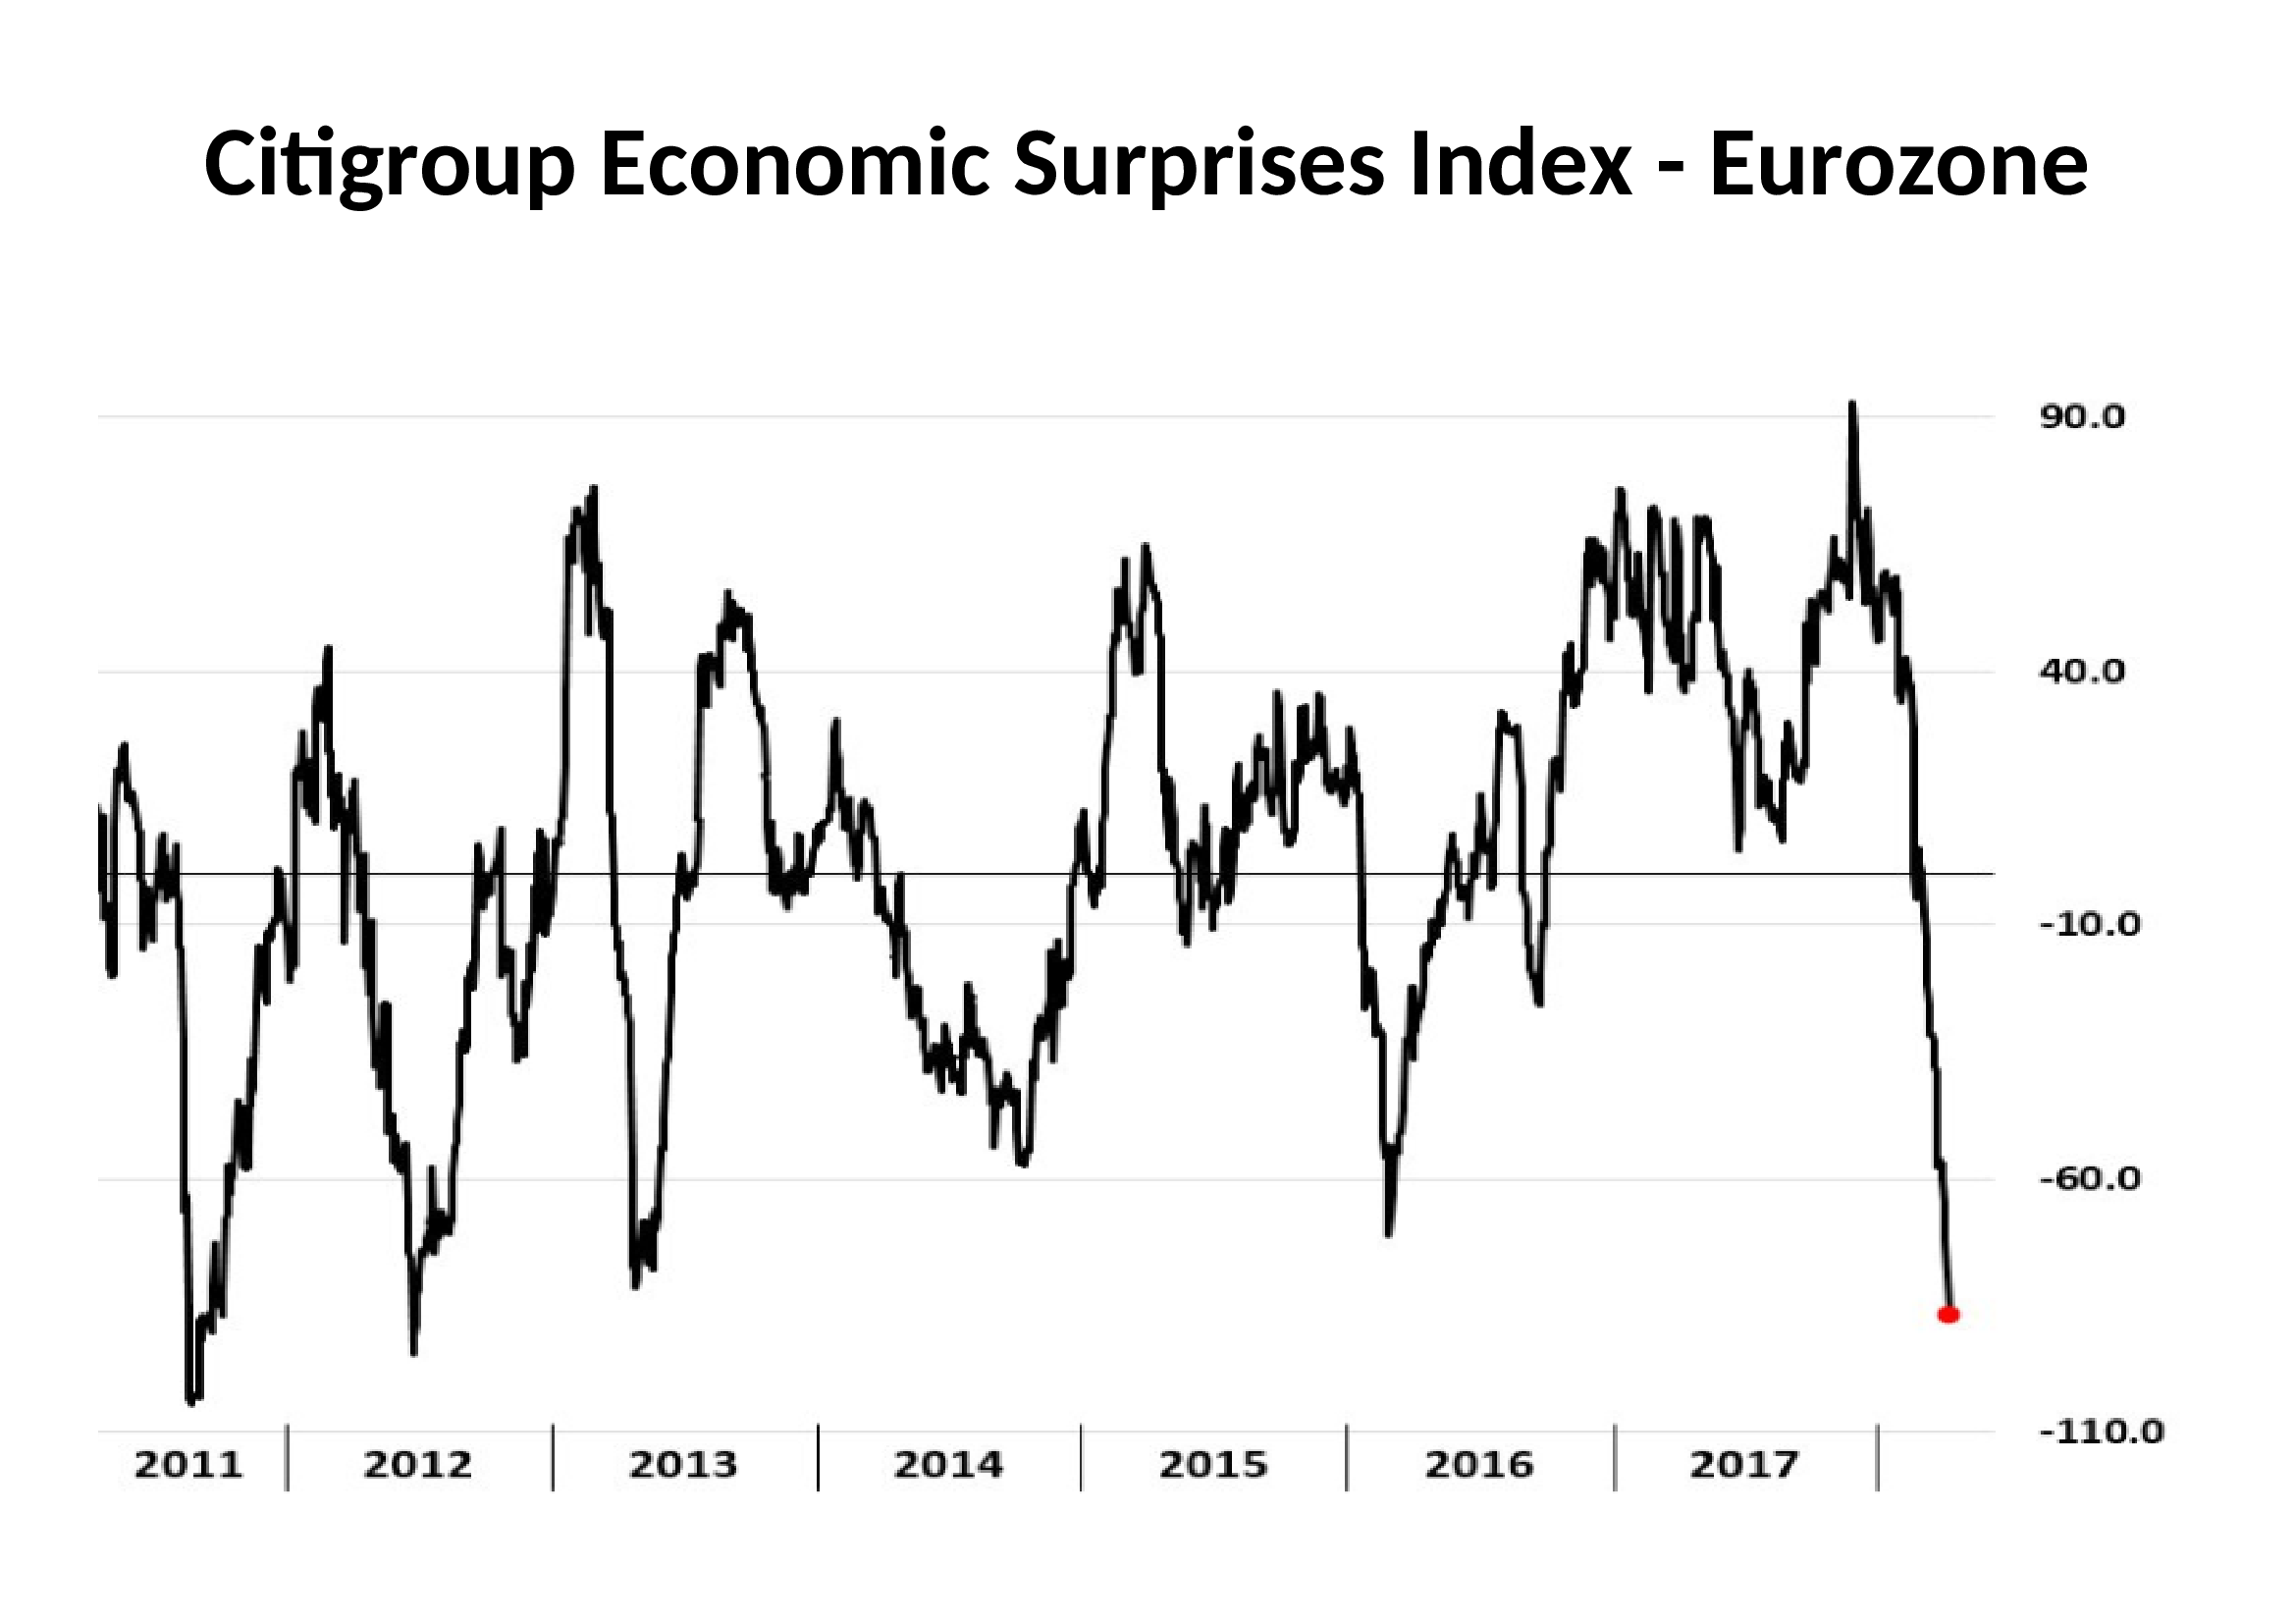
Source: Bloomberg, Citigroup
A number of economic indicators are pointing to a slowdown, yet US stocks are beating estimates. To judge from price action, the market appears to be unimpressed by earnings. I am reminded of the old adage, ‘When all the buyers are in the market it’s time to sell.’ From a technical perspective it makes sense to be patient, but the market has failed to rise substantially on a positive slew of earnings news. This may be because there is a more important factor driving sentiment: the direction of US rates. It certainly appears to have engendered a revival of the US$. It rallied last month having been in a downtrend since January 2017 despite a steadily tightening Federal Reserve. For EURUSD the move from 1.10 to 1.25 appears to have taken its toll. On the basis of the CESI chart, above, if Wall Street sneezes, the Eurozone might catch pneumonia.
Are we nearly there yet? Employment, interest rates and inflation
![]()
Macro Letter – No 92 – 09-03-2018
Are we nearly there yet? Employment, interest rates and inflation
- Rising interest rates and inflation are spooking financial markets
- Unemployment data suggests that labour markets are tight
- Central Banks will have to respond to a collapse in the three asset bubbles
There are two factors, above all others, which are spooking asset markets at present, inflation and interest rates. The former is impossible to measure with any degree of certainty – for inflation is in the eye of the beholder – and the latter is divergent depending on whether you look at the US or Japan – with Europe caught somewhere between the two extremes. In this Macro Letter I want to investigate the long term, demand-pull, inflation risk and consider what might happen if stocks, bonds and real estate all collapse in tandem.
It is reasonable to assume that US rates will rise this year, that UK rates might follow and that the ECB (probably) and BoJ (almost certainly) will remain on the side-lines. An additional worry for export oriented countries, such as Japan and Germany, is the protectionist agenda of the current US administration. If their exports collapse, GDP growth is likely to slow in its wake. The rhetoric of retaliation will be in the air.
For international asset markets, the prospect of higher US interest rates and protectionism, spells lower growth, weakness in employment and a lowering of demand-pull inflationary pressure. Although protectionism will cause prices of certain goods to rise – use that aluminium foil sparingly, baste instead – the overall effect on employment is likely to be swift.
Near-term impact
Whilst US bond yields rise, European bond yields may fail to follow, or even decline, if export growth collapses. Stocks in the US, by contrast, may be buoyed by tax cuts and the short-term windfall effect of tariff barriers. The high correlation between equity markets and the international nature of multinational corporations, means global stocks may remain levitated a while longer. The momentum of recent economic growth may lead to increased employment and higher wages in the near-term – and this might even spur demand for a while – but the spectre of inflation at the feast, will loom like a hawk.
Longer-term effects
But is inflation really going to be a structural problem? In an attempt to answer this we must delve into the murky waters of the employment data. As a starting point, at what juncture can we be confident that the US and other countries at or near to full-employment? Let us start by looking at the labour force participation rate. It is a difficult measure to interpret. As the table below shows, in the US and Japan the trend has been downward whilst the UK and the EU are hitting record highs:-
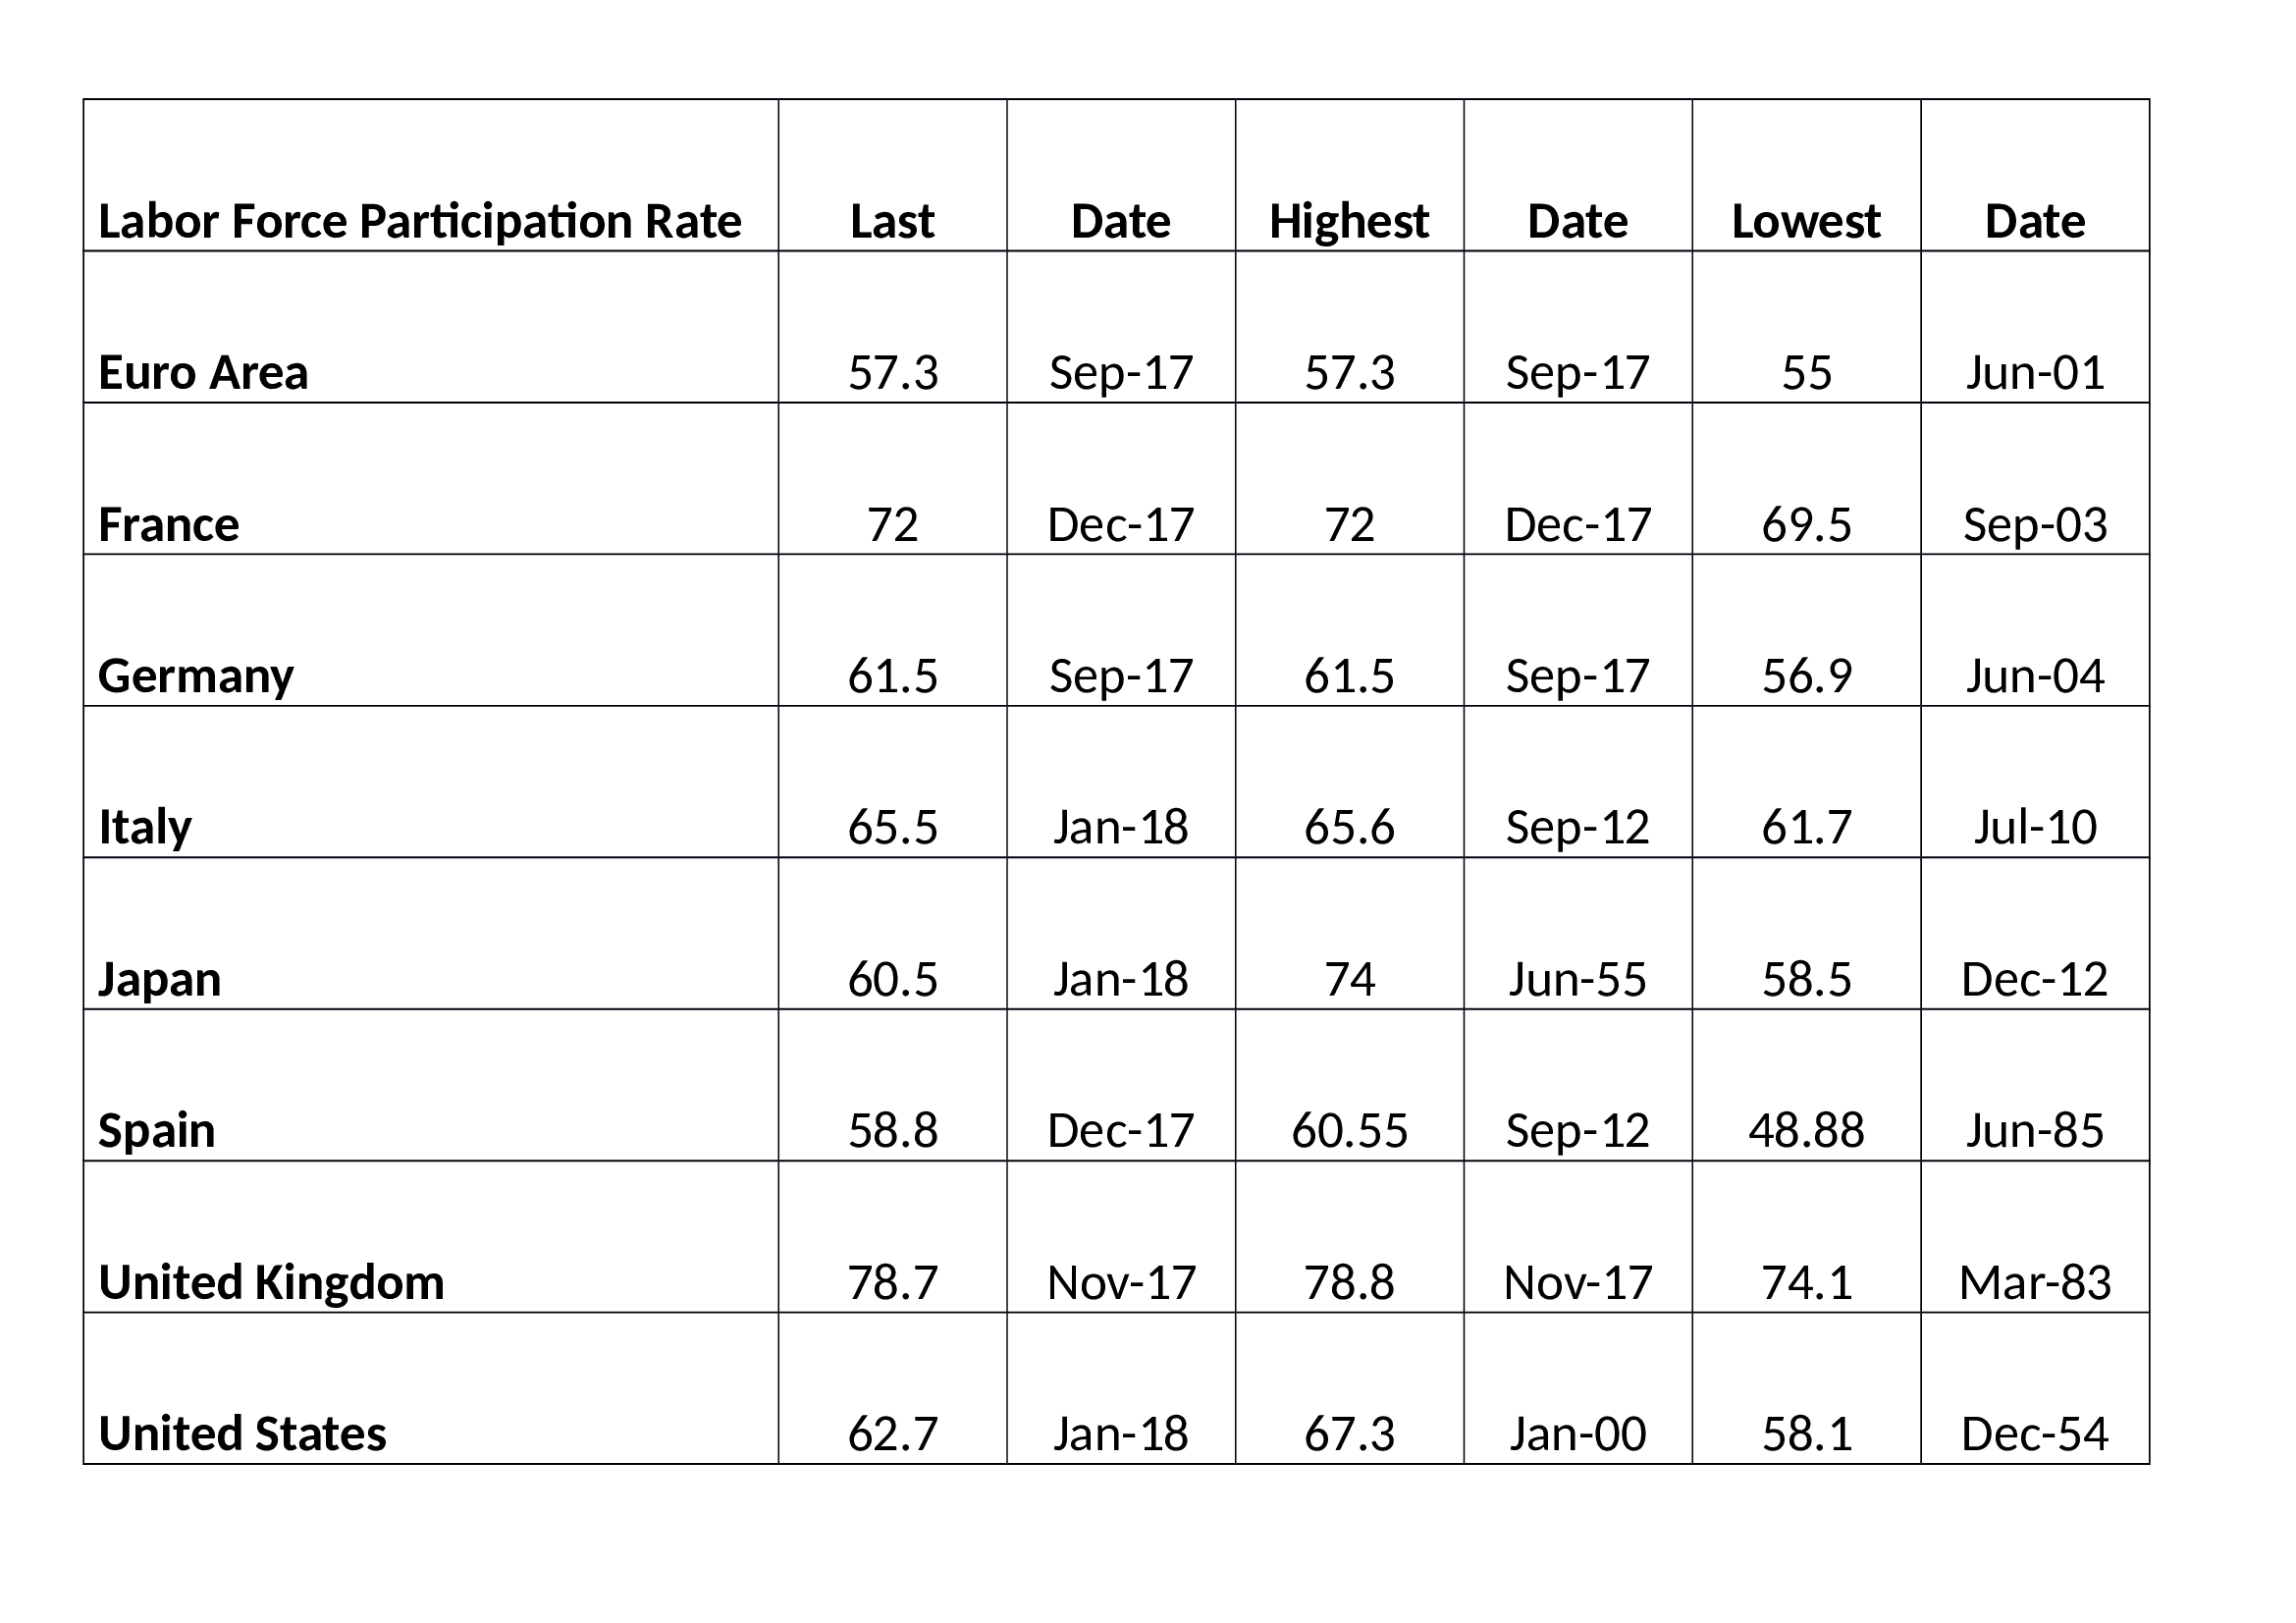
Source: Trading Economics
One possible reason for this divergence between the EU and the US/Japan is that the upward trend in European labour participation has been, at least partially, the result of an inexorable reduction in the scope and scale of the social safety net throughout the region.
More generally, since the Great Recession of 2008/2009 a number of employment trends have been evident across most developed countries. Firstly, many people have moved from full-time to part-time employment. Others have switched from employment to self-employment. In both cases these trends have exerted downward pressure on earnings. What little growth in earnings there has been, has mainly emanated from the public sector, but rising government deficits make this source of wage growth unsustainable in the long run.
The Record of Meeting of the CAC and Federal Reserve Board of Governors – published last November, stated the following in relation to US employment:-
The data indicate that despite the drop in unemployment, there has not been an increase in the number of quality jobs—those that pay enough to cover expenses and enable workers to save for the future. The 2017 Scorecard reports that one in four jobs in the U.S. is in a low-wage occupation, which means that at the median salary, these jobs pay below the poverty threshold for a family of four. For the first time, the 2017 Scorecard includes a measure of income volatility that shows that one in five households has significant income fluctuations from month to month. The percentage varies by state, from a low of 14.7 percent of households in Virginia to a stunning 29.8 percent of households in Wyoming. In addition, 40 percent of those experiencing volatility reported struggling to pay their bills at least once in the last year because of these income fluctuations. These two factors contribute significantly to the fact that almost 37 percent of U.S. households, and 51 percent of households of color, live in the financial red zone of “liquid asset poverty.” This means that they do not have enough liquid savings to replace income at the poverty level for three months if their main source of income is disrupted, such as from job loss or illness. This level of financial insecurity has profound implications for the security of households, and for the overall economic growth of the nation.
Another trend that has been evident is the increase in the number of people no longer seeking employment. Setting aside those who, for health related reasons, have exited the employment pool, early retirement has been one of the main factors swelling the ranks of the previously employable. For this growing cohort, inflation never went away. In particular, inflation in healthcare has been one of the main sources of increases in the price level over the past decade.
At the opposite end of the working age spectrum, education is another factor which has reduced the participation rate. It has also exerted downward pressure on wages; as more students enrol in higher education in order to gain, hopefully, better paid employment, the increased supply of graduates insures that the economic value of a degree diminishes. Whilst a number of corporations have begun to offer apprenticeships or in-work degree qualifications, in order to address the skill gap between what is being taught and what these firms require from their employees, the overall impact of increased demand for higher education has been to reduce the participation rate.
For a detailed assessment of the situation in the US, this paper from the Kansas City Federal Reserve – Why Are Prime-Age Men Vanishing from the Labor Force? provides some additional and fascinating insights. Here is the author’s conclusion:-
Over the past two decades, the nonparticipation rate among primeage men rose from 8.2 percent to 11.4 percent. This article shows that the nonparticipation rate increased the most for men in the 25–34 age group and for men with a high school degree, some college, or an associate’s degree. In 1996, the most common situation prime-age men reported during their nonparticipation was a disability or illness, while the least common situation was retirement. While the share of primeage men reporting a disability or illness as their situation during nonparticipation declined by 2016, this share still accounted for nearly half of all nonparticipating prime-age men. This result is in line with Krueger’s (2016) finding, as many of these men with a disability or illness are likely suffering from daily pain and using prescription painkillers.
I argue that a decline in the demand for middle-skill workers accounts for most of the decline in participation among prime-age men. In addition, I find that the decline in participation is unlikely to reverse if current conditions hold. In 2016, the share of nonparticipating prime-age men who stayed out of the labor force in the subsequent month was 83.8 percent. Moreover, less than 15 percent of nonparticipating prime-age men reported that they wanted a job. Together, this evidence suggests nonparticipating prime-age men are less likely to return to the labor force at the moment.
The stark increase in prime-age men’s nonparticipation may be the result of a vicious cycle. Skills demanded in the labor market are rapidly changing, and automation has rendered the skills of many less-educated workers obsolete. This lack of job opportunities, in turn, may lead to depression and illness among displaced workers, and these health conditions may become further barriers to their employment. Ending this vicious cycle—and avoiding further increases in the nonparticipation rate among prime-age men—may require equipping workers with the new skills employers are demanding in the face of rapid technological advancements.
For an even more nuanced interpretation of the disconnect between corporate profits and worker compensation this essay by Jonathan Tepper of Varient Perception – Why American Workers Aren’t Getting A Raise: An Economic Detective Story – is even more compelling:-
Rising industrial concentration is a powerful reason why profits don’t mean revert and a powerful explanation for the imbalance between corporations and workers. Workers in many industries have fewer choices of employer, and when industries are monopolists or oligopolists, they have significant market power versus their employees.
The role of high industrial concentration on inequality is now becoming clear from dozens recent academic studies. Work by The Economist found that over the fifteen-year period from 1997 to 2012 two-thirds of American industries were more concentrated in the hands of a few firms. In 2015, Jonathan Baker and Steven Salop found that “market power contributes to the development and perpetuation of inequality.”
One of the most comprehensive overviews available of increasing industrial concentration shows that we have seen a collapse in the number of publicly listed companies and a shift in power towards big companies. Gustavo Grullon, Yelena Larkin, and Roni Michaely have documented how despite a much larger economy, we have seen the number of listed firms fall by half, and many industries now have only a few big players. There is a strong and direct correlation between how few players there are in an industry and how high corporate profits are.
Tepper goes on to discuss monopolies and monopsonies. At the heart of the issue is the zombie company phenomenon. With interest rates at artificially low levels, companies which should have been liquidated have survived. Others have used their access to finance, gained from many years of negotiation with their bankers, to buy out their competitors. If interest rates were correctly priced this would not have been possible – these zombie corporations would have gone to the wall. I wrote a rather long two part essay on this subject in 2016 for the Cobden Centre – A history of Fractional Reserve Banking – or why interest rates are the most important influence on stock market valuations? This is about the long-run even by my standards but I commend it to those of you with an interest in economic history. Here is a brief quote from part 2:-
…This might seem incendiary but, let us assume that the rate of interest at which the UK government has been able to borrow is a mere 300bp below the rate it should have been for the last 322 years – around 4% rather than 7%. What does this mean for corporate financing?
There are two forces at work: a lower than “natural” risk free rate, which should make it possible for corporates to borrow more cheaply than under unfettered conditions. They can take on new projects which would be unprofitable under normal conditions, artificially prolonging economic booms. The other effect is to allow the government to crowd out private sector borrowing, especially during economic downturns, where government borrowing increases at the same time that corporate profitability suffers. The impact on corporate interest rates of these two effects is, to some extent, self-negating. In the long run, excessive government borrowing permanently reduces the economic capacity of the country, by the degree to which government investment is less economically productive than private investment.
To recap, more people are remaining in education, more people are working freelance or part-time and more people are choosing to retire early. The appreciation of the stock, bond and property markets has certainly helped those who are asset rich, choose to exit the ranks of the employable, but, I suspect, in many cases this is only because asset prices have been rising for the past decade. Pension annuity rates appear to have hit all-time lows, a reckoning for asset markets is overdue.
What happens come the next bust and beyond?
If inflation rises and Central Banks respond by raising interest rates, bond prices will fall and stocks will have difficulty avoiding the force of gravity. Once bond and stock markets fall, property prices are likely to follow, as the cost of financing mortgages increases. With all the major asset classes in decline, economic growth will slow and unemployment will rise. Meanwhile, the need to work, in order to supplement the reduction in income derived from a, no longer appreciating, pool of assets, will increase, putting downward pressure on average earnings. Here is the most recent wage, inflation and real wage data. For France, Germany and the UK, wages continue to lag behind prices. A 2% inflation target is all very well, just so long as wages can keep up:-
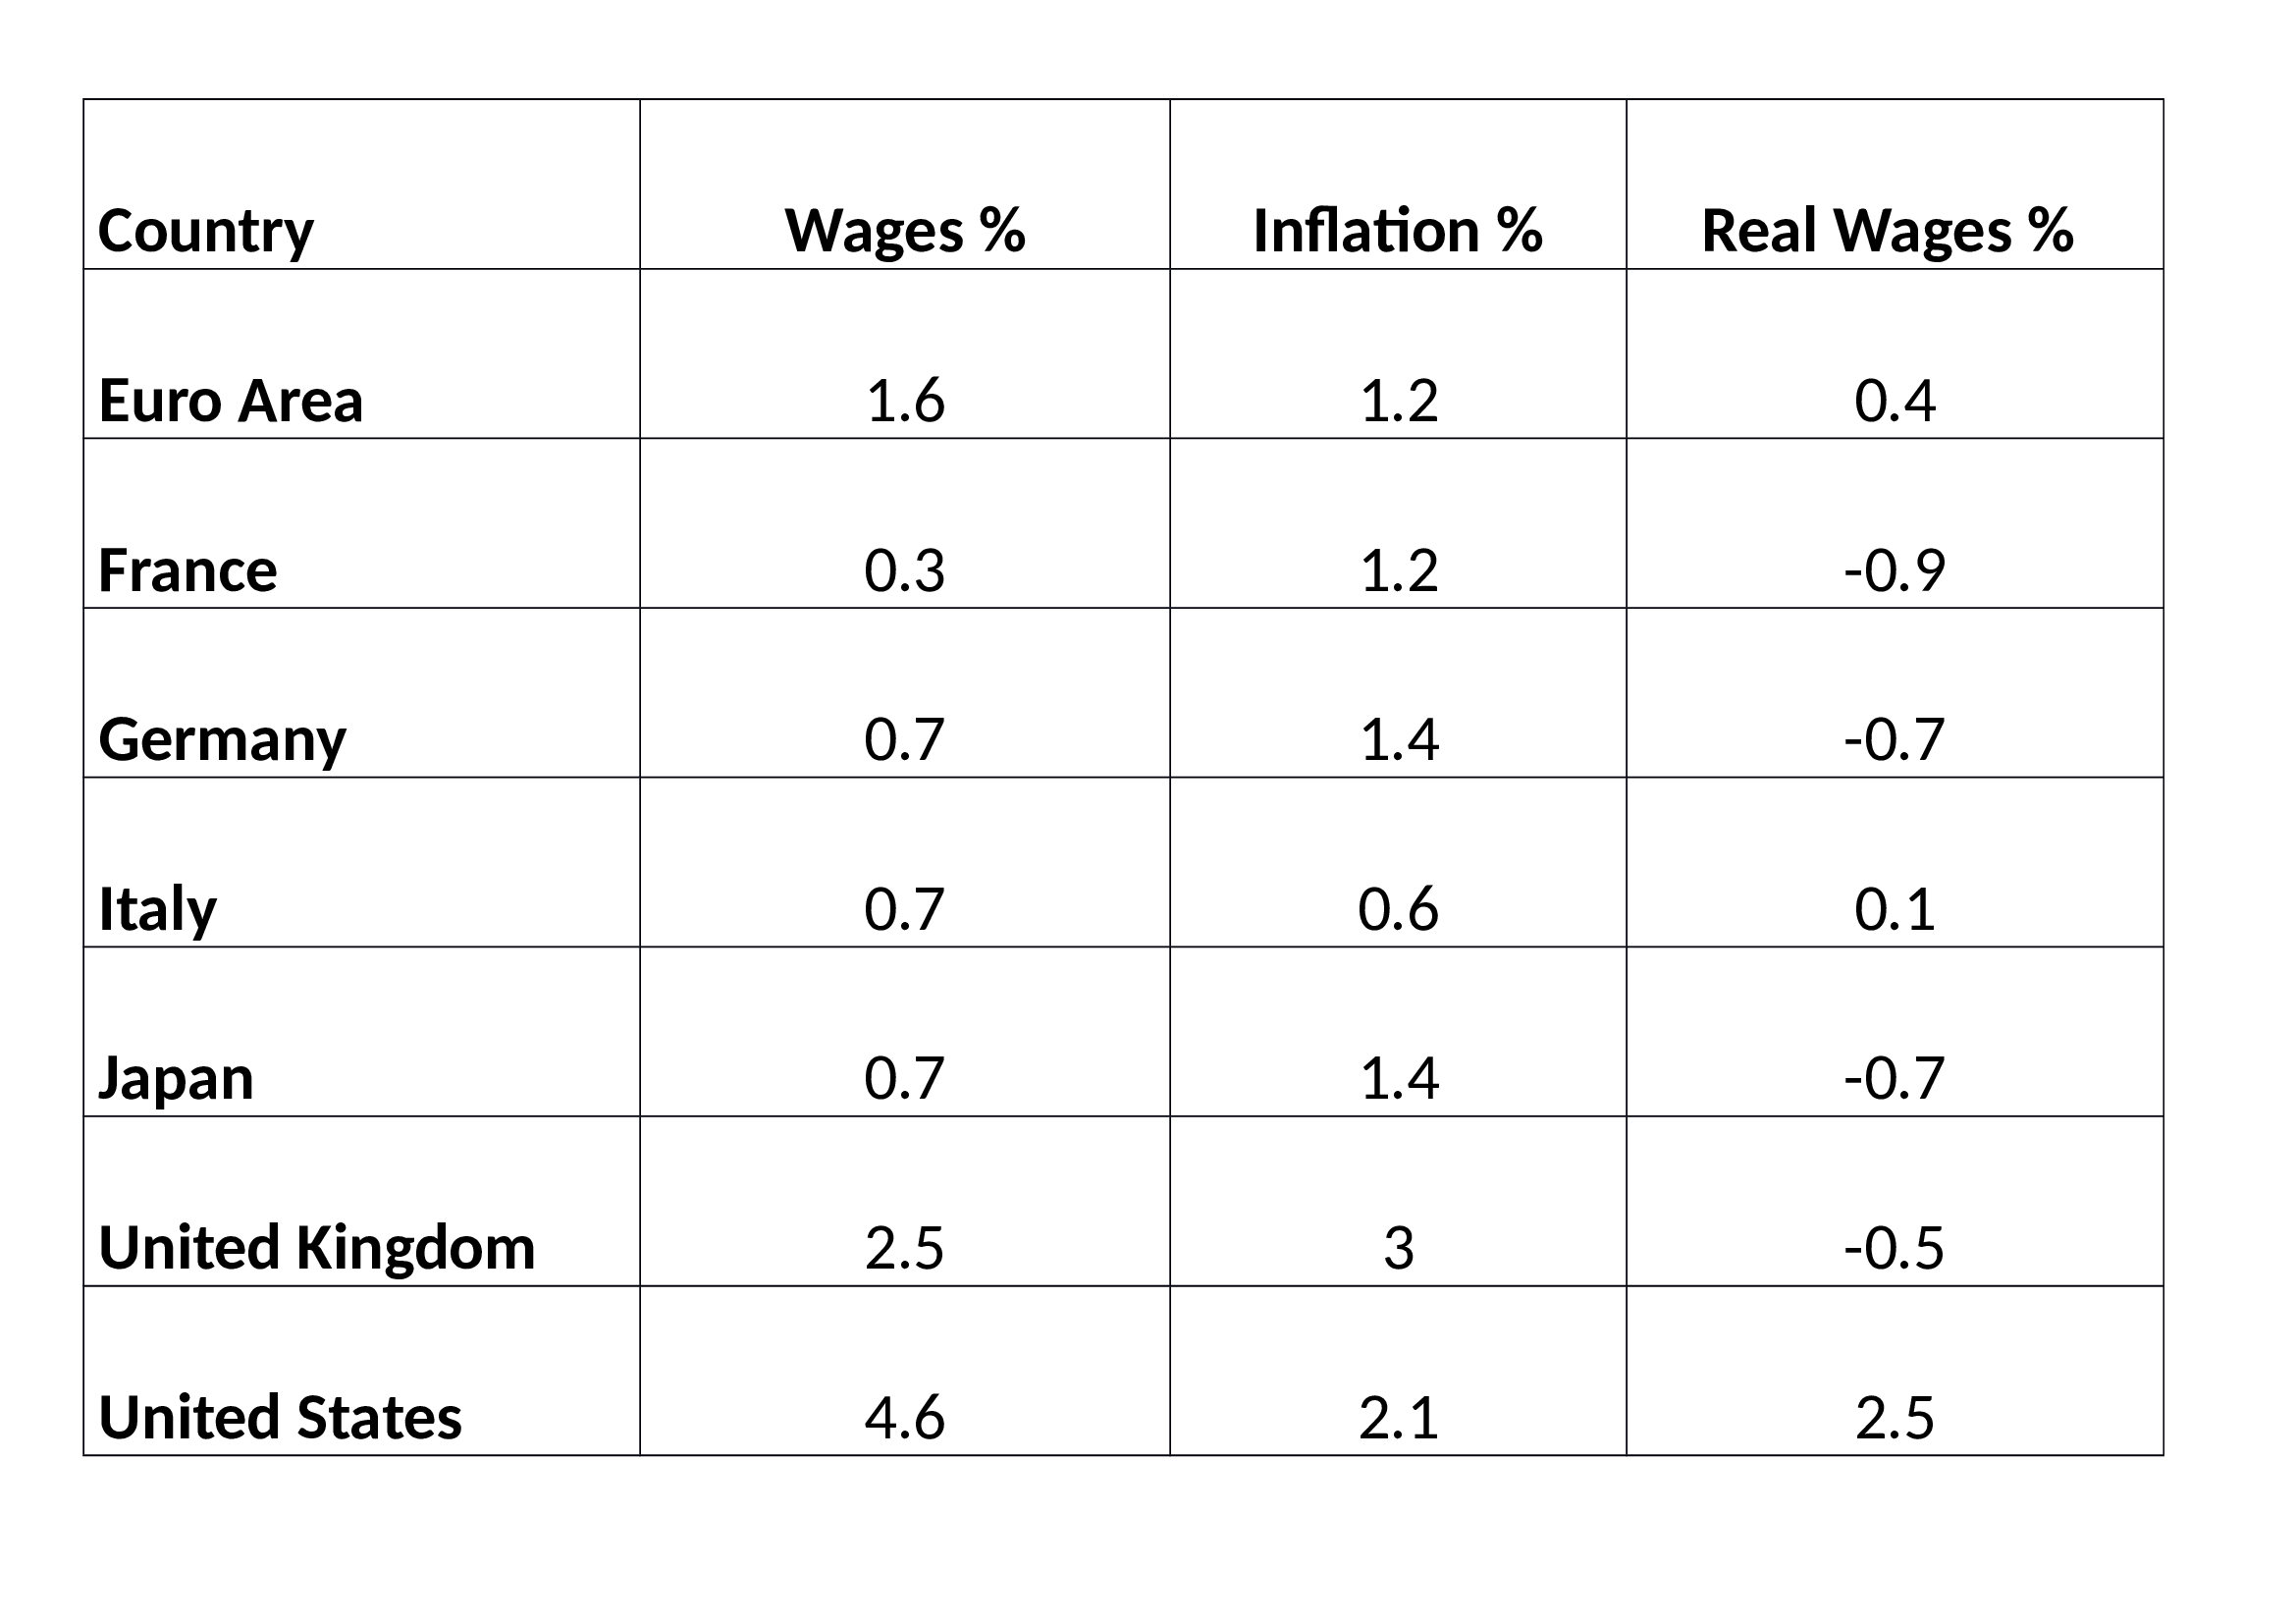
Source: Trading Economics
The first place where this trend in lower earnings will become evident is likely to be among freelance and part-time workers – at least they will still have employment. The next casualty will be the fully employed. Corporations will lay-off staff as corporate profit warnings force their hands. Governments will be beseeched to create jobs and, regardless of whether the inflation rate is still rising or not, Central Banks will be implored, cajoled (whatever it takes) to cut interest rates and renew their quest to purchase every asset under the sun.
Wage deflation will, of course, continue, harming those who have no alternative but to work; those who lack sufficient unearned income to survive. Government debt will accelerate, Central Bank balance sheets will balloon and asset prices will eventually recover. Bond yields may even reach new record lows, prompting assets to flow into stocks – the ones Central Banks have not yet purchased as part of their QQE programmes – despite their inflated valuations. Corporate executives will no doubt take the view that interest rates are artificially low and conclude that they can best serve their shareholders by buying back their own stock – accompanied by the occasional special dividend to avoid accusations for impropriety.
As economic growth takes a nose drive, inflation will moderate, providing justification for the pre-emptive rate cutting and balance sheet expanding actions of the Central Banks. Articles will begin to appear, in esteemed journals, talking of a new era of low economic trend growth. Finally, after several years of QE, QQE and whatever the stage beyond that may be – helicopter money anyone? – the world economy will start to grow more rapidly and the labour force participation rate, increase once more. Inflation will start to rise, interest rates will be tightened, bond yields, increase. At this point, stocks will fall and the next downward leg of the economic cycle will have to be averted by renewed QQE and fiscal stimulus. If this is reminiscent of a scene from Groundhog Day, I regret to inform you, it is.
There will be a point at which the financialisation of the global economy and the nationalisation of the stock market can no longer deliver the markets from the deleterious curse of debt, but, sadly, I do not believe that moment has yet arrived. Are we nearly there yet? Not even close.
Linear Talk – Interview with Gabriel Stein of Stein Brothers – The impact of QT
