UK Financial Services – Opportunities and Threats Post-Brexit – Short-term Pain, Long-term Gain?

In the Long Run - small colour logo

Macro Letter – No 102 – 28-09-2018

UK Financial Services – Opportunities and Threats Post-Brexit – Short-term Pain, Long-term Gain?

  • A Brexit deal is still no closer, but trade will not cease even if the March deadline passes
  • In the short-term UK and EU economic growth will suffer
  • Medium-term new arrangements will hold back capital investment
  • Long-term, there are a host of opportunities, in time they will eclipse the threats

In a departure from the my usual format this Macro Letter is the transcript of a speech I gave earlier this week at the UK law firm, Collyer Bristow; Thomas Carlisle may have dubbed Economics ‘the dismal science,’ but I remain an optimist.

Setting aside the vexed question of whether Brexit will be hard, soft or stalled, the impact on financial services (and, indeed, the majority of UK trade in goods and services) will be dramatic.

Financial markets (and businesses in general) loathe uncertainty. Ever since the referendum result, investment decisions have been postponed or cancelled. When investment is being made it is generally tentative and defensive. Exporters and importers alike are striving to develop alternative strategies to maintain and protect their franchises.

As a long-term economic commentator, I try to look beyond the immediate impact of events, since near-term expectations are usually reflected in the valuation of an asset or currency. Brexit, however, is a particular challenge, not only due to near-term uncertainty but because policy decisions taken now and in the wake of the March 2019 deadline could set the UK economy on an unusually wide array of possible trajectories.

Near-term

To begin an analysis of the impact post-Brexit on financial services, there are several near-term threats; here are a selection: –

  1. House Prices

Earlier this month Mark Carney, the Governor of the Bank of England, warned cabinet ministers that a ‘no-deal’ on Brexit could see house prices decline by as much as one third and a rapid rise in defaults. The subsequent impact on financial institutions balance sheets and the inevitable curtailment of bank lending could be severe. Jacob Rees-Mogg even dubbed him, ‘The High Priest of Project Fear.’

  1. Passporting

Assuming no deal is agreed, the access which financial services providers in the UK have had to the EU27 will not be available after March 2019. Many existing contracts and licensing agreements will need to be rewritten.

  1. Regulatory equivalence

Divergence between the regulatory regime in the UK and Europe remains a distinct risk. The types of legal issues surrounding, for example, ISDA Master agreements (Deutsche Bank AG v Comune di Savona) will inevitably become more widespread.

  1. Systemic Risks to the Euro

The ECB is vocal in its mission to maintain control over the clearing and settlement of Euro denominated transactions. Many financial services activities which currently take place in the UK may need to be transferred to another EU country.

In the near-term, these types of factors will reduce trade and economic growth, both in the UK and, to a lesser degree, in Europe. In May 2017 I wrote an essay entitled ‘Hard Brexit Maths – Walking Away’ in which I estimated the negative impact a no-deal Brexit would have on the EU. The UK’s NIESR estimated the bill for a Hard Brexit to the UK at EUR66bln/annum. I guesstimated the cost of Hard Brexit to the EU at EUR 62bln/annum. Both forecasts will probably prove inaccurate.

The reduced free movement of workers from the EU is another significant factor. It will lead to a rise in a toxic combination of skill shortages (due to new immigration controls) and unemployment, as companies are forced to conserve capital to weather the inevitable economic slowdown.

There are, however, several near-term opportunities, here are a small selection: –

  1. Sterling weakness

The currency has already weakened. Whilst this may be inflationary it makes UK exports more competitive. Whether the UK can take advantage of currency weakness remains to be seen, history is not on our side in this respect.

  1. A US boom

Aided by a lavish tax cut, the US economy is growing faster than at any-time since the financial crisis, underpinning its currency. Its trade deficit is growing despite tariff barriers.

  1. US Trade policy

The Trump administration appears to have focused its ire on trade surplus countries, of which Germany is the largest European example. The UK is not under the White House microscope to the same degree.

Seizing the opportunity presented by these financial and geopolitical shifts is easier to speak of than to grasp. Nonetheless, just this month Absa Bank of South Africa (recently spun-off from Barclays) announced plans to open a London office to capitalise on post-Brexit opportunities connected with the fast-growing economies of Africa.

Medium-term

The medium-term risks will mostly be borne out of inertia. Until the shape of Brexit is clear, decisions will continue to be postponed. Once Brexit occurs there will be inevitable technical problems, stemming from systems issues and new procedures. Growth will slow further, business operating costs will need to be cut, employment in financial services (and elsewhere) will decline at exactly the moment when greater investment should be undertaken.

But, new trade deals will be negotiated, not just with Europe and the US, but also with the countries of the British Commonwealth, notably (but not just) India. Many of these countries are among the fastest growing economies in the world, often imbued with benign demographics. Here is a rapidly expanding working age population in need of capital investment and financial services. Ruth Lea, Chief Economist at Arbuthnot Latham has commentated on this subject at length during the last two years. In April she wrote: –

Commonwealth countries, taken together, have buoyant economic prospects and their share of global output continues to increase (especially in PPP terms). The EU28 share, in contrast continues to decline.

UK exports to the top eight Commonwealth countries rose by over 31% between 2006 and 2016, but total exports rose by 40%. And the share of UK exports going to the top eight Commonwealth countries fell from 7.5% in 2006 to 7.0% in 2016…

There is little doubt that Commonwealth countries have the potential to be significant growth markets for the UK’s exports, given their favourable growth prospects and demographics. This is all the more likely given the probability of trade deals with individual Commonwealth countries after Brexit.

Long-term

David Riccardo defined the law of comparative advantage just over two hundred years ago. Perhaps one of the best examples of the continuance of the phenomenon is Switzerland, which has seen its currency appreciate against the US$ by approximately 3% per year, every year since fiat currencies were freed from their shackles after the collapse of the Bretton Woods agreement in 1971. Here is a chart of the US$/CHF exchange rate over the period: –
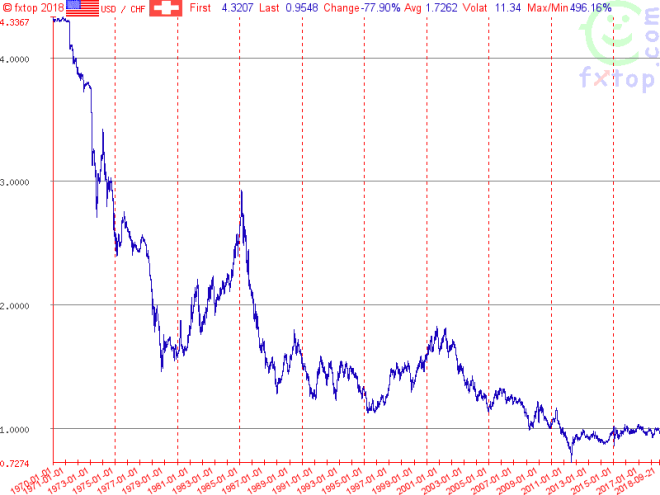
USDCHF 1970 to 2018

Source: fxtop.com

The Swiss turned to pharmaceuticals and other value-added businesses. The success of this strategy, despite a constantly appreciating currency, has spawned an entire industrial region – the Rhone-Alp economic area, which incorporates German, French, Italian and Austrian companies bordering Switzerland. This region is among the most economically productive in the EU.

The UK has an opportunity, post-Brexit, to focus on economic growth. As a trading nation, we should concentrate our efforts on re-forging links with the fast-growing countries of the Commonwealth, where the advantages of a common language and legal system favour the UK over other developed nations.

An example of this opportunity is in education. We have a world class reputation for education and training. Combine this redoubtable capability with the abundance of new technologies, which permit the delivery of content globally via the internet, and we can provide the full gamut of instruction, ranging from primary to tertiary and professional via a combination of video content, on-line examination and tailored digital collateral.

A recent MOOC (Mass Open On-line Course) In which I enrolled, attracted students from across the world. The course was dedicated to finance and among the students with whom I interacted was a Masi tribesman from Kenya who hoped to develop micro-finance solutions for the local farming community. The world is our veritable oyster.

Conclusion – The Bigger Picture

The economies of the developed world are growing more slowly than those of developing nations. Providing goods and services to the fastest growing economies makes economic sense. Many of the largest companies listed on the UK stock market have been oriented to take advantage of this dynamic for decades. Brexit is proving to be cathartic, we should embrace change: the sooner the better.

The Austrian economist, Joseph Schumpter, described the cycle of economic development as including a period of ‘creative destruction’. Brexit could be an extreme version of this process. The patterns of trade which have developed since the end of WW2 have been concerned with promoting cohesion between European nations, but, as Hyman Minsky famously noted, ‘stability creates the seeds of instability.’ I believe the political polarisation seen in Europe and elsewhere is a reaction against the success of the global financial and economic system and the institutions and alliances created to insure its success. We are entering an era of change and Brexit is but one personification of a growing trend. Technology has shrunk the world, empowered the individual and (in the process) undermined the influence of nation states and international institutions. Individual freedom is ascendant but with freedom comes responsibility.

One of the greatest challenges facing the UK and other developed nations, in the long run, is the provision of pensions and health insurance to an increasingly ageing population. Many of the financial products required by these ageing consumers are ones in which the UK is a world leader. The developing world is rapidly growing richer too. Their citizens will require these self-same products and services. Brexit is an opportunity to look forward rather than back. If we embrace change we will thrive, if not change will occur regardless. Post-Brexit there will be considerably pain but, if we manage to learn from history, there can also be long-term gain.

A warning knell from the housing market – inciting a riot?

A warning knell from the housing market – inciting a riot?

In the Long Run - small colour logo

Macro Letter – No 90 – 02-02-2018

A warning knell from the housing market – inciting a riot?

  • Global residential real estate prices continue to rise but momentum is slowing
  • Prices in Russia continue to fall but Australian house prices look set to follow
  • After a decade of QE, real estate will be more sensitive to interest rate increases

As anyone who owns a house will tell you, all property markets are, ‘local.’ Location is key. Nonetheless, when looking for indicators of a change in sentiment with regard to asset prices in general, residential real estate lends support to equity bull markets. Whilst it usually follows the performance of the stock market, this time it may be a harbinger of austerity to come.

The most expensive real estate is to be found in areas of limited supply; as Mark Twain once quipped, when asked what asset one should invest in, he replied, ‘Buy land, they’re not making it anymore.’ Mega cities are a good example of this phenomenon. They are a sign of progress. As Ian Stewart of Deloittes put it in this week’s Monday Briefing – How distance survived the communication revolution:-

In 2014, for the first time, more of the world’s population, some 54%, lived in urban than rural areas. The UN forecasts this will rise to 66% by 2050. Businesses remain wedded to city locations. More of the UK’s top companies are headquartered in London than a generation ago. The lead that so-called mega cities, those with populations in excess of 10 million, such as Tokyo and Delhi, have over the rest of the country has increased.

Proximity matters, and for good reasons. Cities offer business a valuable shared pool of resources, particularly labour and infrastructure. Bringing large numbers of people and businesses together increase the chances of matching the right person with the right job. The scale of cities improves matching in other areas, from restaurants to education and the choice of a partner. Scale, in terms of the number of businesses, tend to stimulate competition and productivity.  Nor has technology fulfilled its promise to work equally well everywhere. By and large, technology tends to work better in urban areas than the country.

Urbanisation facilitates learning and the diffusion of knowledge, two vital processes for the modern economy. Workers in cities can more easily change jobs without changing homes, enabling the transfer of ideas across businesses. On-line learning has supplemented, but shows few signs of usurping the classroom, lecture theatre or face to face contact. Despite the collapsing cost of communication, competition for entry to the best schools and universities has intensified in the last three decades.

For all the transformative effects of the communication revolution the lead that cities have over the rest of the country seems to be widening. The LSE reports that in the UK workers in urban areas earn 8% more than those elsewhere; in London the premium is 24%. Buoyant property prices in major cities underscore the gap.

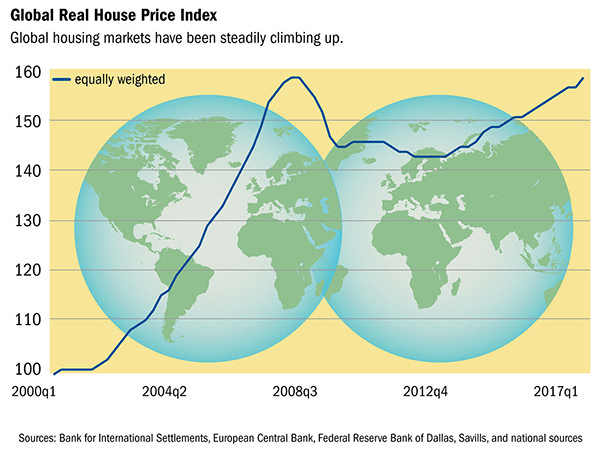
The world’s mega-cities have seen the highest house price inflation but at the national level the momentum of house price increases has begun to slow as prices approach the 2008 highs once more. The chart below, care of the IMF, shows the strength of momentum still increasing in Q2 2017:-

globalhousepriceindex

Source: IMF

By Q3 2017 Global Property Guide analysis suggested a sea-change had begun:-

During the year to the third quarter of 2017:

House prices rose in 24 out of the 46 world’s housing markets which have so far published housing statistics, using inflation-adjusted figures.

The more upbeat nominal figures, more familiar to the public, showed house price rises in 38 countries, and declines in 8 countries.

Upwards price momentum is weakening.

Europe, Canada, Hong Kong, and Macau continue to experience strong price rises.  But most of the Middle East, Latin America, New Zealand and some parts of Asia are experiencing either house price falls – or a sharp deceleration of house price rises.

The five strongest housing markets in our global house price survey for the third quarter of 2017 were: Iceland (+18.76%), Hong Kong (+13.14%), Macau (+10.53%), Canada (+9.69%), and Romania (+9.36%).

The biggest y-o-y house-price declines were in Egypt (-8.68%), Kiev, Ukraine (-6.81%), Russia (-6.69%), Mongolia (-5.7%), and Qatar (-2.85%).

Only 15 of the 46 markets analysed showed increased upward momentum. Hardly cause for concern, one might think; after all, during the nine year equity bull-market, stock momentum has waxed and waned. However, one market in particular (which, incidentally, is not covered by Global Property Guide analysis) has seen falling prices during the past quarter – Australia.

As the chart below shows, Australian house prices were among the fastest rising in Q2:-

housepricesaroundtheworld

Source: IMF

Sydney has been even more extreme:-

Sydney-house-price-cycle-nov-2-2017

Source: Core Logic

On the basis that, what goes up must, inevitably, come back down, one could argue that a price correction is needed, however, unlike the stock market, house prices have a much stronger impact on the spending habits of the consumer.

The consumer is impacted by the cost of financing mortgage borrowing and their ability to remortgage, relies on a steady increase in the value of housing stock. Rising bond yields, led by the US, where 10yr yields have broken through 2.62% to the upside this week, are likely to be a cause for concern. In Australia, however, fixed rate deals (where they exist) tend to be only two to three years in duration. The remainder of mortgages are variable rate. 1yr Australian bond yields are higher – touching 1.78% this month – but they are still only 40bp off their August 2016 lows.

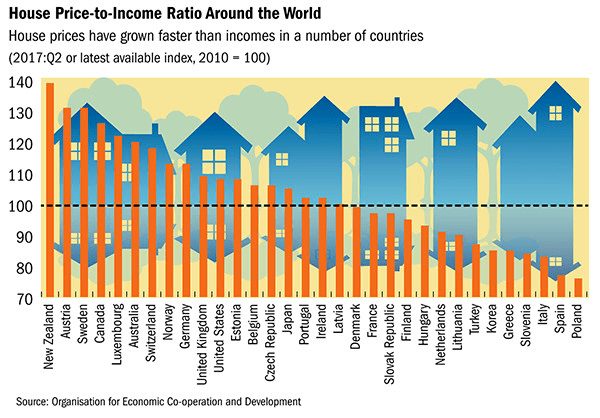
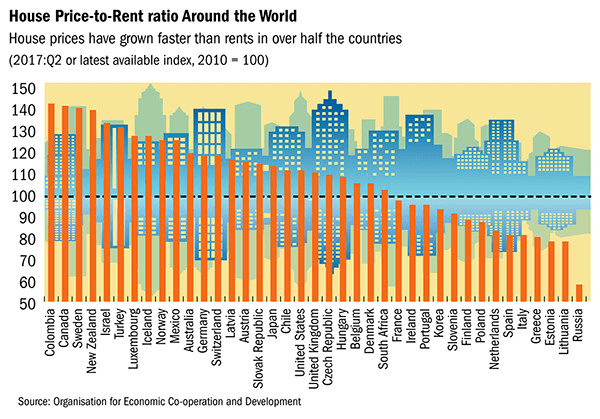
Housing affordability is also a function of price to income and price to rent:-

pricetoincome

Source: IMF

Australia remains one of the most expensive places to buy a house, although their planning constrained neighbour New Zealand is even less affordable, which helps to explain the 1.24% fall in prices for Q3.

pricetorent

Source: IMF

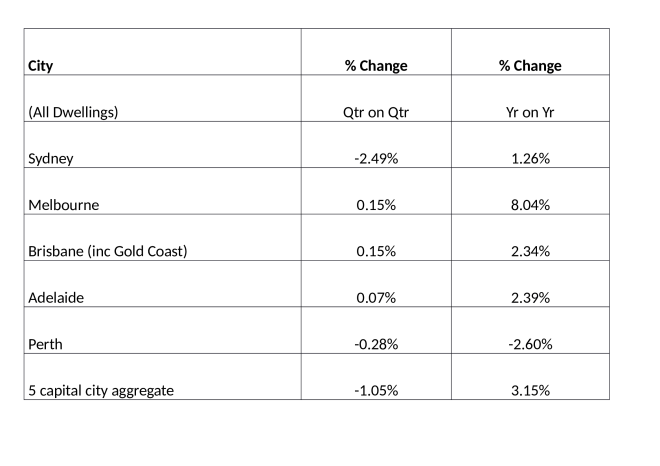
Australia is not the most expensive market on a price to rent basis either, yet, despite relatively low interest rates (and rising commodity prices which have supported the currency) residential real estate prices have begun to decline. The table below shows the quarter on quarter and year on year price change for the five major cities as at 31st January:-

Australian_Cities_house_prices_31-1-2018_Core_Logi

Source: CoreLogic

The residential real estate market in Perth has been depressed for several years, but Sydney (led by high-end central Sydney apartments) has begun to follow its western neighbour.

Conclusions and Investment Opportunities

The residential real estate market often reacts to a fall in the stock market with a lag. As commentators put it, ‘Main Street plays catch up with Wall Street.’ The Central Bank experiment with QE, however, makes housing more susceptible to, even, a small rise in interest rates. The price of Australian residential real estate is weakening but its commodity rich cousin, Canada, saw major cities price increases of 9.69% y/y in Q3 2017. The US market also remains buoyant, the S&P/Case-Shiller seasonally-adjusted national home price index rose by 3.83% over the same period: no sign of a Federal Reserve policy mistake so far.

As I said at the beginning of this article, all property investment is ‘local’, nonetheless, Australia, which has not suffered a recession for 26 years, might be a leading indicator. Contagion might seem unlikely, but it could incite a riot of risk-off sentiment to ripple around the globe.

Global Real Estate and the end of QE – Is it time to be afraid?

Global Real Estate and the end of QE – Is it time to be afraid?

In the Long Run - small colour logo

Macro Letter – No 86 – 03-11-2017

Global Real Estate and the end of QE – Is it time to be afraid?

  • Rising interest rates and higher bond yields are here to stay
  • Real estate prices seem not to be affected by higher finance costs
  • Household debt continues to rise especially in advanced economies
  • Real estate supply remains constrained and demand continues to grow

During the past two months two of the world’s leading central banks have begun the process of unwinding or, at least, tapering the quantitative easing which was first initiated after the great financial recession of 2008/2009. The Federal Reserve FOMC statement for September and their Addendum to the Policy Normalization Principles and Plans from June contain the details of the US bank’s policy change. The ECB Monetary policy decision from last week explains the European position.

Whilst the Federal Reserve is reducing its balance sheet by allowing US treasury holdings to mature, the US government has already breached its debt ceiling and will need to issue new bonds. The pace of US money supply growth is unlikely to be reversed. Nonetheless, 10yr US bond yields have risen from a low of 1.35% in July 2016 to more than 2.6% earlier this year. They currently yield around 2.4%. Over the same period 2yr US bond yields have risen from 0.49% to a new high, this week, of 1.60% – their highest since October 2008.

Back in April I wrote about the anomaly in the US interest rate swaps market – US 30yr Swaps have yielded less than Treasuries since 2008 – does it matter? What is interesting to note, in relation to global real estate, is that the 10yr Swap spread over US Treasuries (which is currently negative) has remained stable at -8bp during the recent rise in yields. Normally as interest rates on government bonds declines credit spreads tighten – as rates rise these spreads widen. So far, this has not come to pass.

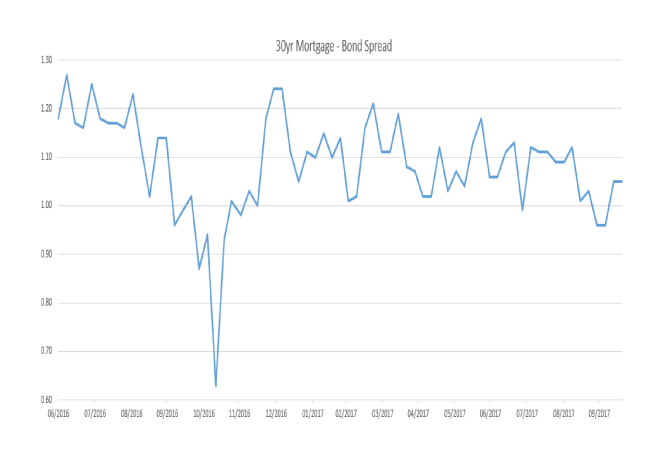
In the US, mortgages are, predominantly, long-term and fixed rate. US 30yr mortgage rates has also risen since July 2016 – from 2.09% to 3.18% at the end of December. Since then rates have moderated, they now stand at 2.89%, approximately 1% above US 30yr bonds. The chart below shows the spread since July 2016:-

30yr_Mortgage_-_Bond_Spread_July_2016_to_October_2

Source: Federal Reserve Bank of St Louis

Apart from the aberration during the US presidential elections the spread between 30yr US Treasuries and 30yr Mortgages has been steadily narrowing despite the tightening of short term interest rates and the increase in yields across the maturity spectrum.

Mortgage finance costs have increased since July 2016 but by less than 50bp. What impact has this had on real estate prices? The chart below shows the S&P Case-Shiller House Price Index since 2006, the increase in mortgage rates has failed to slow the rise in prices. The year on year increase is currently running at 5.6% and forecasters predict this rate to increase to 5.8% when September data is released:-

SandP_Shiller_Case_House_Price_Index_-_2006-2017_Q

Source: Federal Reserve Bank of St Louis, S&P Case-Shiller

At the global level house prices have not taken out their pre-crisis highs, as this chart from the IMF reveals:-

globalhousepriceindex_lg

Source: IMF, BIS, ECB, Federal Reserve, Savills

The latest IMF – Global Housing Watch – report for Q2 2017 is sanguine. They take comfort from the broad range of macroprudential measures which have been introduced during the past decade.

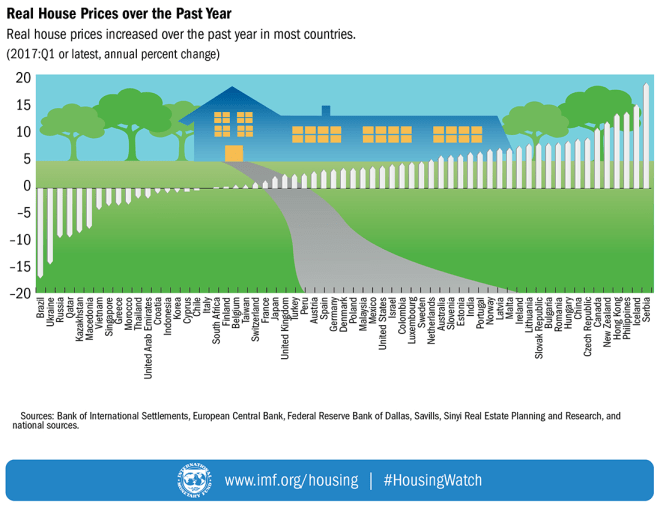
The IMF go on to examine house price increases on a country by country basis:-

housepricesaroundtheworld_lg

Source: IMF, BIS, ECB, Federal Reserve, Savills, Sinyl Real Estate

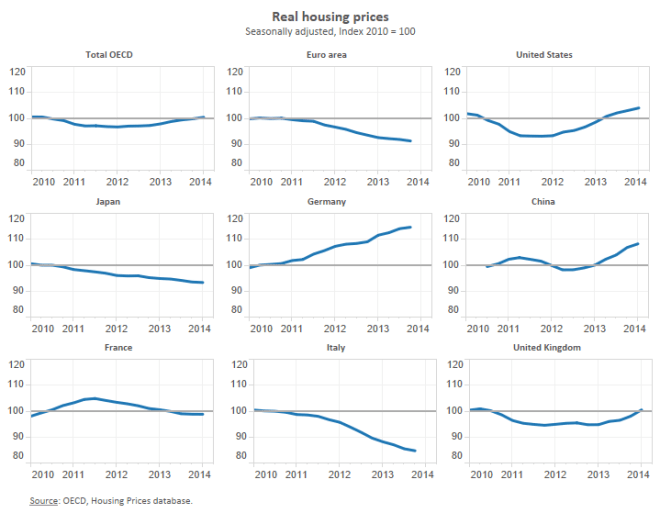
The OECD – Focus on house priceslooks at a variety of different metrics including changes in real house prices: the OECD average is more of less where it was in 2010 having dipped during 2011/2012 – here is breakdown across a selection of regions. Please note the charts are rather historic they stop at January 2014:-

OECD Real Estate charts 2010 -2014

Source: OECD

The continued fall in Japanese prices is not entirely surprising but the steady decline of the Euro area is significant.

Similarly historic data is contained in the chart below which ranks countries by Price to Income and Price to Rent. Portugal, Germany, South Korea and Japan remain inexpensive by these measures, whilst Belgium, New Zealand, Canada, Norway and Australia remain expensive. The UK market also appears inflated but the decline in Sterling may be a supportive factor: international capital is flowing into the UK after the devaluation:-

Real Estate P-E and P-R chart OECD

Source: OECD

Bringing the data up to date is the Knight Frank’s global house price index, for Q2 2017. The table below is sorted by real return:-

Real_Estate_Real_Return_Q2_2017_Knight_Frank

Source: Knight Frank, Trading Economics

There is a saying in the real estate market, ‘all property is local’. Prices vary from region to region, from street to street, however, the data above paints a picture of a global real estate market which has performed strongly in response to the lowering of interest rates. As the table below illustrates, the percentage of countries recording positive annual price changes is now at 89%, well above the levels of 2007, when interest rates were higher:-

Real_Estate_Price_Change_-_Knight_Frank

Source: Knight Frank

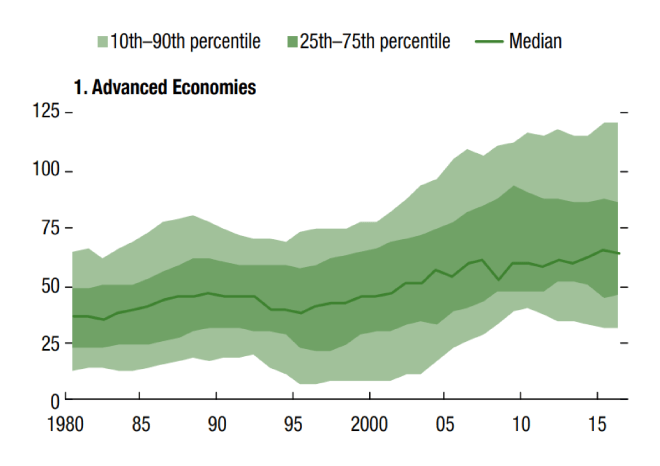
The low interest rate environment has stimulated a rise in household debt, especially in advanced economies. The IMF – Global Financial Stability Report October 2017 makes sombre reading:-

Although finance is generally believed to contribute to long-term economic growth, recent studies have shown that the growth benefits start declining when aggregate leverage is high. At business cycle frequencies, new empirical studies—as well as the recent experience from the global financial crisis—have shown that increases in private sector credit, including household debt, may raise the likelihood of a financial crisis and could lead to lower growth.

These two charts show the rising trend globally but the relatively undemanding levels of indebtedness typical of the Emerging Market countries:-

IMF_Household_Debt_to_GDP_ratios_-_Advanced_Econom

Source: IMF

IMF_Household_Debt_to_GDP_ratios_-_Emerging_Econom

Source: IMF

As long ago at February 2015 – McKinsey – Debt and (not too much) deleveraging – sounded the warning knell:-

Seven years after the bursting of a global credit bubble resulted in the worst financial crisis since the Great Depression, debt continues to grow. In fact, rather than reducing indebtedness, or deleveraging, all major economies today have higher levels of borrowing relative to GDP than they did in 2007. Global debt in these years has grown by $57 trillion, raising the ratio of debt to GDP by 17 percentage points.

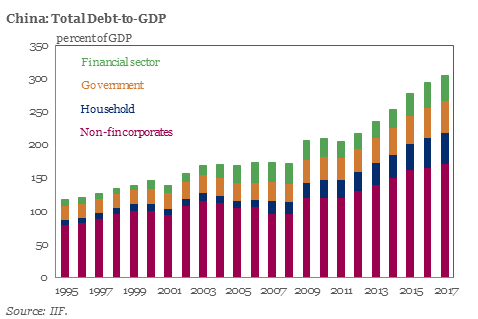
According to the Institute of International Finance Q2 2017 global debt report – debt hit a new all-time high of $217 trln (327% of global GDP) with China leading the way:-

iif china debt to GDP

Source: IIF

Household debt is growing in China but from a relatively low base, it is as the IMF observe, the advanced economies where households are becoming addicted to low interest rates and cheap finance.

Conclusions and investment opportunities

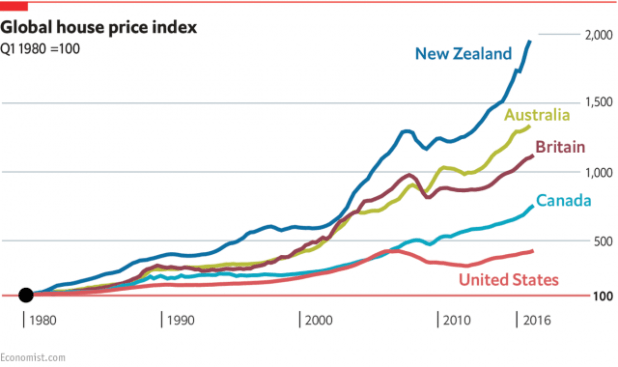
Economist Global House prices

Source: The Economist

The chart above shows a few of the winners since 1980. The real estate market remains sanguine, trusting that the end of QE will be a gradual process. Although as a recent article by Frank Shostak – Can gradual interest rate tightening prevent shocks? reminds us, ‘…there is no such thing as “shock-free” monetary policy’:-

Can a gradual tightening prevent an economic bust?

Since monetary growth, whether expected or unexpected, gives rise to the redirection of real savings it means that any monetary tightening slows down this redirection. Various economic activities, which sprang-up on the back of strong monetary pumping, because of a tighter monetary stance get now less real funding. This in turn means that these activities are given less support and run the risk of being liquidated.  It is the liquidation of these activities what an economic bust is all about.

Obviously, then, the tighter monetary stance by the Fed must put pressure on various false activities, or various artificial forms of life. Hence, the tighter the Fed gets the slower the pace of redirection of real savings will be, which in turn means that more liquidation of various false activities will take place. In the words of Ludwig von Mises,

‘The boom brought about by the banks’ policy of extending credit must necessarily end sooner or later. Unless they are willing to let their policy completely destroy the monetary and credit system, the banks themselves must cut it short before the catastrophe occurs. The longer the period of credit expansion and the longer the banks delay in changing their policy, the worse will be the consequences of the malinvestments and of the inordinate speculation characterizing the boom; and as a result the longer will be the period of depression and the more uncertain the date of recovery and return to normal economic activity.’

Consequently, the view that the Fed can lift interest rates without any disruption doesn’t hold water. Obviously if the pool of real savings is still expanding then this may mitigate the severity of the bust. However, given the reckless monetary policies of the US central bank it is quite likely that the US economy may already has a stagnant or perhaps a declining pool of real savings. This in turn runs the risk of the US economy falling into a severe economic slump.

We can thus conclude that the popular view that gradual transparent monetary policies will allow the Fed to tighten its stance without any disruptions is based on erroneous ideas. There is no such thing as a “shock-free” monetary policy any more than a monetary expansion can ever be truly neutral to the market.

Regardless of policy transparency once a tighter monetary stance is introduced, it sets in motion an economic bust. The severity of the bust is conditioned by the length and magnitude of the previous loose monetary stance and the state of the pool of real savings.

If world stock markets catch a cold central banks will provide assistance – though not perhaps to the same degree as they did last time around. If, however, the real estate market begins to unravel the impact on consumption – and therefore on the real economy – will be much more dramatic. Central bankers will act in concert and with determination. If the problem is malinvestment due to artificially low interest rates, then further QE and a return to the zero bound will not cure the malady: but this discussion is for another time.

What does quantitative tightening – QT – mean for real estate? In many urban areas, the increasing price of real estate is a function of geography and the limitations of infrastructure. Shortages of supply are difficult (and in some cases impossible) to alleviate; it is unlikely, for example, that planning consent would be granted to develop Central Park in Manhattan or Hyde Park in London.

Higher interest rates and weakness in household earnings growth will temper the rise in property prices. If the markets run scared it may even lead to a brief correction. More likely, transactional activity will diminish. A price collapse to the degree we witnessed in 2008/2009 is unlikely to recur. Those markets which have risen most may exhibit a greater propensity to decline, but the combination of steady long term demand and supply constraints, will, if you’ll pardon the pun, underpin global real estate.