Macro Letter – No 35 – 08-05-2015
Broken BRICs – Can Brazil and Russia rebound?
- The economies of Brazil and Russia will contract in 2015
- Their divergence with China and India is structural
- Economic reform is needed to stimulate long term growth
- Stocks and bonds will continue to benefit from currency depreciation
When Jim O’Neill, then CIO of GSAM, coined the BRIC collective in 2001, to describe the largest of the emerging market economies, each country was growing strongly, however, O’Neill was the first to acknowledge the significant differences between these disparate countries in terms of their character. Since the Great Recession the economic fortunes of each country has been mixed, but, whilst the relative strength of China and India has continued, Brazil and Russia might be accused of imitating Icarus.
Economic Backdrop
In order to evaluate the prospects for Brazil and Russia it is worth reviewing the unique aspects of, and differences between, each economy.
According to the IMF April 2015 WEO, Brazil is ranked eighth largest by GDP and seventh largest by GDP adjusted for purchasing power parity. Russia was ranked tenth and sixth respectively. Between 2000 and 2012 Brazilian economic growth averaged 5%, yet this year, according to the IMF, the economy is forecast to contract by 1%. The forecast for Latin America combined is +0.6%. For Russia the commodity boom helped GDP rise 7% per annum between 2000 and 2008, but with international sanctions continuing to bite, this year’s GDP is expected to be 3.8% lower.
Brazil’s service sector is the largest component of GDP at 67%, followed by the industry,27% and agriculture, 5.5%. The labour force is around 101mln, of which 10% is engaged in agriculture, 19% in industry and 71% in services. Russia by contrast is more reliant on energy and other natural resources. In 2012[update] oil and gas accounted for 16% of GDP, 52% of federal budget revenues and more than 70% of total exports. As of 2012 agriculture accounted for 4.4% of GDP, industry 37.6% and services 58%. The labour force is somewhat smaller at 76mln (2015).
The Harvard Atlas of Economic Complexity 2012 ranks Brazil 56th and Russia 47th. The table below shows the divergence in IMF forecasts since January. During the period October 2014 and February 2015 the Rouble (RUB) declined by 30% whilst the Brazilian Real (BRL) fell only 9%:-
| Country |
GDP |
GDP |
Forecast |
Forecast |
Jan-14 |
Jan-14 |
|
2013 |
2014 |
2015 |
2016 |
2015 |
2016 |
| Brazil |
2.7 |
0.1 |
-1 |
1 |
-1.3 |
-0.5 |
| Russia |
1.3 |
0.6 |
-3.8 |
-1.1 |
-0.8 |
-0.1 |
Source: IMF WEO April 2015
On March 14th the Bank of Russia published its three year economic forecast: it was decidedly rosy. This was how the Peterson Institute – The Incredibly Rosy Forecast of Russia’s Central Bank described it:-
…the Bank of Russia argues that the huge devaluation of the ruble that took place between October 2014 and February 2015 has a minor effect on economic growth. This claim neglects much empirical evidence that sharp devaluations retard investment activity, for two reasons. First, investment technology from abroad becomes more expensive—nearly 80 percent more expensive in the case of Russia. Second, devaluations increase uncertainty in business planning and hence slow down investment in domestic technology as well. Both effects work to depress economic activity in the short term.
…2017 is presented as the year of a strong rebound, as a result of cyclical macroeconomic forces. In particular, says the Bank of Russia, growth will reach 5.5 to 6.3 percent that year. It is true that the economy was already slowing down in 2012, before last year’s sanctions and devaluation. It is also true that the average business cycle globally has historically lasted about six years. But this is no ordinary cycle—sanctions are likely to play a bigger role than the Bank of Russia cares to admit. The main reason is their effect on the banking sector, where credit activity is already substantially curtailed, and may be curtailed even further once corporate eurobonds start coming due later this year. The devaluation has exacerbated the credit crunch as interest rates spiked in early 2015 to over 20 to 25 percent for business loans. These effects point in one direction: a prolonged recession.
Finally, the Russian government is reducing public investment in infrastructure in this year’s budget to try and cut overall expenditure by about 10 percent. This cutback is going to dampen growth because the multiplier on infrastructure investment is highest among all public expenditures. The Bank of Russia seems to have forgotten to account for this elementary fact of life.
Overall, the economic picture may end up being quite different from what the Bank of Russia forecasts. Instead of economic growth of –3.5 to –4 percent in 2015, –1 to –1.6 percent in 2016, and 5.5 to 6.3 percent in 2017, it may be closer to –6 to –7 percent in 2015, –3 to –4 percent in 2016, and zero growth in 2017. This scenario is worth contemplating, as it would mean that the reserve fund that the government uses to finance its deficit may be fully depleted in this period. What then?
The table below compares a range of other indicators for the two economies:-
| Indicator |
Brazil |
|
|
Russia |
|
|
| |
Last |
Reference |
Previous |
Last |
Reference |
Previous |
| Interest Rate |
13.25% |
Apr-15 |
12.75 |
12.50% |
Apr-15 |
14 |
| Government Bond 10Y |
12.90% |
May-15 |
|
10.71% |
May-15 |
|
| Stock Market YTD* |
14.70% |
May-15 |
|
23.20% |
May-15 |
|
| GDP per capita |
$5,823 |
Dec-13 |
5730 |
$6,923 |
Dec-13 |
6849 |
| Unemployment Rate |
6.20% |
Mar-15 |
5.9 |
5.90% |
Mar-15 |
5.8 |
| Inflation Rate – Annual |
8.13% |
Mar-15 |
7.7 |
16.90% |
Mar-15 |
16.7 |
| PPI – Annual |
2.27% |
Jan-15 |
2.15 |
13% |
Mar-15 |
9.5 |
| Balance of Trade |
$491mln |
Apr-15 |
458 |
$13,600mln |
Mar-15 |
13597 |
| Current Account |
-$5,736mln |
Mar-15 |
-6879 |
$23,542mln |
Feb-15 |
15389 |
| Current Account/GDP |
-4.17% |
Dec-14 |
-3.66 |
1.56% |
Dec-13 |
3.6 |
| External Debt |
$348bln |
Nov-14 |
338 |
$559bln |
Feb-15 |
597 |
| FDI |
$4,263mln |
Mar-15 |
2769 |
-$1,144mln |
Aug-14 |
12131 |
| Capital Flows |
$7,570mln |
Feb-15 |
10826 |
-$43,071mln |
Nov-14 |
-10260 |
| Gold Reserves |
67.2t |
Nov-14 |
67.2 |
1,208t |
Nov-14 |
1150 |
| Crude Oil Output ,000’s |
2,497bpd |
Dec-14 |
2358 |
10,197bpd |
Dec-14 |
10173 |
| Government Debt/GDP |
58.91% |
Dec-14 |
56.8 |
13.41% |
Dec-13 |
12.74 |
| Industrial Production |
-9.10% |
Feb-15 |
-5.2 |
-0.60% |
Mar-15 |
-1.6 |
| Capacity Utilization |
79.70% |
Feb-15 |
80.9 |
59.85% |
Mar-15 |
62.04 |
| Consumer Confidence** |
99 |
Apr-15 |
100 |
-32 |
Feb-15 |
-18 |
| Retail Sales YoY |
-3.10% |
Feb-15 |
0.5 |
-8.70% |
Mar-15 |
-7.7 |
| Gasoline Prices |
$1.04/litre |
Mar-15 |
1.16 |
$0.68/litre |
Apr-15 |
0.61 |
| Corporate Tax Rate |
34% |
Jan-14 |
34 |
20% |
Jan-15 |
20 |
| Income Tax Rate |
27.50% |
Jan-14 |
27.5 |
13% |
Jan-15 |
13 |
| Sales Tax Rate |
19% |
Jan-14 |
19 |
18% |
Jan-15 |
18 |
|
|
|
|
|
|
|
| *Bovespa = Brazil |
|
|
|
|
|
|
| *Micex = Russia |
|
|
|
|
|
|
| ** Consumer confidence in Brazil – 100 = neutral, Consumer confidence in Russia – 0 = neutral |
Source: Trading Economics and Investing.com
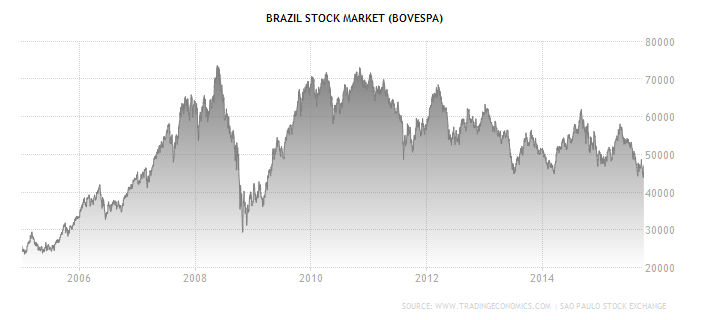
From this table it is worth highlighting a number of factors; firstly interest rates. Rates continue to rise in Brazil despite the relatively benign inflation rate. The rise in the Russian, Micex stock index has been much stronger than that of the Brazilian, Bovespa, partly this is due to the larger fall in the value of the RUB and partly due to the recent recovery in the oil price. PPI inflation in Brazil remains broadly benign, especially in comparison with 2014, whilst in Russia it is stubbornly high – making last week’s rate cut all the more surprising.
Brazilian industrial production continues to decline, a trend it has been struggling to reverse, yet capacity utilisation remains relatively high. Russian industrial production never rebounded as swiftly from the 2008 crisis but has remained in positive territory for the last few years despite the geo-political situation. Remembering that one of Russia’s largest industries is arms manufacture – the country ranks third by military expenditure globally behind China and US – this may not be entirely surprising.
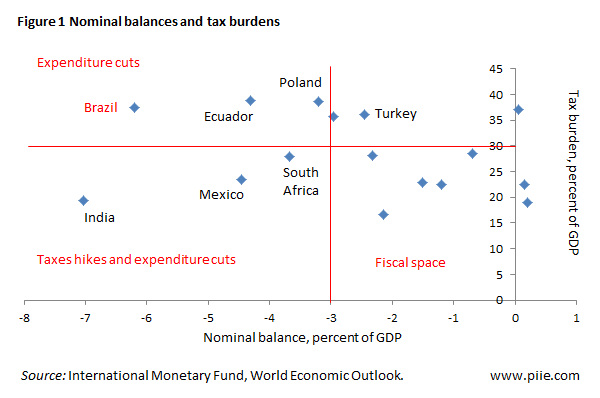
Of more concern for Brazil, is the structural nature of its current account deficit, since the advent of the Great Recession. This combination of deficit and inflation prompted Morgan Stanley, back in 2013, to label Brazil one of the “Fragile Five” alone side India, Indonesia, South Africa and Turkey. Russia, by contrast, has run a surplus for almost the entire period since the Asian crisis of 1998.
The Government debt to GDP ratio in Russia has risen slightly but the experience of the Asian crisis appears to have been taken on board. Added to which, the sanctions regime means Russia is cut off from international capital markets. In Brazil the ratio is not high in comparison with many developed nations but the ratio has been rising since 2011 and looks set to match the 2010 high of 60.9 next year if spending is not curtailed.
A final observation concerns gold reserves. Brazil has relatively little, although they did increase in January 2013 after a prolonged period at very low levels. Russia has taken a different approach, since 2008 its reserves have tripled from less than 400t to more than 1,200t today. There have been suggestions that this is a prelude to Russia adopting a “hard currency” standard in the face of continuous debasement of fiat currencies by developed nation central banks, but that is beyond the remit of this essay.
Are the BRICs broken?
In an article published in July 2014 by Bruegal – Is the BRIC rise over? Jim O’Neill discusses the future with reference to the establishment of a joint development bank:-
Some observers believed that the whole notion of a grouping of Brazil, Russia, India and China never made any sound sense because beyond having a lot of people, they didn’t share anything else in common. In particular, two are democracies, and two are not, obviously, China and Russia. Similarly, two are major commodity producers, Brazil and Russia, the other two, not. And their levels of wealth are quite different, with Brazil and Russia well above $10,000, China around $ 7-8 k, and India less than $ 2k per head. And the sceptic would follow all of this by saying, the only reason why Brazil and Russia grew so well in the past decade was simply due to a persistent boom in commodity prices, and once that finished, as appears to be the case now, then their economies would lose their shine, as indeed appears to be the case. Throw in that China would inevitably be caught by its own significant challenges at some point, which the doubters would say, is now, then all is left is India, and if it weren’t for the election of Modi recently, there has not been a lot to justify structural optimism about that country recently.
…I do believe each of Brazil and Russia have got some challenges to face, that they are not yet confronting, which at the core is to reduce their dependency to the commodity cycle, and while there are many differences between them, they do both need to become more competitive and entrepreneurial outside of commodities and to boost private sector investment.
The development has caused much political jawboning but I suspect its impact will be small in the near-term.
Looking again at the figures for capital flows, Brazil appeared to be in better shape, but Russian FDI has been positive in every quarter since 2008 until the most recent outflow in Q3 2014.
Consumer confidence in Brazil has remained more robust, possibly this is due to innate Latin optimism but it may be partly in expectation of the forthcoming Olympics. The games will take place in Rio, reminding us of the high urbanisation rates in Brazil, 85.4%. This is not dissimilar to Russia at 73.9% but substantially higher than China 54.4% and India 32.4%. Interestingly US urbanisation is 81.4% – but US GDP per capita is significantly higher.
Russia
The Peterson Institute – Russia’s Economic Situation Is Worse than It May Appear from early December 2014 painted a gloomy picture of the prospects:-
The Russian economy suffers from three severe blows: ever worsening structural policies, financial sanctions from the West, and a falling oil price.
…Russia is experiencing large capital outflows, expected to reach $120 billion. Because of Western financial sanctions, they are set to continue. The large outflows erupted in March as investors anticipated financial sanctions, which hit in July and in effect have closed financial markets to Russia. No significant international financial institution dares to take the legal risk of lending Russia money today.
Not wishing to be left out of the rhetoric on Russia’s demise, in late December the ECFR – What will be the consequences of the Russian currency crisis?:-
The watershed moment was the imposition of the third round of Western sanctions, which cut Russian companies off from the world’s financial markets. Along with falling oil prices (a key market factor), this caused market players to reassess the risks. Before the introduction of sanctions, the ratio of external debt to foreign exchange reserves (at 1.4) was not particularly worrying. But the fact that companies could no longer refinance their debt on external markets necessitated a rethink. It became clear that, with export revenues falling because of lower oil prices, companies would accumulate excess currency in their accounts. The supply of currency in the market from exporters (many of whom also had large debts) declined sharply, while demand from the debtor companies increased.
In October 2014 the Central Bank was forced to spend another $26 billion to support the rouble. After that, preserving the country’s reserves became the priority, so in November, the bank’s intervention fell to $10 billion. So everything was in place for a currency crisis and this is why the Russian Minister for the Economy called it “the perfect storm”. The storm was only halted by a sharp increase in the Central Bank’s interest rate and by informal pressure on companies that brought about a speedy decline in foreign exchange trading.
…So the double devaluation of the rouble will be felt in rising price and shrinking consumption. According to the Gaidar Institute for Economic Policy, this will add at least 10–12 percentage points to normal inflation, which will reach 15-20 percent. Import substitution options are relatively limited: large-scale import substitution would require significant investment and, at the moment, the resources for this are not there. And a fall in consumption (as a result of the falling purchasing power of households) will cause a decline in production.
According to the Central Bank’s December forecast, GDP in 2015 may fall by 4.5–4.8 percent. This is what the bank calls a “stress scenario”, and it assumes that the oil price will stay at $60 a barrel and Western sanctions will remain in place. In fact, this scenario seems to be the most realistic; any other scenario would involve either the lifting of sanctions or a rise in the oil price to $80 or even $100.
The dismal theme was inevitably taken up by CFR – The Russian Crisis: Early Days in early January:-
The most likely trigger for a future crisis resides in the financial sector. December’s $2 billion bailout of Trust Bank, coupled with news of large and potentially open-ended support for VTB Bank and Gazprombank, highlight the rapidly escalating costs of the crisis for the financial sector as state banks and energy companies face high dollar-denominated debt payments and falling revenues. Rising bad loans, falling equity values, and soaring foreign-currency debt are devastating balance sheets. As foreign banks pull back their support, the combination of sanctions, oil prices, and rising nonperforming loans is creating a toxic mix for Russian banks. So far, a crisis has been deferred by the belief that the central bank can and will fully stand behind the banking system. If any doubt creeps in about the strength of that commitment, a run will quickly materialize.
…Sanctions are a force multiplier. Western sanctions have taken away the usual buffers—such as foreign borrowing and expanding trade—that Russia relies on to insulate its economy from an oil shock. Over the past several months, Western banks have cut their relationships and pulled back on lending, creating severe domestic market pressures. The financial system has fragmented. Meanwhile, trade and investment have dropped sharply. These forces limit the capacity of the Russian economy to adjust to any shock. Russia could have weathered an oil shock or sanctions alone, but not both together.
…Measured by the severity of recent market moves, Russia is in crisis. But from a broader perspective, a comprehensive economic and financial crisis would cause a far greater degree of financial distress for the Russian people. Companies would find working capital unavailable; interest rates of 17 percent (or higher) and exchange rate depreciation would cause a spike in import prices; and capital expenditure would crater. All this would generate sharp increases in unemployment and a far greater fall in gross domestic product (GDP) than we have seen so far.
Chatham House – Troubled Times Stagnation, Sanctions and the Prospects for Economic Reform in Russia – published at the end of February, goes into more depth, concluding:-
Over the past three decades, a precipitous drop in oil prices (and a concomitant sharp reduction in rents) has resulted in economic reforms being undertaken in Russia. Mikhail Gorbachev’s perestroika emerged after the fall in oil prices in 1986. Putin’s earlier, more liberal economic policies were carried out after oil dropped to close to $10 a barrel in 1999. And Dmitri Medvedev’s modernization agenda was strongest in the aftermath of the global recession of 2008–09.
Unfortunately, the prospects for a similar surge in economic reform in Russia today are less good. The unfavourable geopolitical environment threatens to change the trajectory of political and economic development in Russia for the worse. By boosting factions within Russia’s policy elite who favour increased state control and less integration with the global economy, poor relations with the West threaten to reduce the prospects for a market-oriented turn in economic policy. As a result, the prevailing system of political economy that is in such urgent need of transformation may in fact be preserved in a more ossified form. Instead of responding to adversity through openness, Russia may take the historically well-trodden path of using a threatening international environment to justify centralization and international isolation in order to strengthen the existing ruling elite.
Thus, while Western sanctions were not necessarily intended to strengthen statist factions within Russia and force the country away from the global economy, this may prove to be an unintended but important outcome. Consequently, Russia appears to be locked into a path of economic policy inertia, as powerful constituencies that benefit from the existing system are strengthened by the showdown with the West. While Russia may have ‘won’ Crimea, and may even succeed in ensuring that Ukraine is not ‘won’ by the West, the price of victory may be a deterioration in long-term prospects for socioeconomic development.
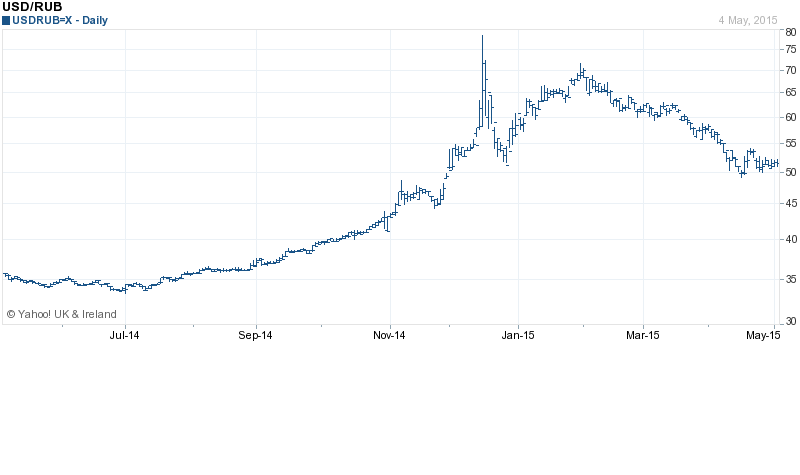
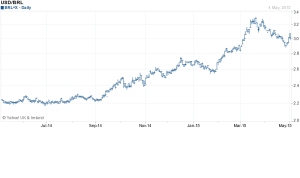
This is how the USDRUB has performed during the last 12 months, the first interest rate cut (from 17% to 15% took place on 30th January, the RUB fell 3% on the day to around USDRUB 70, since then the RUB has appreciated to around USDRUB 55-55:-

Source: Yahoo Finance
What caused the RUB to return from the brink was a recovery in the oil price and a slight improvement in the politics of the Ukraine. The Minsk II Agreement, whilst only partially observed, has curtailed an escalation of the Ukrainian civil war. Capital outflows which were $77bln in Q4 2014 slowed to $32bln in Q1 2015. Ironically, the rebound in the currency and appreciation in the Micex index will probably delay the necessary structural reforms which are needed to reinvigorate the economy.
Brazil
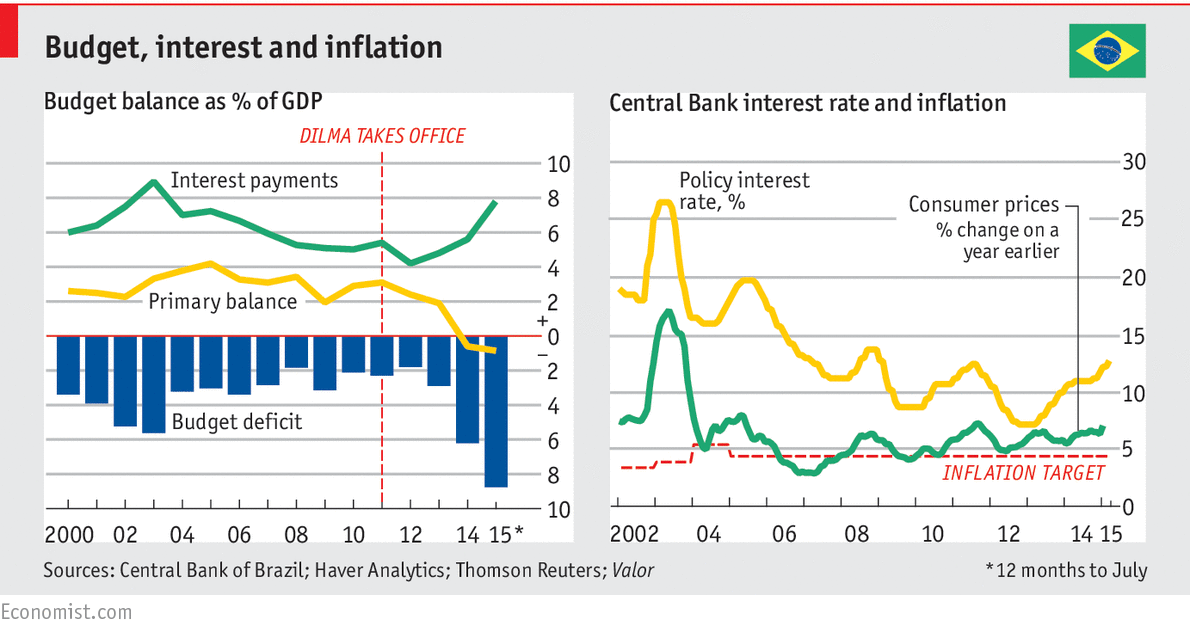
At the end of February the Economist – Brazil – In a quagmire – described the challenges facing President Rousseff’s weak government:-
Brazil’s economy is in a mess, with far bigger problems than the government will admit or investors seem to register. The torpid stagnation into which it fell in 2013 is becoming a full-blown—and probably prolonged—recession, as high inflation squeezes wages and consumers’ debt payments rise (see article). Investment, already down by 8% from a year ago, could fall much further. A vast corruption scandal at Petrobras, the state-controlled oil giant, has ensnared several of the country’s biggest construction firms and paralysed capital spending in swathes of the economy, at least until the prosecutors and auditors have done their work. The real has fallen by 30% against the dollar since May 2013: a necessary shift, but one that adds to the burden of the $40 billion in foreign debt owed by Brazilian companies that falls due this year.
…Ideally, Brazil would offset this fiscal squeeze with looser monetary policy. But because of the country’s hyperinflationary past, as well as more recent mistakes—the Central Bank bent to the president’s will, ignored its inflation target and foolishly slashed its benchmark rate in 2011-12—the room for manoeuvre today is limited. With inflation still above its target, the Central Bank cannot cut its benchmark rate from today’s level of 12.25% without risking further loss of credibility and sapping investor confidence. A fiscal squeeze and high interest rates spell pain for Brazilian firms and households and a slower return to growth.
…Yet the president’s weakness is also an opportunity—and for Mr Levy in particular. He is now indispensable. He should build bridges to Mr Cunha, while making it clear that if Congress tries to extract a budgetary price for its support, that will lead to cuts elsewhere. The recovery of fiscal responsibility must be lasting for business confidence and investment to return. But the sooner the fiscal adjustment sticks, the sooner the Central Bank can start cutting interest rates.
More is needed for Brazil to return to rapid and sustained growth. It may be too much to expect Ms Rousseff to overhaul the archaic labour laws that have helped to throttle productivity, but she should at least try to simplify taxes and cut mindless red tape. There are tentative signs that the government will scale back industrial policy and encourage more international trade in what remains an over-protected economy.
Brazil is not the only member of the BRICS quintet of large emerging economies to be in trouble. Russia’s economy, in particular, has been battered by war, sanctions and dependence on oil. For all its problems, Brazil is not in as big a mess as Russia. It has a large and diversified private sector and robust democratic institutions. But its woes go deeper than many realise. The time to put them right is now.
Earlier this week the Peterson Institute – The Rescue of Brazil summed up the current situation:-
The Brazilian economy has all the characteristics of a country under the tutelage of an International Monetary Fund (IMF) program. The list of its economic imbalances is endless: a rampant current account deficit in excess of 4 percent of GDP, an exchange rate that has long been overvalued but that has collapsed in just a few months, a public debt ratio to GDP in a rapid upward trend, a fiscal deficit of over 6 percent of GDP despite a high tax burden, an annual inflation rate of nearly 8 percent that has unanchored inflation expectations, an accelerated growth of wages well above their very low productivity. The scandal of the oil company Petrobras, the latest in a long series of political corruption scandals, is the straw that could break the back of investors’ patience, the tolerance of Brazilian citizens, and the stamina of the world’s seventh largest economy. The Petrobras scandal has far-reaching ramifications throughout the economy and society, paralyzing activity and collapsing both business and consumer confidence to unprecedented levels. The mass street demonstrations of recent weeks are the most graphic example of this dissatisfaction.
In another Op-ed Peterson – Brazil’s Investment: A Maze in One’s Own Navel – the authors point to the relatively closed nature of the Brazilian economy for the lack of international investment:-
Consider the most common explanations for why Brazil’s investment rate shows persistent apathy: Excessive taxes levied on businesses discourage fixed capital formation; poor infrastructure—including ongoing problems in the energy sector—increases production costs; high wages relative to worker productivity weigh on firms, hampering investment; an opaque business environment characterized by obsolete and excessive licensing requirements reduce firms’ incentives to invest; an institutional environment marked by subsidized lending that favors certain firms over others misallocates scarce domestic savings; “state capitalism” and excessive government intervention crowd out the private sector. Evidently, all of these reasons have a role in explaining investment inertia. But, importantly, they are all homegrown.
… Perhaps Brazil’s sclerotic investment has something to do with its long-standing lack of openness. It is no mystery that Brazil is one of the most closed economies in the world according to any metric that one chooses to gauge the degree of openness. It is no coincidence that this is also the most striking difference between Brazil and its emerging-market peers: Brazil is more closed than Mexico, Colombia, Peru, and Chile; all members of the Pacific Alliance, their growth rates are higher than Brazil’s. Brazil is also less open than India, China, Turkey, and South Africa.
There is an extensive academic and empirical literature on the relationship between investment and openness (see, for example, the Peterson Institute’s video on trade and investment). Several research papers show that the more open an economy is to international trade, the more foreign direct investment it receives. The more foreign direct investment it receives, the greater the availability of resources for domestic investment. Competition is also crucial: Economies that are more open induce greater competition between local and foreign firms, creating incentives for innovation and investment by domestic companies.
Unfortunately, Brazil is still fairly close-minded when it comes to these issues. Fears of losing market share and the old litany of “selling the country to foreigners” still dominate the national debate.
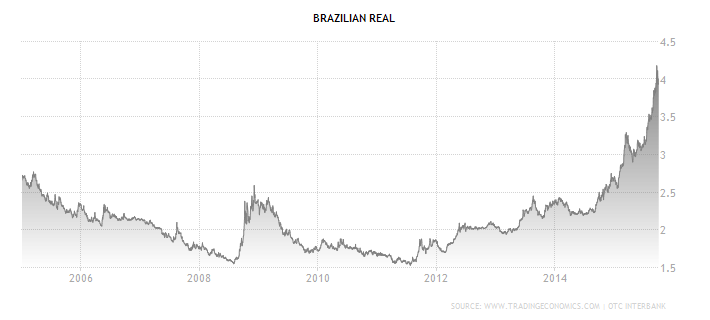
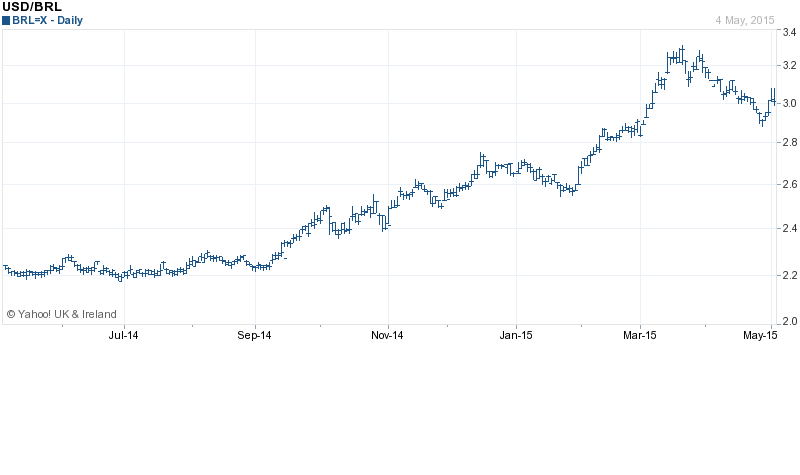
The weakening of the BRL has continued for rather longer than the decline in the RUB, perhaps as a result of the Petrobras “Car Wash” scandal, but a modicum of stability has been regained since early April, as the chart below shows:-
Source: Yahoo Finance
Commodity correlation
Both Brazil and Russia are large commodity exporters. The table below is for 2011 but a clear picture emerges:-
| Commodity |
Russia |
Brazil |
| Oil & Products |
$190bln |
$22bln |
| Iron Ore & Products |
$19bln |
$54bln |
Source: CIA Factbook
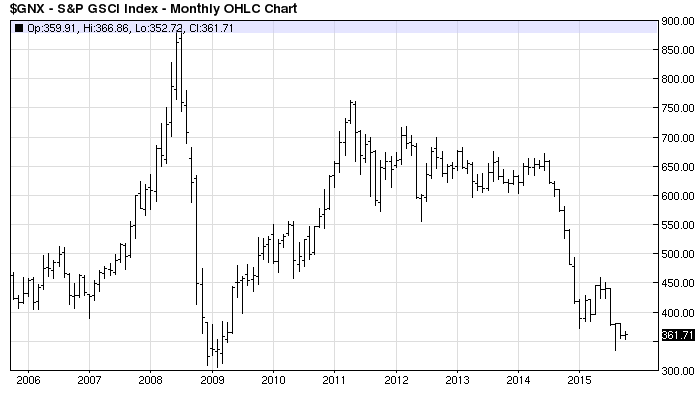
Platts reported that Iron Ore prices (62% Fe Iron Ore Index) had risen since the end of April to $57.75/dmt CFR North China, up $2.25 on 4th May. It is probably too soon to confirm that Iron Ore prices have bottomed but with oil prices now significantly higher ($60/bbl) since their lows ($45/bbl) seen in March. Copper has also begun to rise – perhaps in response to the performance of the Chinese stock market – rising from lows of less than $2.50/lb in January to $2.94/lb this week.
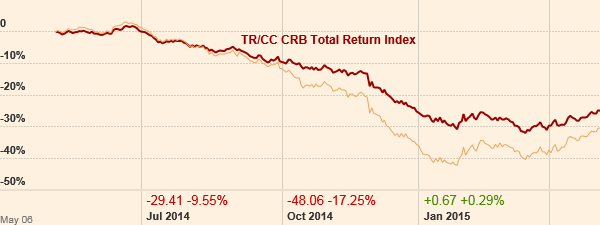
The chart below shows the relative performance of the CRB Index and the GSCI Index which has a heavier weighting to energy:-
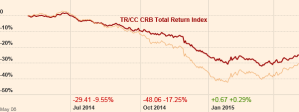
Source: FT
The general recovery in commodity prices is still nascent but it is supportive for both Brazil and Russia in the near term. Both countries have benefitted from devaluation relative to their export partners as this table illustrates:-
| Russia |
Exports |
Brazil |
Exports |
| Netherlands |
10.70% |
China |
17% |
| Germany |
8.20% |
United States |
11.10% |
| China |
6.80% |
Argentina |
7.40% |
| Italy |
5.50% |
Netherlands |
6.20% |
| Ukraine |
5% |
|
|
| Turkey |
4.90% |
|
|
| Belarus |
4.10% |
|
|
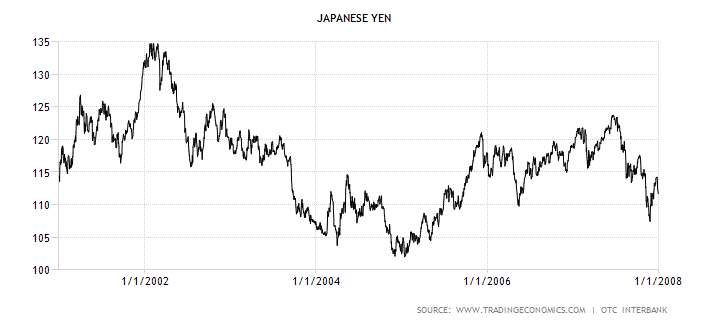
| Japan |
4.00% |
|
|
Source: CIA Factbook
Asset prices and investment opportunities
Real Estate
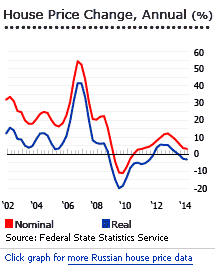
Russian real estate prices have been subdued during the last few years, but the underlying market has been active. The lack of price appreciation is due to a massive increase in house building. 912,000 new homes were built in 2013 – the highest number since 1989. Prices are lower in 10 out 46 regions, however, this new supply should be viewed in the context of the housing bubble which drove prices higher by 436% between 2000 and 2007:-

Source: Global Property Guide
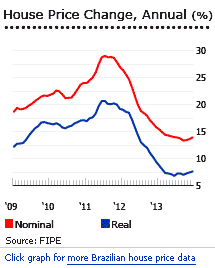
Brazilian property, by contrast, has risen in price. In inflation adjusted terms, prices increased 7.6% in 2013, although these increases are less than those seen during 2011/2012. Rio continues to outperform (+15.2% vs +13.9% nationally) and the forthcoming Olympics should support prices into 2016:-

Source: Global Property Guide
Neither of these markets present obvious opportunities. Brazilian prices are likely to moderate in response to higher interest rates whilst increased Russian supply will hang over the market for the foreseeable future. The rental yields in the table are somewhat out of date but clearly offer a less attractive income than government bonds:-
| BRAZIL |
November 16th 2013 |
| SAO PAULO – Apartments |
|
| Property Size |
Yield |
| 80 sq. m. |
5.68% |
| 120 sq. m. |
4.71% |
| 200 sq. m. |
6.15% |
| 350 sq. m. |
6.23% |
| RIO DE JANEIRO -Apartments |
|
| 60 sq. m. |
4.40% |
| 90 sq. m. |
3.82% |
| 120 sq. m. |
3.91% |
| 200 sq. m. |
4.89% |
|
|
| RUSSIA |
June 24th 2014 |
| MOSCOW – Apartments |
|
| Property Size |
Yield |
| 75 sq. m. |
3.84% |
| 120 sq. m. |
3.22% |
| 160 sq. m. |
3.07% |
| 275 sq. m. |
3.42% |
| ST. PETERSBURG – Apartments |
|
| 60 sq. m. |
6.20% |
| 120 sq. m. |
4.36% |
| 175 sq. m. |
3.46% |
Source: Global Property Guide
Stocks
The chart below compares the performance of Micex and the Bovespa indices over the past year. The devaluation of the RUB has been greater than that of the BRL – this accounts for the majority of the divergence:-
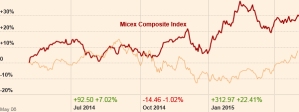
Source: FT
Looking more closely at the components of the two indices there is a marked energy and commodity bias, the table below looks at the largest stocks, representing roughly 80% of each index:-
| Ticker |
Stock |
Weight |
Sector |
Free-float |
| GAZP |
GAZPROM |
15 |
Energy |
46% |
| SBER |
Sberbank |
14.01 |
Financial Services |
48% |
| LKOH |
ОАО “LUKOIL” |
13.97 |
Energy |
57% |
| ROSN |
Rosneft |
5.84 |
Energy |
15% |
| URKA |
Uralkali |
5.19 |
Commodity |
45% |
| GMKN |
“OJSC “MMC “NORILSK NICKEL” |
4.79 |
Commodity |
24% |
| NVTK |
JSC “NOVATEK” |
3.93 |
Energy |
18% |
| SNGS |
Surgutneftegas |
3.49 |
Energy |
25% |
| RTKM |
Rostelecom |
3.03 |
Telecomm |
43% |
| TATN |
TATNEFT |
3.01 |
Energy |
32% |
| VTBR |
JSC VTB Bank |
2.97 |
Financial Services |
25% |
| MGNT |
OJSC “Magnit” |
2.22 |
Commodity |
24% |
| TRNFP |
Transneft, Pref |
2.21 |
Energy |
100% |
|
TOTAL WEIGHTING |
79.66 |
|
|
|
|
|
|
|
| Ticker |
Stock |
Weight |
Sector |
|
| ITUB4 |
ITAUUNIBANCO |
10.764 |
Financial Services |
|
| BBDC4 |
BRADESCO |
8.2 |
Financial Services |
|
| ABEV3 |
AMBEV S/A |
7.368 |
Brewing |
|
| PETR4 |
PETROBRAS |
6.045 |
Energy |
|
| PETR3 |
PETROBRAS |
4.416 |
Energy |
|
| VALE5 |
VALE |
3.971 |
Commodity |
|
| BRFS3 |
BRF SA |
3.741 |
Commodity |
|
| VALE3 |
VALE |
3.558 |
Commodity |
|
| ITSA4 |
ITAUSA |
3.433 |
Financial Services |
|
| CIEL3 |
CIELO |
3.37 |
Financial Services |
|
| JBSS3 |
JBS |
2.705 |
Commodity |
|
| UGPA3 |
ULTRAPAR |
2.487 |
Energy |
|
| BBSE3 |
BBSEGURIDADE |
2.47 |
Financial Services |
|
| BVMF3 |
BMFBOVESPA |
2.393 |
Financial Services |
|
| BBAS3 |
BRASIL |
2.344 |
Financial Services |
|
| EMBR3 |
EMBRAER |
1.823 |
Aerospace |
|
| VIVT4 |
TELEF BRASIL |
1.733 |
Telecomm |
|
| PCAR4 |
P.ACUCAR-CBD |
1.663 |
Retail |
|
| KROT3 |
KROTON |
1.49 |
Support Services |
|
| CCRO3 |
CCR SA |
1.48 |
Transport |
|
| BBDC3 |
BRADESCO |
1.445 |
Financial Services |
|
| LREN3 |
LOJAS RENNER |
1.364 |
Retail |
|
| CMIG4 |
CEMIG |
1.207 |
Energy |
|
| CRUZ3 |
SOUZA CRUZ |
1.027 |
Tobacco |
|
|
TOTAL WEIGHTING |
80.497 |
|
|
Source: Moscow Exchange and BMF Bovespa
The Russian index is clearly more exposed to energy, 48% and commodities, 12%, than the Brazilian index, where the weightings are 14 % each for energy and commodities. It is important to note that the Bovespa index adjusts for the “free-float” for each stock whilst Micex does not, however under Micex rules no stock may account for more than 15% of the index. The free-float adjusted weight of energy and commodities is therefore 18% and 4% respectively.
On the basis of this analysis, currency fluctuation has been the predominant influence on stock market returns, followed by energy and commodity prices. The PE ratios of Micex and Bovespa at roughly 8 times, are undemanding but neither the economic nor the political situation in either country is conducive to long term growth. I expect both markets to continue to recover, although Micex will probably fair best. Longer term, economic reform is required to raise the structural rate of growth.
Although not mentioned in any of the articles quoted above, Russian demographics are unfavourable as this article from Yale University – Russian Demographics: The Perfect Storm – makes clear:-
One measure of an economically secure homeland is women’s willingness to raise children with the expectation of opportunities for good health, education and livelihoods. On that front, Russia confronts a perfect storm – as fertility rates plummeted to 1.2 births per women in the late 1990s and now stand at 1.7 births per women. “Russia’s population will most likely decline in the coming decades, perhaps reaching an eventual size in 2100 that’s similar to its 1950 level of around 100 million,” write demographers Joseph Chamie and Barry Mirkin. The country has high mortality rates due to elevated rates of smoking, alcohol consumption and obesity. Investment on healthcare is low. Over the next decade, Russia’s labor force is expected to shrink by about 15 percent. Other countries with low fertility rates turn to immigration to pick up the slack. While immigrants make up about 8 percent of Russia’s population, the nation has a reputation for nationalism and xenophobia, and fertility rates are even lower in neighboring Belarus, Ukraine and Lithuania, all possible sources of immigration.
Brazil has better demographic prospects in the near term, but its population growth is now not much above the world average and by 2050 it too will be entering a demographic “Götterdämmerung” of declining population. A freer, more open economy is the most efficient method of deflecting the effects of the long term demographic deficits – stock markets reflect this in their risk premiums.
Bonds
Brazilian government bonds offer a real return after adjusting for inflation (10 yr real-yield 4.77%) however, as this March 2015 article from Forbes – With Currency In Gutter And Bad News Galore, Brazil Bonds A Buy makes clear, there are significant risks:-
…the major headwinds against Brazil are domestic. The fact that China is slowing down is no longer a fright factor. What keeps investors up at night is the possibility of Brazil losing its investment grade. But last month, Standard & Poor’s credit analysts were in Brasilia and left saying that a downgrade to junk was unlikely.
There is the risk of impeachment and the resignation of Finance Minister Joaquim Levy, but that is already priced into the market with local interest rate futures trading over 14.35% compared to the actual benchmark rate of 12.75%. Moreover, the impeachment of Dilma Rousseff and the resignation of Levy are worse case scenarios with low probabilities. Worries over energy rationing have subsided.
I believe Brazilian bonds offer good value, even at these levels, the central banks has taken a draconian approach to inflation and the BRL has recovered some of the ground it lost during the last year. Exports to the US should improve and signs of a recovery in European growth will benefit the BRL further.
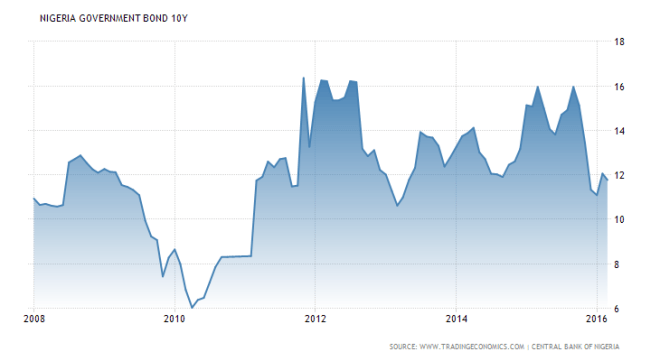
Russian government bonds look less compelling – with headline inflation at 16.9% and 10 yr yields of only 10.71% one might be inclined to avoid them on the grounds on negative real yield – but a case can be made for lower inflation and a resurgence in the value of the RUB as this article from RT – Russia’s ‘junk’ bonds paying off handsomely suggests:-
“It’s very simple advice. Bonds are much more attractive than a year ago. Risks related to the ruble have subsided, inflation is likely to moderate, the BoP (Balance of Payments) and budget situation look reasonably strong and that is why the outlook is quite favorable,” Vladimir Kolychev, Chief Economist for Russia at VTB Capital…
…“Unless geopolitics interferes, we forecast Russian rates are likely to repeat Hungary’s three-year bull market run in the years ahead,” Bank of America’s head of emerging EMEA economics David Hauner…
…In a March 11 note, Russia’s Goldman Sachs analysts wrote “Russian bonds are both cyclically and structurally under-priced,” in a big part due devaluation expectations of the ruble stabilizing.
I remain less convinced about the value of Russian bonds but with a low debt to GDP ratio they may perform well.
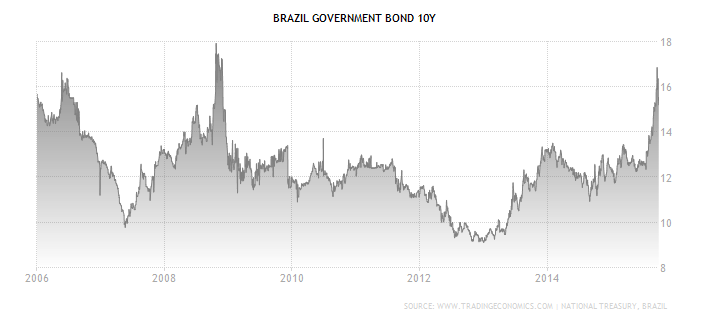
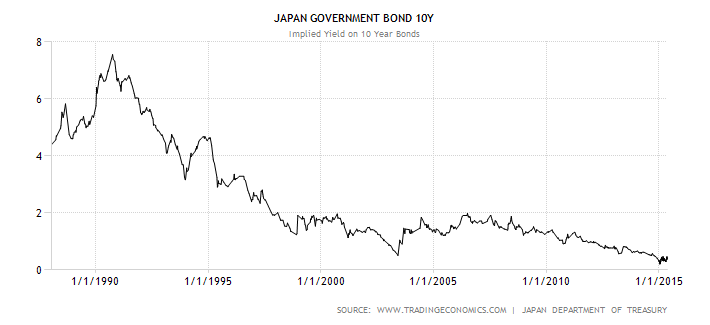
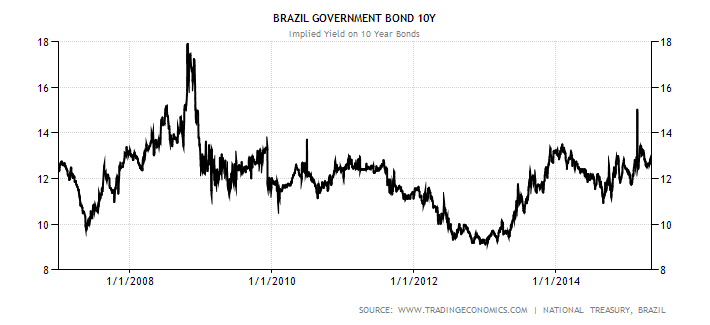
Here are the recent price charts for 10 year maturities:-
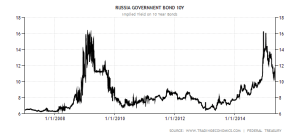
Source: Trading Economics

Source: Trading Economics
As inflation declines in both countries their bond markets will continue to rise in expectation of further central bank rate cuts. This will also support stocks but bonds will lead the rally, especially if future growth in Brazil or Russia should disappoint.