Emerging Market Sensitivity to US Monetary Policy – What does the Fed think?

Emerging Market Sensitivity to US Monetary Policy – What does the Fed think?

In the Long Run - small colour logo

Macro Letter – No 107 – 04-01-2019

Emerging Market Sensitivity to US Monetary Policy – What does the Fed think?

  • Emerging market currencies have suffered from US interest rate increases
  • The Dallas Fed proposes reserve/GDP ratio as a simple indicator of stress
  • If tightening is nearly complete their may be buying opportunities in EM stocks

In Macro Letter – No 96 – 04-05-2018 – Is the US exporting a recession? I speculated on whether US tightening of monetary policy and the reversal of QE was causing more difficulty for emerging markets – and even perhaps Europe – than it was for the domestic US economy. I was therefore delighted to receive an update on 9th December from the Federal Reserve Bank of Dallas, entitled, Reserve Adequacy Explains Emerging-Market Sensitivity to U.S. Monetary Policy. The authors, J. Scott Davis, Dan Crowley and Michael Morris, remind readers that Past-Chairman Greenspan made the following observations after the Asian crisis of 1997/98: –

In a 1999 speech to the World Bank, Greenspan summarized the rule stating “that countries should manage their external assets and liabilities in such a way that they are always able to live without new foreign borrowing for up to one year.

Personally I find the choice of one year to be a conveniently arbitrary time period, but the remark was probably more concerned with prudence, after the event, than an attempt to model the sudden-stop over time. It also ties in with the generally agreed definition of a country’s short-term debt, that which has to be repaid or rolled over within a year.

The authors go on to discuss reserve balances: –

Reserves are a safety net to guard against currency instability when major advanced economy central banks tighten policy.

The burning question is, what level of reserves is necessary to insure the stability of one’s currency? The authors suggest that this should be the following equation: –

FX reserves – Short-term foreign-currency denominated external debt + current account deficit

Their solution is to observe daily changes in the interest rate spread between the Corporate Emerging Market Bond Index (CEMBI) and 12 month Fed Fund Futures. To relate this to the level of central bank reserves an ‘interaction term’ is constructed which describes to relationship between reserve levels and credit spreads. An iterative process arrives at a level of reserves relative to a countries GDP. One may argue about the flaws in this simple model, however, it arrives at the conclusion that a 7.1% central bank currency reserve adequacy to GDP ratio is the inflection point: –

To that end, a range of possible threshold values is tested—from reserve adequacy of -10 percent of GDP to 20 percent of GDP. The threshold value most supported is 7.1 percent of GDP. When reserve adequacy is less than that, the sensitivity of the CEMBI spread to changes in fed funds futures is proportional to a country’s reserve adequacy, with the CEMBI spread becoming more sensitive as reserve adequacy declines. Reserve adequacy above 7.1 percent doesn’t much affect CEMBI sensitivity to expectations of U.S. monetary policy— sensitivity is similar whether reserve adequacy is 9 percent or 29 percent.

The chart below shows the level of reserves for selected EM countries since 2010, the colour coding shows in red those countries with reserves less than 7.1% of GDP and in blue those above the threshold: –

heat map of reserve to gdp ratio

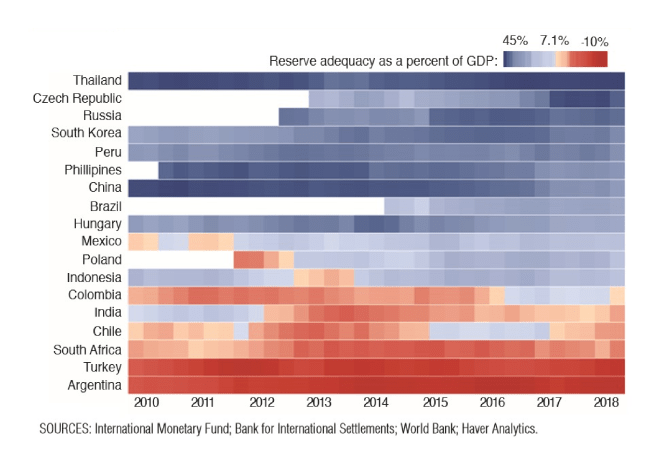
Sources: International Monetary Fund; Bank for International Settlements; World Bank; Haver Analytics

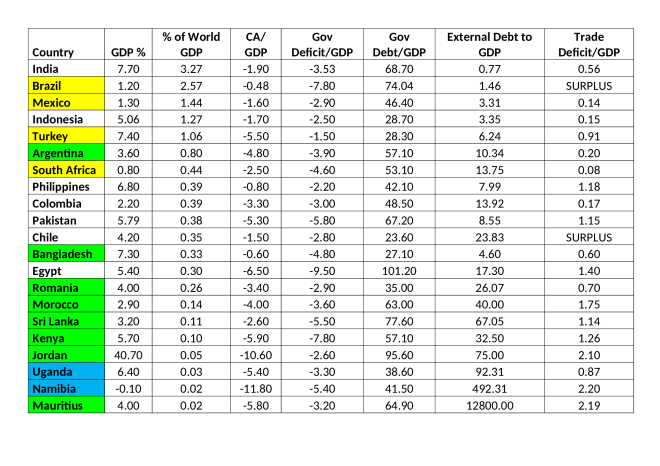
China has maintained extremely high reserves despite maintaining fairly tight currency controls. The table above shows PBoC reserves gently declining but they remain well above the 7.1% inflection point.

Observations and recommendations

The Fed model is elegantly simple, it would be interesting to investigate its applicability to smaller developed economies; I imagine a similar pattern may be observed, although the reserve requirement inflection point might be lower, a reflection of the depth of their domestic capital markets. I also wonder about the effect of the absolute level of interest rates and the interest rate differential between one country and its reserve currency comparator – not all emerging markets peg themselves to the US$.

This study could also be applied to frontier economies although it may not necessarily be so effective in measuring risk when the statistical basis of GDP and other statistical measurements is suspect – consider the recent upward revisions of the economic size of countries such as Nigeria and Ghana. This paper from World Economics – Measuring GDP in Africa – March 2016 – has more detail.

As part of an initial screening of EM markets for potential risk, the central bank reserve to GDP ratio is easy to calculate. It will not reveal the exact timing of a currency depreciation but it is an excellent sanity check when one is tempted, for other reasons, to invest.

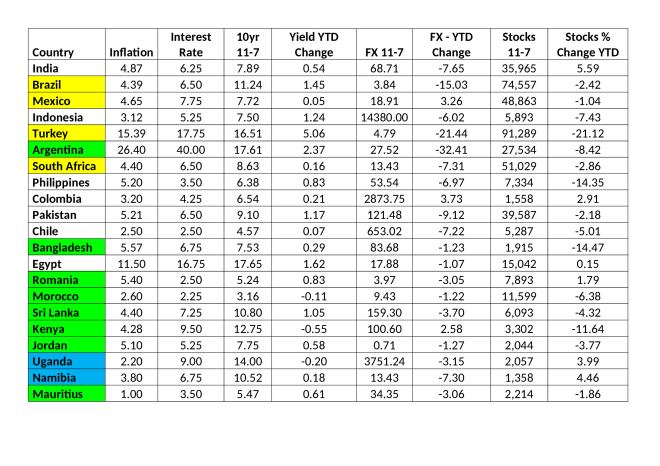
Last year Turkey and Argentina both saw a sudden depreciation, but, with the Federal Reserve now indicating that its tightening phase may have run its course, now is the time to look for value even among the casualties of the Fed. India is, of course, my long-term EM of choice, but as a shorter-term, speculative, recovery trade Turkish or Argentine bonds are worthy of consideration. With inverted curves, shorter duration bonds are their own reward. Argentine 4yr bonds spiked to yield 36% in November and currently offer a 33% yield. Turkish 1yr bonds are even more beguiling, they spiked to a yield of 32% in October but still offer a 22% return. Momentum still favours a short exposure so there is time to take advantage of these elevated returns.

Canary in the coal-mine – Emerging market contagion

In the Long Run - small colour logo

Macro Letter – No 100 – 13-07-2018

Canary in the coal-mine – Emerging market contagion

  • Emerging market currencies, bonds and stocks have weakened
  • Fears about the impact of US tariffs have been felt here most clearly
  • The risk to Europe and Japan is significant
  • Turkey may be the key market to watch

As US interest rates continue to normalise and US tariffs begin to bite, a number of emerging markets (EM’s) have come under pressure. Of course, the largest market to exhibit signs of stress is China, the MSCI China Index is down 7% since mid-June, whilst the RMB has also weakened against the US$ by more than 6% since its April low. Will contagion spread to developed markets and, if so, which country might be the ‘carrier’?

To begin to answer these questions we need to investigate this year’s casualties. Argentina is an obvious candidate. Other troubled countries include Brazil, Egypt and Turkey. In each case, government debt has exacerbated instability, as each country’s currency came under pressure. Other measures of instability include budget and trade deficits.

In an effort to narrow the breadth of this Macro Letter, I will confine my analysis to those countries with twin government and current account deficits. In the table which follow, the countries are sorted by percentage of world GDP. The colour coding reflects the latest MSCI categorisation; yellow, denotes a fully-fledged EM, white, equals a standard EM, green, is on the secondary list and blue is reserved for those countries which are so ‘frontier’ in nature as not to be currently assessed by MSCI: –

EM Debt and GDP

Source: Trading Economics, Investing.com, IMF, World Bank

For the purposes of this analysis, the larger the EM as a percentage of world GDP and the higher its investment rating, the more likely it is to act as a catalyst for contagion. Whilst this is a simplistic approach, it represents a useful the starting point.

Back in 2005, in a futile attempt to control the profligacy of European governments, the European Commission introduced the Stability and Growth Pact. It established at maximum debt to GDP ratio of 60% and budget deficit ceiling of 3%, to be applied to all members of the Eurozone. If applied to the EM’s listed above, the budget deficit constraint could probably be relaxed: these are, generally, faster growing economies. The ratio of debt to GDP should, however, be capped at a lower percentage. The government debt overhang weighs more heavily on smaller economies, especially ones where the percentage of international investors tends to be higher. Capital flight is a greater risk for EM’s than for developed economies, which are insulated by a larger pool of domestic investors.

Looking at the table again, from a financial stability perspective, the percentage of non-domestic debt to GDP, is critical. A sudden growth stop, followed by capital flight, usually precipitates a collapse in the currency. External debt can prove toxic, even if it represents only a small percentage of GDP, since the default risk associated with a collapsing currency leads to a rapid rise in yields, prompting further capital flight – this is a viscous circle, not easily broken. The Latin American debt crisis of the 1980’s was one of the more poignant examples of this pattern. Unsurprisingly, in the table above, the percentage of external debt to GDP grows as the economies become smaller, although there is a slight bias for South American countries to continue to borrow abroad. Perhaps a function of their proximity to the US capital markets. Interestingly, by comparison with developed nations, the debt to GDP ratios in most of these EM countries is relatively modest: a sad indictment of the effectiveness of QE as a policy to strengthen the world financial system – but I digress.

Our next concern ought to be the trade balance. Given the impact that US tariffs are likely to have on export nations, both emerging and developed, it is overly simplistic to look, merely, at EM country exports to the US. EM exports to Europe, Japan and China are also likely to be vulnerable, as US tariffs are enforced. Chile and Mexico currently run trade surpluses, but, since their largest trading partner is the US, they still remain exposed.

This brings us to the second table which looks at inflation, interest rates, 10yr bond yields, currencies and stock market performance: –

EM Markets and Inflation

Source: Trading Economics, Investing.com, IMF, World Bank

In addition to its absolute level, the trend of inflation is also an important factor to consider. India has seen a moderate increase since 2017, but price increases appear steady not scary. Brazil has seen a recent rebound after the significant moderation which followed the 2016 spike. Mexican inflation has moderated since late 2017, posing little cause for concern. Indonesian price rises are at the lower end of their post Asian crisis range. Turkey, however, is an entirely different matter. It inflation is at its highest since 2004 and has broken to multiyear highs in the last two months. Inflation trends exert a strong influence on interest rate expectations and Turkish 10yr yields have risen by more than 5% this year, whilst it currency has fallen further than any in this group, barring the Argentinian Peso. For comparison, the Brazilian Real is the third weakest, followed, at some distance, by the Indian Rupee.

India, Brazil, Mexico and Indonesia may be among the largest economies in this ‘contagion risk’ group, but Turkey, given its geographic proximity to the EU may be the linchpin.

Is Turkey the canary?

The recent Turkish elections gave President Erdogan an increased majority. His strengthened mandate does not entirely remove geopolitical risk, but it simplifies our analysis of the country from an economic perspective. Short-term interest rates are 17.75%, the second highest in the group, behind Argentina. The yield curve is inverted: and both the currency and stock market have fared poorly YTD. Over the last 20 years, Turkish GDP has averaged slightly less than 5%, but this figure is skewed by three sharp recessions (‘98, ‘01 and ‘08). The recent trend has been volatile but solid. 10yr bond yields, by contrast, have been influenced by a more than doubling of short-term interest rates, in defence of the Turkish Lira. This aggressive action, by their central bank, makes the economy vulnerable to an implosion of growth, as credit conditions deteriorate rapidly.

Conclusion and investment opportunities

In Macro Letter – No 96 – 04-05-2018 – Is the US exporting a recession? I concluded in respect of Europe that: –

…the [stock] market has failed to rise substantially on a positive slew of earnings news. This may be because there is a more important factor driving sentiment: the direction of US rates. It certainly appears to have engendered a revival of the US$. It rallied last month having been in a downtrend since January 2017 despite a steadily tightening Federal Reserve. For EURUSD the move from 1.10 to 1.25 appears to have taken its toll. On the basis of the CESI chart, above, if Wall Street sneezes, the Eurozone might catch pneumonia.

Over the past few months EM currencies have declined, their bond yields have increased and their stock markets have generally fallen. In respect of tariffs, President Trump has done what he promised. Markets, like Mexico and Chile, reacted early and seem to have stabilised. Argentina had its own internal issues with which to contend. The Indian economy continues its rapid expansion, despite higher oil prices and US tariffs. It is Turkey that appears to be the weakest link, but this may be as much a function of the actions of its central bank.

If, over the next few months, the Turkish Lira stabilises and official rates moderate, the wider economy may avoid recession. Whilst much commentary concerning EM risks will focus on the fortunes of China, it is still a relatively closed, command economy: and, therefore, difficult to predict. It will be at least as useful to focus on the fortunes of Turkey. It may give advanced warning, like the canary in the coal-mine, which makes it my leading indicator of choice.


Linear Talk – Macro Roundup for September 2017

Linear Talk – Macro Roundup for September 2017

TRANSCRIPT

Linear Talk – Macro Roundup – 17th October 2017

Financial market liquidity returned after the thin trading which is typical of August. Stocks and crude oil were higher and the US$ made new lows. But a number of individual markets are noteworthy.

Stocks

The S&P 500 and the Nasdaq 100 both achieved record highs last month (2519 and 6013 respectively). In the case of the S&P this is the sixth straight month of higher closes, even as flow of funds data indicates a rotation into international equity markets.

The Eurostoxx 50 took comfort from the US move, closing the month at its high (3595) yet it remains below the level seen in May (3667) tempered, no doubt, by the strength of the Euro.

German Elections, showing a rise in support for the nationalist AfD and the prospect of an unconstitutional independence referendum in Catalonia, made little impression on European equity markets. The DAX also closed at its high (12,829) but, it too, failed to breach its record for the year of 12,952 witnessed in June.

Spain’s IBEX 35 was more susceptible to the political fracas in its north eastern region, but with other markets rising, it traded in a narrow range, closing at 10,382 on the eve of the referendum, having actually begun the month lower, at 10,329.

The Japanese Nikkei 225 remained well supported but still failed to breach resistance, making a high of 20,481 on the 18th. It has since taken out the old high. This move is supported by stronger economic data and revised growth forecasts from the IMF (released after month end).

Currencies

Currency markets have been dominated by the weakness of the US$ since January. Last month was no exception. The US$ Index made a new low for the year at 90.99 on the 8th but swiftly recovered, testing 93.80 on the 28th. Technically, this low breached the 50% correction of the move from the May 2014 low of 78.93 to the January 2017 high of 103.81. Further support should be found at 88.43 (61.8% retracement) but price action in EURUSD suggests that we may be about to see a reversal of trend.

EURUSD made a new high for the year at 1.2094 on the 8th, amid rumours of ECB intervention. By month end it had weakened, testing 1.1721 on 28th. This has created a technical ‘outside month’ – a higher high and lower low than the previous month. For this pattern to be negated EURUSD must trade back above 1.2094.

EURGBP also witnessed a sharp correction the initial Sterling weakness which was a feature of the summer months. From an opening high of 0.9235 Sterling steadily strengthened to close at 0.8819. Nonetheless, Sterling remains weaker against the Euro than in 2013, amid fears of a ‘No Deal’ on Brexit and continued expectations of an economic slowdown due to the political uncertainty of that exit.

Bonds

US 10yr Treasuries made a new low yield for the year at 2.02% on 8th. This is the lowest yield since the November 2016 election, however, expectations of another rate hike and the announcement of a planned balance sheet reduction schedule from the Federal Reserve, tempered the enthusiasm of the bond bulls. By month end, yields had risen 32bp to close at 2.34%.

In Germany 10yr Bund yields followed a similar trajectory to the US. Making a low of 0.29% on 8th only to increase to 0.52% by 28th. Increasing support for the AfD in the election, was largely ignored.

A trade which has been evident during 2017 has been the convergence of core and peripheral European bond yields. The larger markets such as Italy and Spain have mostly mirrored the price action of Bunds, their spreads widening moderately in the process. The yield on Portuguese and Greek bonds, by contrast has declined substantially, although there was a slight widening during September. Greek 10yr bonds, which yielded 8.05% at the end of January, closed the month at 5.67%. Over the same period 10yr Bunds have seen yields rise by 6bp.

UK 10yr Gilts also had an interesting month. From a low of 0.97% on 7th they reached 1.42% on 28th amid concerns about Brexit, the recent weakness in Sterling (which appears to have been temporarily reversed) and expectations that Bank of England Governor, Carney, will raise UK interest rates for the first time since June 2007. It is tempting to conceive that either the rise in Gilt yields or the recent rise in Sterling is wrong, these trends might both continue. Long Sterling and Short Gilts might be a trade worthy of consideration.

Commodities

Perhaps anticipating the IMF – World Economic Outlook – October update, in which they revised their world growth forecasts for 2017 and 2018 upwards, the price of Brent Crude rallied to a new high for the year on 26th – $59.49/bbl. Aside from expectations of an increase in demand, the effect of two hurricanes in the US and a strengthening of resolve on the part of OPEC to limit production, may be contribution factors.

Copper also hit a new high for the year, trading $3.16/lb on 4th. Technically, however, it made an outside month (higher high and lower low than August) a break above $3.16/lb will negate this bearish formation. I remain concerned that Chinese growth during 2017 has been front-loaded. Industrial metal markets may well consolidate, with a vengeance, before deciding whether increased demand is seasonal or structural.