The Pension Fund Apocalypse
This is the first of two articles about negative real interest rates.
https://www.aier.org/article/pension-fund-apocalypse


This is the first of two articles about negative real interest rates.
https://www.aier.org/article/pension-fund-apocalypse

Macro Letter – No 84 – 29-09-2017
Japan – Politics, Central Banking and the Nikkei 225
On Monday Japanese Prime Minister, Shinzo Abe, called a snap general election. During the press conference in which he made the announcement he said:-
It is my mission as prime minister to exert strong leadership abilities at a time when Japan faces national crises stemming from the shrinking demographic and North Korea’s escalating tensions…
He went on to outline a JPY 2trln stimulus package, to be implemented before year end. This will be financed by raising the consumption tax rate from 8% to 10% in October 2019. The tax increase is expected to generate JPY 5trln/annum and, if any revenue remains after the stimulus, it will be used to reduce government debt. With a further JPY 2trln earmarked for education and social programmes it seems unlikely the maths will add up.
Meanwhile, despite the Federal Reserve’s announcement, last week, that they will begin balance sheet reduction, the Bank of Japan (BoJ) continue their policy of quantitative and qualitative easing (QQE) involving the unorthodox ‘yield curve control’ measures. From more on this please see Macro Letter – No 65 – Yield Curve Control – the road to infinite QE which I published in November 2016. I stand by my conclusion, although my prediction about the JPY (I thought it would continue to weaken) has yet to come to pass:-
If zero 10 year JGB yields are unlikely to encourage banks to lend and demand from corporate borrowers remains negligible, what is the purpose of the BoJ policy shift? I believe they are creating the conditions for the Japanese government to dramatically increase spending, safe in the knowledge that the JGB yield curve will only steepen beyond 10 year maturity.
I do not believe yield curve control will improve the economics of bank lending at all. According to World Bank data the average maturity of Japanese corporate syndicated loans in 2015 was 4.5 years whilst for corporate bonds it was 6.9 years. Corporate bond issuance accounted for only 5% of total bond issuance in Japan last year – in the US it was 24%. Even with unprecedented low interest rates, demand to borrow for 15 years and longer will remain de minimis.
Financial markets will begin to realise that, whilst the BoJ has not quite embraced the nom de guerre of “The bank that launched Helicopter Money”, they have, assuming they don’t lose their nerve, embarked on “The road to infinite QE”. Under these conditions the JPY will decline and the Japanese stock market will rise.
In the long run demographic forces may halt Abenomic attempts to debase the Yen. This 2015 paper from the Federal Reserve Bank of St Louis – Aging and the Economy: The Japanese Experience – makes fascinating reading. Here is a snippet, but I urge you to read the whole article for an overview of the impact of an ageing population on economies in general, Japan exhibits some unique characteristics in this respect:-
In a third study, economists Derek Anderson, Dennis Botman and Ben Hunt found that the increased number of pensioners in Japan led to a sell-off of financial assets by retirees, who needed the money to cover expenses. The assets were mostly invested in foreign bonds and stocks. The sell-off, in turn, fueled appreciation of the yen, lowering costs of imports and leading to deflation.
Returning to the current environment, on Monday, in a speech to business leaders in Osaka entitled – Japan’s Economy and Monetary Policy – BoJ Governor Haruhiko Kuroda made several observations about the economy, labour market and inflation:-
The economy is expanding moderately, and the real GDP growth rate for the April-June quarter registered a firm increase of 2.5 percent on an annualized basis. It is the first time in eleven years, since 2006, that it has continued to mark positive growth for six consecutive quarters…
The year-on-year rate of increase in hourly wages of part-time employees, which are particularly sensitive to the tightening of the labor market, has registered about 2.5 percent. This is higher than that of full-time employees, implying that the difference in wage levels between part-time and full-time employees has become smaller…
In the labor market as a whole, the unemployment rate has declined to around 3 percent, which is equivalent to virtually full employment, and the active job openings-to-applicants ratio stands at 1.52, exceeding the highest figure during the bubble period and reaching a level last seen as far back as in 1974…
The year-on-year rate of change in the consumer price index (CPI) excluding fresh food has increased to around 0.5 percent recently, but that which also excludes the effects of a rise in energy prices has been relatively weak, remaining at around 0 percent…
Kuroda-san went on to defend the BoJ 2% inflation target and explain the logic behind their ‘QQE with Yield Curve Control’ mechanism. I am struck by the improving affluence of the average worker in Japan. Inflation is zero whilst wage growth, except for the dip in July to -0.3%, has been positive for most of this decade. Real Japanese wages have been rising which is in stark contrast to many of its G7 peers. See Pew Research – For most workers, real wages have barely budged for decades for more on this subject.
The minutes of the July 19th/20th BoJ – Monetary Policy Meeting – were released on Tuesday. They left policy unchanged. The short-term interest rate target at -0.10% and the long-term rate (10yr JGB yield) at around zero. Commenting on the economy they noted continued solid investment, especially by larger firms and the sustained improvement in private consumption. The consumption activity index (CAI) for Q1 2017 showed a fourth consecutive quarterly increase. I was interested in the statement highlighted below (the emphasis is mine):-
…members shared the view that, with corporate profits improving, which mainly reflected the growth in overseas economies, business fixed investment plans were becoming solid on the whole. They also shared the recognition that the employment and income situation had improved steadily and private consumption had increased its resilience. Members then concurred that a positive output gap had taken hold, given the recent tightening of labor market conditions and the increase in capacity utilization rates, with the latter reflecting a rise in production. Based on this discussion, they agreed to revise the Bank’s economic assessment upward to one stating that Japan’s economy “is expanding moderately, with a virtuous cycle from income to spending operating” from the previous one stating that the economy “has been turning toward a moderate expansion.” One member pointed out that Japan’s economy was shifting from a recovery dependent on external demand to a more self-sustaining expansion brought about by an improvement in domestic demand. This member continued that it was also becoming evident that improvements in economic activity had been spreading across a wider range of areas, urban to regional.
The current QQE policies were reconfirmed (emphasis mine):-
With regard to the amount of JGBs to be purchased, it would conduct purchases at more or less the current pace — an annual pace of increase in the amount outstanding of its JGB holdings of about 80 trillion yen — aiming to achieve the target level of the long-term interest rate specified by the guideline.
With regard to asset purchases other than JGB purchases, many members shared the recognition that it was appropriate for the Bank to implement the following guideline for the intermeeting period. First, it would purchase exchange-traded funds (ETFs) and Japan real estate investment trusts (J-REITs) so that their amounts outstanding would increase at annual paces of about 6 trillion yen and about 90 billion yen, respectively. Second, as for CP and corporate bonds, it would maintain their amounts outstanding at about 2.2 trillion yen and about 3.2 trillion yen, respectively.
An independent summation of the current environment and the prospects for the Japanese economy comes from an article by Kazumasa Iwata – President of the Japan Center for Economic Research – AJISS – The Future of the Japanese Economy: The Great Convergence and Two Great Unwindings:-
Since bottoming out in November 2012, the Japanese economy has been in an expansionary phase that reached its 58th month in September of this year. Although not yet as long as the economic expansion achieved during the Koizumi reforms (73 months), the current phase exceeded the mark set by the Izanagi boom of the late 1960s (57 months). While this phase is technically termed expansionary, it lacks strength. In contrast to the average growth rate of 1.8% seen during the Koizumi reforms, the average rate in the ongoing expansion has only been about 1%.
The economic strategy underlying Abenomics is to put the Japanese economy on the road to 2% growth. The experiences of the Koizumi reforms demonstrate that it is quite possible to realize 2% growth by implementing an effective growth strategy. This is evidenced by the theory of convergence through technology diffusion. The catch-up attained by China, India and other emerging countries since the 1990s through offshoring and the construction of global value chains has been astounding. Professor Richard Baldwin argues that the start of the Industrial Revolution ushered in an era of Great Divergence for the global economy via technological innovation and capital accumulation in the developed countries and elsewhere, and that from the 1990s we have been in an age of Great Convergence due to rapid drops in information and telecommunications costs.
In contrast to the brisk development enjoyed by emerging countries, Japan has found itself in a two-decade-long period of stagnation, its economy falling far below the convergence line predicted by Convergence Theory…
Japan already failed to boost its productivity during the 1st IT Revolution of the mid-1990s, and it is now in the 2nd IT Revolution, otherwise known as the 4th Industrial Revolution, centered on IoT, AI, and Big Data. OECD research shows that the top 5% frontier companies have not seen a decline in productivity growth since the financial crisis. Other companies lag behind these frontier companies in globalizing and using digital technology (digitalization), which has only widened the productivity gap between them. Were all companies in Japan able to boost their performance on par with the top ten companies utilizing AI and IoT, Japan’s growth rate could be accelerated by 4% (JCER 2017).
It is interesting to note that Iwata-san sees the greatest risk coming from the unwinding of QE by the Federal Reserve and the ECB, combined with the increasingly protectionist stance of US trade policy. He does not appear to expect the BoJ to reverse QQE, nor Abenomics to falter.
Market Impact
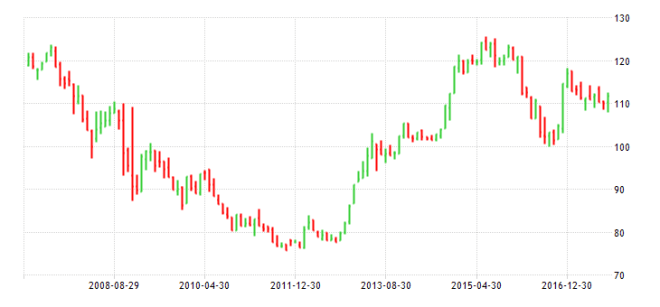
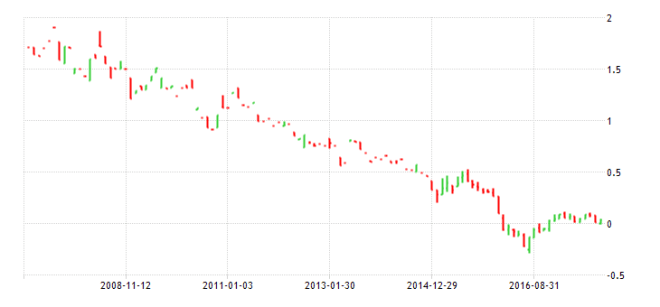
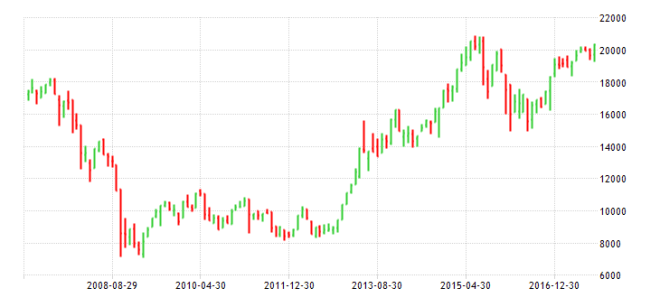
What does the forthcoming election and continuation of infinite QQE mean for Japanese financial markets? Firstly here are three 10 year charts, of the USDJPY, 10yr JGBs and the Nikkei 225:-
Source: Trading Economics
Source: Trading Economics
Source: Trading Economics
The Yen has been trading a range this year; it has strengthened against a generally weakening US$, whilst weakening against a resurgent Euro. 10yr JGBs have been held in an effective straightjacket by ‘Yield curve control’. Meanwhile the Nikkei 225 has followed the lead of other equity markets, both in Asia and the US, and marched steadily higher. A break above the highs of August 2015 would see the index trading at its highest since 1997. A dividend yield of 2% (source: Star Capital – as at 30/6/2017) looks attractive compared to JGBs or inflation, although a P/E ratio of more than 17 times and a CAPE ratio above 26 may be cause for caution.
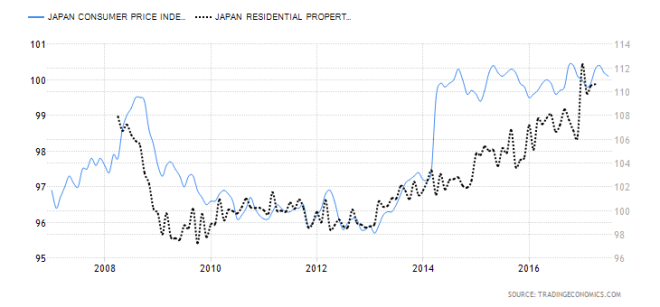
An assessment of financial markets would not be complete without a review of real estate. The BoJ mentioned that house prices have been fairly flat this year. Below is a r chart of the Japan Housing Index and the CPI Index since the financial crisis of 2008:-
Source: Trading Economics, Japan Ministry of Internal Affairs
Real Estate rental yields are currently around 2.5% making property an alternative to stocks for the long term investor. Personally, with dividend yields around 2%, I would want more than 50 basis points to invest in such an illiquid asset: chacun a son gout.
The Geopolitics of North Korea makes Japan vulnerable: Japan’s currency will bear the brunt of this. Given that much of the recent economic growth has been export led, this Yen weakness is unlikely to damage the prospects for the stock market, except perhaps in the short-term.
If Abe wins a convincing mandate on 22nd October, military spending may be added to the mix of public sector stimulus. Pervious consumption tax increases have proved damaging to the nascent economic recovery, this time, dare I say it, might be different. With wages increasing and domestic demand finally beginning to rise, a moderate tax hike maybe achievable, although I still think it more likely that implementation will be deferred.
The table below, which shows the top 10 best value stocks in the Nikkei, was calculated on 28th April. It is produced by Obermatt – click on the name to find out more about Obermatt’s excellent range of services and their valuation methodologies:-
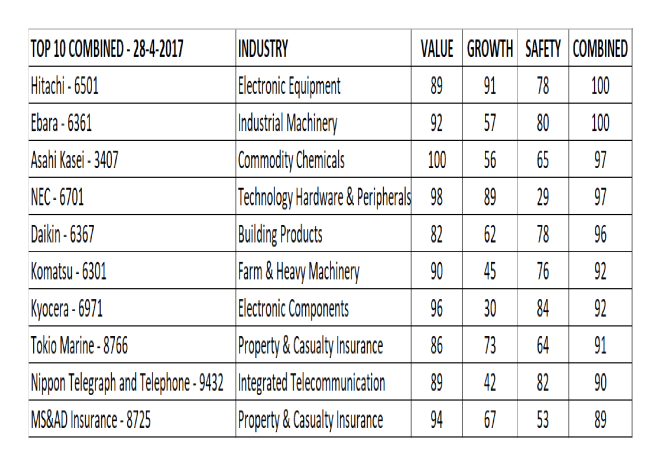
Source: Obermatt
To be clear, being a top-down macro investor, I have not personally delved into the relative merits of the stocks above, but I am comforted to note that most of them are household names, even outside Japan. A testament to the quality of many Japanese corporations.
From a technical perspective one should have bought the chart breakout back in November 2016. The market is close to resistance at 21,000 and I would like to see a monthly close above this level before risking additional capital, however, after nearly three decades of deflationary adjustment, the Japanese economy may be beginning to find sustainable growth. I believe this is despite, rather than as a result of, government and central bank policy: but that’s a topic for another time.

Macro Letter – No 79 – 16-6-2017
Central Bank balance sheet adjustment – a path to enlightenment?
The Federal Reserve (Fed) is about to embark on a reversal of the Quantitative Easing (QE) which it first began in November 2008. Here is the 14th June Federal Reserve Press Release – FOMC issues addendum to the Policy Normalization Principles and Plans. This is the important part:-
For payments of principal that the Federal Reserve receives from maturing Treasury securities, the Committee anticipates that the cap will be $6 billion per month initially and will increase in steps of $6 billion at three-month intervals over 12 months until it reaches $30 billion per month.
For payments of principal that the Federal Reserve receives from its holdings of agency debt and mortgage-backed securities, the Committee anticipates that the cap will be $4 billion per month initially and will increase in steps of $4 billion at three-month intervals over 12 months until it reaches $20 billion per month.
The Committee also anticipates that the caps will remain in place once they reach their respective maximums so that the Federal Reserve’s securities holdings will continue to decline in a gradual and predictable manner until the Committee judges that the Federal Reserve is holding no more securities than necessary to implement monetary policy efficiently and effectively.
On the basis of their press release, the Fed balance sheet will shrink until it is nearer $2.5trln versus $4.4trln today. If they stick to their schedule that should take until the end of 2021.
The Fed is likely to be followed by the other major Central Banks (CBs) in due course. Their combined deleveraging is unlikely to go unnoticed in financial markets. What are the likely implications for bonds and stocks?
To begin here are a series of charts which tell the story of the Central Bankers’ response to the Great Recession:-
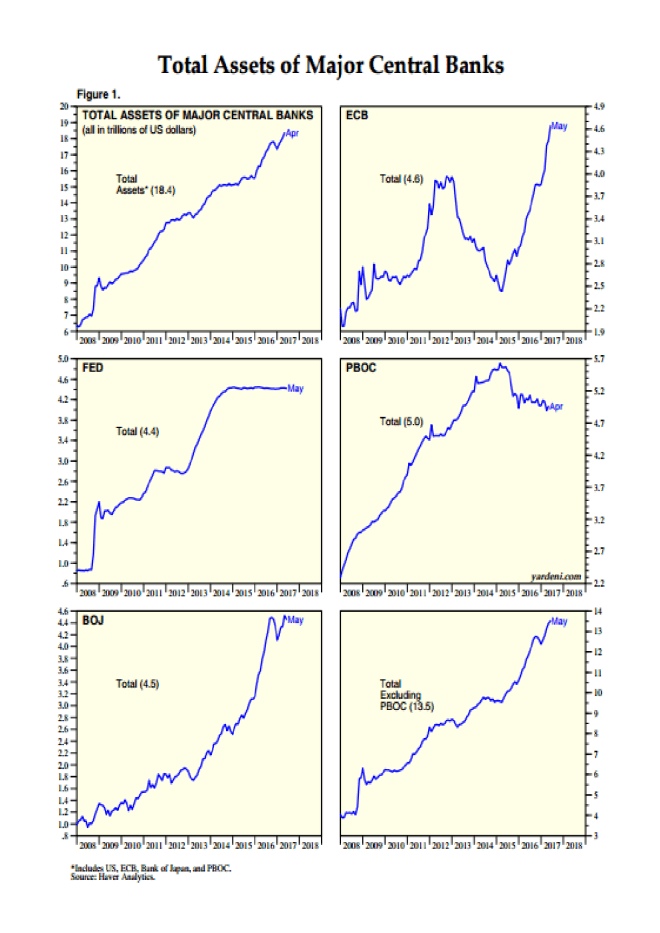
Source: Yardeni Research, Haver Analytics
Since 2008 the balance sheets of the four major CBs have grown from around $6.5trln to $18.4trln. In the case of the People’s Bank of China (PBoC), a reduction began in 2015. This took the form of a decline in its foreign exchange reserves in order to support the weakening RMB exchange rate against the US$. The next chart shows the path of Chinese FX reserves and the Shanghai Stock index since the beginning of 2014. Lagged response or coincidence? Your call:-
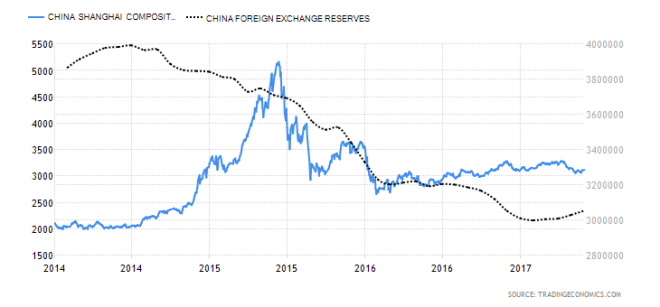
Source: Trading Economics
At a global level, the PBoC balance sheet reduction has been more than offset by the expansion of the balance sheets of the Bank of Japan (BoJ) and European Central Bank (ECB), however, a synchronous balance sheet contraction by all the major CBs is likely to be of considerable concern to financial market participants globally.
An historical perspective
Have CB balance sheets ever been as large as they are today? Indeed they have. The chart below which terminates in 2011, shows the evolution of the Fed balance sheet since its inception in 1913:-
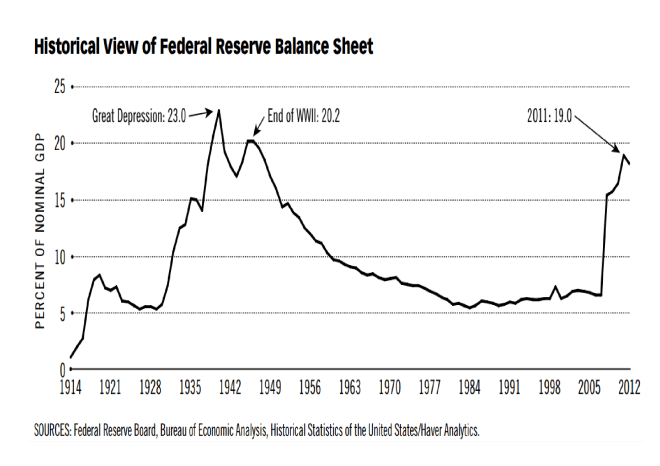
Source: Federal Reserve, Haver Analytics
The increase in the size of the Fed balance sheet during the period of the Great Depression and WWII was related to a number of factors including: gold inflows, what Friedman and Schwartz termed “precautionary demand” for reserves by commercial banks, lack of alternative assets, changes in reserve requirements, expansion of income and war financing.
For a detailed review of all these factors, this paper from 2016 – How was the Quantitative Easing Program of the 1930s Unwound? By Matthew Jaremski and Gabriel Mathy – makes fascinating reading, here’s the abstract:-
Outside of the recent past, excess reserves have only concerned policymakers in one other period: The Great Depression of the 1930s. This historical episode thus provides the only guidance about the Fed’s current predicament of how to unwind from the extensive Quantitative Easing program. Excess reserves in the 1930s were never actively unwound through a reduction in the monetary base. Nominal economic growth swelled required reserves while an exogenous reduction in monetary gold inflows due to war embargoes in Europe allowed banks to naturally reduce their excess reserves. Excess reserves fell rapidly in 1941 and would have unwound fully even without the entry of the United States into World War II. As such, policy tightening was at no point necessary and likely was even responsible for the 1937-1938 recession.
During the period from April 1937 to April 1938 the Dow Jones Industrial Average fell from 194 to 100. Monetarists, such as Friedman, blamed the recession on a tightening of money supply in 1936 and 1937. I don’t believe Friedman’s censure is lost on the FOMC today: past Fed Chair, Ben Bernanke, is regarded as one of the world’s leading authorities on the causes and policy errors of the Great Depression.
But is the size of a CB balance sheet a determinant of the direction of the stock market? A richer data set is to be found care of the Bank of England (BoE). They provide balance sheet data going back to 1694, although the chart below, care of FRED, starts in 1701:-
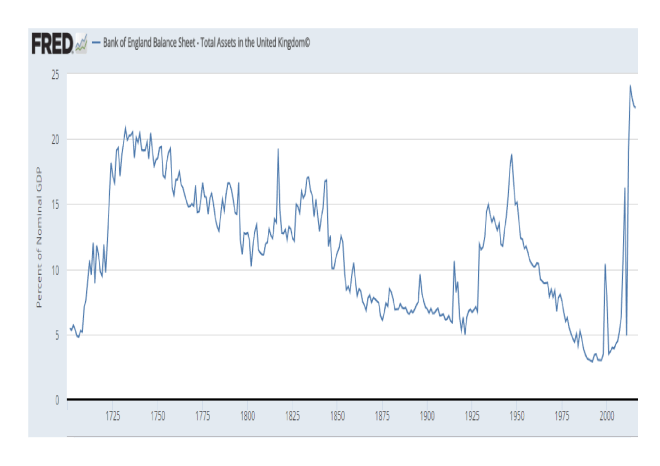
Source: Federal Reserve, Bank of England
The BoE really only became a CB, in the sense we might recognise today, as a result of the Banking Act of 1844 which granted it a monopoly on the issuance of bank notes. The chart below shows the performance of the FT-All Share Index since 1700 (please ignore the reference to the Pontifical change, this was the only chart, offering a sufficiently long history, which I was able to discover in the public domain):-
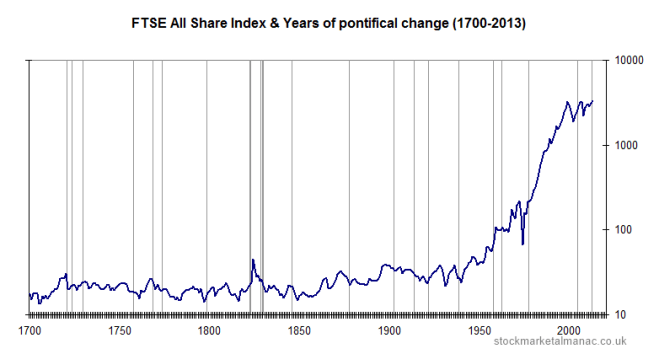
Source: The Stock Almanac
The first crisis to test the Bank’s resolve was the panic of 1857. During this period the UK stock market barely changed whilst the BoE balance sheet expanded by 21% between 1857 and 1859 to reach 10.5% of GDP: one might, however, argue that its actions were supportive.
The next crisis, the recession of 1867, was precipitated by the end of the American Civil War and, of more importance to the financial system, the demise of Overund and Gurney, “the Bankers Bank”, which was declared insolvent in 1866. Perhaps surprisingly, the stock market remained relatively calm and the BoE balance sheet expanded at a more modest 20% over the two years to 1858.
Financial markets became a little more interconnected during the Panic of 1873. This commenced with the “Gründerzeit” or “Founders” crash on the Vienna Stock Exchange. It sent shockwaves around the world. The UK stock market declined by 31% between 1873 and 1878. The BoE may have exacerbated the decline, its balance sheet contracted by 14% between 1873 and 1875. Thereafter the trend reversed, with an expansion of 30% over the next four years.
I am doubtful about the BoE balance sheet contraction between 1873 and 1875 being a policy mistake. 1873 was in fact the beginning of the period known as the Long Depression. It lasted until 1896. Nine years before the end of this 20 year depression the stock market bottomed (1887). It then rose by 74% over the next 11 years.
The First World War saw the stock market decline, reaching its low in 1917. From juncture it rallied, entirely ignoring the post-war recession of 1919 to 1921. Its momentum was only curtailed by the Great Crash of 1929 and subsequent Great Depression of 1930-1931.
Part of the blame for the severity of the Great Depression may be levelled at the BoE, its balance sheet expanded by 77% between 1928 and 1929. It then remained relatively stable despite Sterling’s departure from the Gold Standard in 1931 and only began to expand again in 1933 and 1934. Its balance sheet as a percentage of GDP was by this time at its highest since 1844, due to the decline in GDP rather than any determined effort to expand the balance sheet on the part of the Old Lady of Threadneedle Street. At the end of 1929 its balance sheet stood at £537mln, by the end of 1934 it had reached £630mln, an increase of just 17% over five traumatic years. The UK stock market, which had bottomed in 1931 – the level it had last traded in 1867 – proceeded to rally for the next five years.
Adjustment without tightening
History, on the basis of the data above, is ambivalent about the impact the size of a CB’s balance sheet has on the financial markets. It is but one of the factors which influences monetary conditions, the others are the availability of credit and its price.
George Selgin described the Fed’s situation clearly in a post earlier this year for The Cato Institute – On Shrinking the Fed’s Balance Sheet. He begins by looking at the Fed pre-2008:-
…the Fed got by with what now seems like a modest-sized balance sheet, the liabilities of which consisted mainly of circulating Federal Reserve notes, supplemented by Treasury and GSE deposit balances and by bank reserve balances only slightly greater than the small amounts needed to meet banks’ legal reserve requirements. Because banks held few excess reserves, it took only modest adjustments to the size of the Fed’s balance sheet, achieved by means of open-market purchases or sales of short-term Treasury securities, to make credit more or less scarce, and thereby achieve the Fed’s immediate policy objectives. Specifically, by altering the supply of bank reserves, the Fed could influence the federal funds rate — the rate banks paid other banks to borrow reserves overnight — and so keep that rate on target.
Then comes the era of QE – the sea-change into something rich and strange. The purchase of long-term Treasuries and Mortgage Backed Securities is funded using the excess reserves of the commercial banks which are held with the Fed. As Selgin points out this means the Fed can no longer use the federal funds rate to influence short-term interest rates (the emphasis is mine):-
So how does the Fed control credit now? Instead of increasing or reducing the availability of credit by adding to or subtracting from the supply of Fed deposit balances, the Fed now loosens or tightens credit by controlling financial institutions’ demand for such balances using a pair of new monetary control devices. By paying interest on excess reserves (IOER), the Fed rewards banks for keeping balances beyond what they need to meet their legal requirements; and by making overnight reverse repurchase agreements (ON-RRP) with various GSEs and money-market funds, it gets those institutions to lend funds to it.
Between them the IOER rate and the implicit ON-RRP rate define the upper and lower limits, respectively, of an effective federal funds rate target “range,” because most of the limited trading that now goes on in the federal funds market consists of overnight lending by GSEs (and the Federal Home Loan Banks especially), which are not eligible for IOER, to ordinary banks, which are. By raising its administered rates, the Fed encourages other financial institutions to maintain larger balances with it, instead of trading those balances for other interest-earning assets. Monetary tightening thus takes the form of a reduced money multiplier, rather than a reduced monetary base.
Selgin goes on to describe this as Confiscatory Credit Control:-
…Because instead of limiting the overall availability of credit like it did in the past, the Fed now limits the credit available to other prospective borrowers by grabbing more for itself, which it then passes on to the U.S. Treasury and to housing agencies whose securities it purchases.
The good news is that the Fed can adjust its balance sheet with relative ease (emphasis mine):-
It’s only because the Fed has been paying IOER at rates exceeding those on many Treasury securities, and on short-term Treasury securities especially, that banks (especially large domestic and foreign banks) have chosen to hoard reserves. Even today, despite rate increases, the IOER rate of 75 basis points exceeds yields on most Treasury bills. Were it not for this difference, banks would trade their excess reserves for Treasury securities, causing unwanted Fed balances to be passed around like so many hot-potatoes, and creating new bank deposits in the process. Because more deposits means more required reserves, banks would eventually have no excess reserves to dispose of.
Phasing out ON-RRP, on the other hand, would eliminate the artificial boost that program has been giving to non-bank financial institutions’ demand for Fed balances.
Because phasing out ON-RRP makes more reserves available to banks, while reducing IOER rates reduces banks’ own demand for such reserves, both policies are expansionary. They don’t alter the total supply of Fed balances. Instead they serve to raise the money multiplier by adding to banks’ capacity and willingness to expand their own balance sheets by acquiring non-reserve assets. But this expansionary result is a feature, not a bug: as former Fed Vice Chairman Alan Blinder observed in December 2013, the greater the money multiplier, the more the Fed can shrink its balance sheet without over-tightening. In principle, so long as it sells enough securities, the Fed can reduce its ON-RRP and IOER rates, relative to prevailing market rates, without missing its ultimate policy targets.
Selgin expands, suggesting that if the Fed decide to announce a fixed schedule for adjustment (which they have) then they may employ another tool from their armoury, the Term Deposit Facility:-
…to the extent that the Fed’s gradual asset sales fail to adequately compensate for a multiplier revival brought about by its scaling-back of ON-RRP and IOER, the Fed can take up the slack by sufficiently raising the return on its Term Deposits.
And the Fed’s federal funds rate target? What happens to that? In the first place, as the Fed scales back on ON-RRP and IOER, by allowing the rates paid through these arrangements to decline relative to short-term Treasury rates, its administered rates will become increasingly irrelevant. The same changes, together with concurrent assets sales, will make the effective federal funds rate more relevant, by reducing banks’ excess reserves and increasing overnight borrowing. While the changes are ongoing, the Fed would continue to post administered rates; but it could also revive its pre-crisis practice of announcing a single-valued effective funds rate target. In time, the latter target could once again be more-or-less precisely met, making it unnecessary for the Fed to continue referring to any target range.
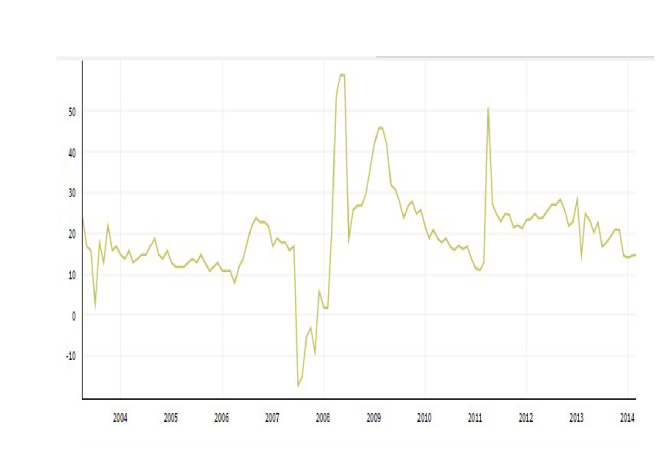
With unemployment falling and economic growth steady the Fed are expected to tighten monetary policy further but the balance sheet adjustment needs to be handled carefully, conditions may look benign but the Fed ultimately holds more of the nation’s deposits than at any time since the end of WWII. Bank lending (last at 1.6%) is anaemic at best, as the chart below makes clear:-
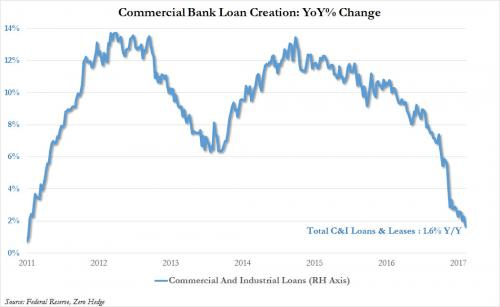
Source: Federal Reserve, Zero Hedge
The global perspective
The implications of balance sheet adjustment for the US have been discussed in detail but what about the rest of the world? In an FT Article – The end of global QE is fast approaching – Gavyn Davies of Fulcrum Asset Management makes some projections. He sees global QE reaching a plateau next year and then beginning to recede, his estimate for the Fed adjustment is slightly lower than the schedule announced last Wednesday:-

Source: FT, Fulcrum Asset Management
He then looks at the previous liquidity injections relative to GDP – don’t forget 2009 saw the world growth decline by -0.8%:-
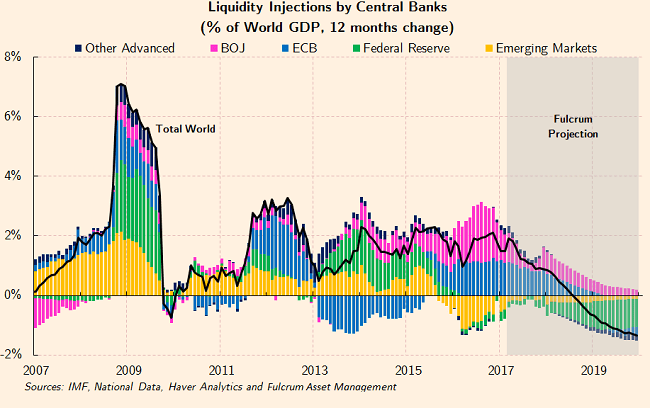
Source: IMF, National Data, Haver Analytics, Fulcrum Asset Management
It is worth noting that the contraction of Emerging Market CB liquidity during 2016 was principally due to the PBoc reducing their foreign exchange reserves. The ECB reduction of 2013 – 2015 looks like a policy mistake which they are now at pains to rectify.
Finally Davies looks at the breakdown by institution. The BoJ continues to expand its balance sheet, rising above 100% of GDP, whilst eventually the ECB begins to adjust as it breaches 40%:-
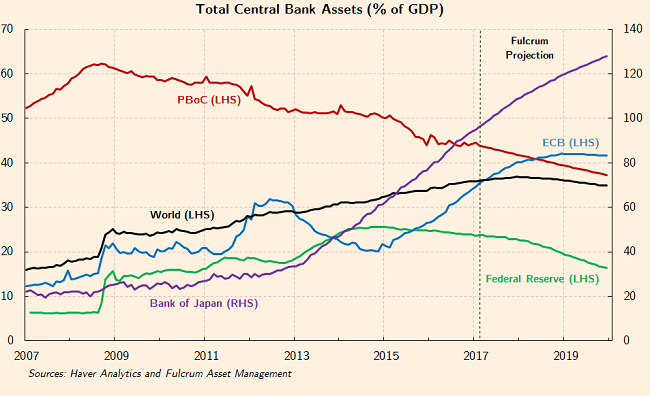
Source: Haver Analytics, Fulcrum Asset Management
I am not as confident as Davies about the ECB’s ability to reverse QE. They were never able to implement a European equivalent of the US Emergency Economic Stabilization Act of 2008, which incorporated the Troubled Asset Relief Program – TARP and the bailout of Fannie Mae and Freddie Mac. Europe’s banking system remains inherently fragile.
ProPublica – Bailout Costs – gives a breakdown of cost of the US bailout. The policies have proved reasonable successful and at little cost the US tax payer. Since initiation in 2008 outflows have totalled $623.4bln whilst the inflows amount to $708.4bln: a net profit to the US government of $84.9bln. Of course, with $455bln of troubled assets still outstanding, there is still room for disappointment.
The effect of TARP was to unencumber commercial banks. Freed of their NPL’s they were able to provide new credit to the real economy once more. European banks remain saddled with an abundance of NPL’s; her governments have been unable to agree on a path to enlightenment.
Conclusions and Investment Opportunities
The chart below shows a selection of CB balance sheets as a percentage of GDP. It is up to the end of 2016:-
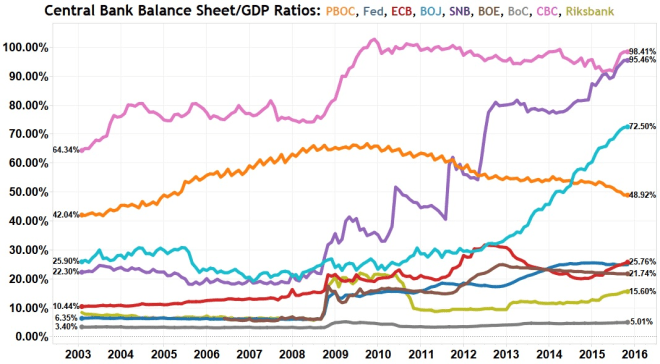
SNB: Swiss National Bank, BoC: Bank of Canada, CBC: Central Bank of Taiwan, Riksbank: Swedish National Bank
Source: National Inflation Association
The BoJ has since then expanded its balance sheet to 95.5% and the ECB, to 32%. With the Chinese economy still expanding (6.9% March 2017) the PBoC has seen its ratio fall to 45.4%.
More important than the sheer scale of CB balance sheets, the global expansion has changed the way the world economy works. Combined CB balance sheets ($22trln) equal 21.5% of global GDP ($102.4trln). The assets held are predominantly government and agency bonds. The capital raised by these governments is then invested primarily in the public sector. The private sector has been progressively crowded out of the world economy ever since 2008.
In some ways this crowding out of the private sector is similar to the impact of the New Deal era of 1930’s America. The private sector needs to regain pre-eminence but the transition is likely to be slow and uneven. The tide may be about to turn but the chance for policy mistakes, as flows reverse, is extremely high.
For stock markets the transition to QT – quantitative tightening – may be neutral but the risks are on the downside. For government bond markets there are similar concerns: who will buy the bonds the CBs need to sell? If interest rates normalise will governments be forced to tighten their belts? Will the private sector be in a position to fill the vacuum created by reduced public spending, if they do?
There is an additional risk. Yield curve flattening. Banks borrow short and lend long. When yield curves are positively sloped they can quickly recapitalise their balance sheets: when yield curves are flat, or worse still inverted, they cannot. Increases in reserve requirements have made government bonds much more attractive to hold than other securities or loans. The Commercial Bank Loan Creation chart above may be seen as a warning signal. The mechanism by which CBs foster credit expansion in the real economy is still broken. A tapering or an adjustment of CB balance sheets, combined with a tightening of monetary policy, may have profound unintended consequences which will be magnified by a severe shakeout in over-extended stock and bond markets. Caveat emptor.

Macro Letter – No 65 – 11-11-2016
Yield Curve Control – the road to infinite QE
Zero Yield 10 year
Ever since central banks embarked on quantitative easing (QE) they were effectively taking control of their domestic government yield curves. Of course this was de facto. Now, in Japan, it has finally been declared de jure since the Bank of Japan (BoJ) announced the (not so) new policy of “Yield Curve Control”. New Framework for Strengthening Monetary Easing: “Quantitative and Qualitative Monetary Easing with Yield Curve Control”, published on 21st September, is a tacit admission that BoJ intervention in the Japanese Government Bond market (JGB) is effectively unlimited. This is how they described it (the emphasis is mine):-
The Bank will purchase Japanese government bonds (JGBs) so that 10-year JGB yields will remain more or less at the current level (around zero percent). With regard to the amount of JGBs to be purchased, the Bank will conduct purchases more or less in line with the current pace — an annual pace of increase in the amount outstanding of its JGB holdings at about 80 trillion yen — aiming to achieve the target level of a long-term interest rate specified by the guideline. JGBs with a wide range of maturities will continue to be eligible for purchase…
By the end of September 2016 the BoJ owned JPY 340.9trln (39.9%) of outstanding JGB issuance – they cannot claim to conduct purchases “more of less in line with the current pace” and maintain a target 10 year yield. Either they will fail to maintain the 10 year yield target in order to maintain their purchase target of JPY 80trln/annum or they will forsake their purchase target in order to maintain the 10 year yield target. Either they are admitting that the current policy of the BoJ (and other central banks which have embraced quantitative easing) is a limited form of “Yield Curve Control” or they are announcing a sea-change to an environment where the target yield will take precedence. If it is to be the latter, infinite QE is implied even if it is not stated for the record.
Zero Coupon Perpetuals
I believe the 21st September announcement is a sea-change. My concern is how the BoJ can ever hope to unwind the QE. One suggestion coming from commentators but definitely not from the BoJ, which gained credence in April – and again, after Ben Bernanke’s visit to Tokyo in July – is that the Japanese government should issue Zero Coupon Perpetual bonds. Zero-coupon bonds are not a joke – 28th August – by Edward Chancellor discusses the subject:-
Bernanke’s latest bright idea is that the Bank of Japan, which has bought up close to half the country’s outstanding government debt, should convert its bond holdings into zero-coupon perpetual securities – that is, financial instruments with no intrinsic value.
The difference between a central bank owning zero-coupon perpetual notes and conventional bonds is that the former cannot be sold to withdraw excess liquidity from the banking system. That means the Bank of Japan would lose a key tool in controlling inflation. So as expectations about rising prices blossomed, Japan’s decades-long battle against deflation would finally end. There are further benefits to this proposal. In one fell swoop, Japan’s public-debt overhang would disappear. As the government’s debt-service costs dried up, Tokyo would be able to fund massive public works.
In reality a zero coupon perpetual bond looks suspiciously like good old-fashion fiat cash, except that the bonds will be held in dematerialisied form – you won’t need a wheel-barrow:-
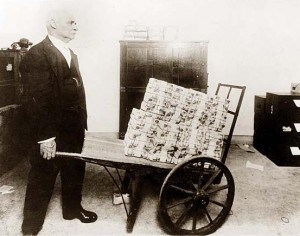
Source: Washington Post
Issuing zero coupon perpetuals in exchange for conventional JGBs solves the debt problem for the Japanese government but leaves the BoJ with a permanently distended balance sheet and no means of reversing the process.
Why change tack?
Japan has been encumbered with low growth and incipient deflation for much longer than the other developed nations. The BoJ has, therefore, been at the vanguard of unconventional policy initiatives. This is how they describe their latest experiment:-
QQE has brought about improvements in economic activity and prices mainly through the decline in real interest rates, and Japan’s economy is no longer in deflation, which is commonly defined as a sustained decline in prices. With this in mind, “yield curve control,” in which the Bank will seek for the decline in real interest rates by controlling short-term and long-term interest rates, would be placed at the core of the new policy framework.
The experience so far with the negative interest rate policy shows that a combination of the negative interest rate on current account balances at the Bank and JGB purchases is effective for yield curve control. In addition, the Bank decided to introduce new tools of market operations which will facilitate smooth implementation of yield curve control.
The new tools introduced to augment current policy are:-
The reality is that negative interest rate policy (NIRP) has precipitated an even swifter decline in the velocity of monetary circulation. The stimulative impact of expanding the monetary base is negated by the collapse it its circulation.
An additional problem has been with the mechanism by which monetary stimulus is transmitted to the real economy – the banking sector. Bank lending has been stifled by the steady flattening of the yield curve. The chart below shows the evolution since December 2012:-
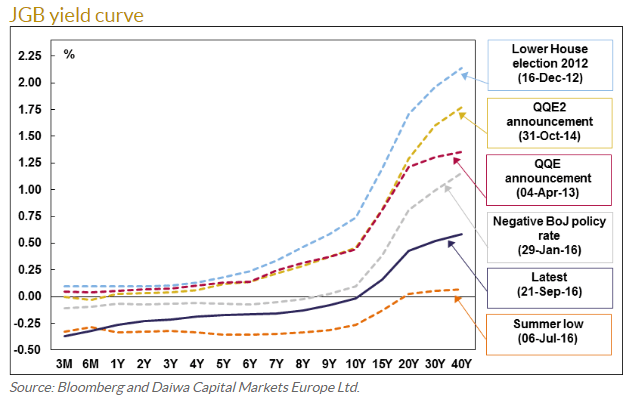
Source: Bloomberg, Daiwa Capital Markets Europe
10yr JGB yields have not exceeded 2% since 1998. At that time the base rate was 0.20% – that equates to 180bp of positive carry. Today 40yr JGBs yield 0.57% whilst maturities of 10 years or less trade at negative yields. Little wonder that monetary velocity is declining.
The tightening of bank reserve requirements in the aftermath of the great financial recession has further impeded the provision of credit. It is hardly optimal for banks to lend their reserves to the BoJ at negative rates but they also have scant incentive to lend to corporates when government bond yields are negative and credit spreads are near to historic lows. Back in 1998 a AA rated 10yr corporate bond traded between 40bp and 50bp above 10yr JGBs, the chart below shows where they have traded since 2003:-
Source: Quandl
For comparison the BofA Merrill Lynch US Corporate AA Option-Adjusted Spread is currently at 86bp off a post 2008 low of 63bp seen in April and June 2014. In the US, where the velocity of monetary circulation is also in decline, banks can borrow at close to the zero bound and lend for 10 years to an AA name at around 2.80%. Their counterparts in Japan have little incentive when the carry is a miserly 0.20%.
This is how the BoJ describe the effect NIRP has had on lending to corporates. They go on to observe that the shape of the yield curve is an important factor for several reasons:-
The decline in JGB yields has translated into a decline in lending rates as well as interest rates on corporate bonds and CP. Financial institutions’ lending attitudes continue to be proactive. Thus, so far, financial conditions have become more accommodative under the negative interest rate policy. However, because the decline in lending rates has been brought about by reducing financial institutions’ lending margins, the extent to which a further decline in the yield curve will lead to a decline in lending rates depends on financial institutions’ lending stance going forward.
The impact of interest rates on economic activity and prices as well as financial conditions depends on the shape of the yield curve. In this regard, the following three points warrant attention. First, short- and medium-term interest rates have a larger impact on economic activity than longer-term rates. Second, the link between the impact of interest rates and the shape of the yield curve may change as firms explore new ways of raising funds such as issuing super-long-term corporate bonds under the current monetary easing, including the negative interest rate policy. Third, an excessive decline and flattening of the yield curve may have a negative impact on economic activity by leading to a deterioration in people’s sentiment, as it can cause uncertainty about the sustainability of financial functioning in a broader sense.
The BoJ’s hope of stimulating bank lending is based on the assumption that there is genuine demand for loans from corporations’: and that those corporations’ then invest in the real-economy. The chart below highlights the increasing levels of Japanese share buybacks over the last five years:-

Source: FT, Goldman Sachs
Share buybacks inflate stock prices and, when buybacks are financed with debt, alter the capital structure. None of this zeitech stimulates lasting economic growth.
Conclusion and investment opportunities
If zero 10 year JGB yields are unlikely to encourage banks to lend and demand from corporate borrowers remains negligible, what is the purpose of the BoJ policy shift? I believe they are creating the conditions for the Japanese government to dramatically increase spending, safe in the knowledge that the JGB yield curve will only steepen beyond 10 year maturity.
I do not believe yield curve control will improve the economics of bank lending at all. According to World Bank data the average maturity of Japanese corporate syndicated loans in 2015 was 4.5 years whilst for corporate bonds it was 6.9 years. Corporate bond issuance accounted for only 5% of total bond issuance in Japan last year – in the US it was 24%. Even with unprecedented low interest rates, demand to borrow for 15 years and longer will remain de minimis.
Financial markets will begin to realise that, whilst the BoJ has not quite embraced the nom de guerre of “The bank that launched Helicopter Money”, they have, assuming they don’t lose their nerve, embarked on “The road to infinite QE”. Under these conditions the JPY will decline and the Japanese stock market will rise.

Macro letter – No 61 – 16-09-2016
Is the “flight to quality” effect breaking down?
Back in 2010 I switched out of fixed income securities. I was much too early! Fortunately I had other investments which allowed me to benefit from the extraordinary rally in government bonds, driven by the central bank quantitative easing (QE) policies.
In the aftermath of Brexit the total outstanding amount of bonds with negative yields hit $13trln – that still leaves $32trln which offer a positive return. This is alarming nonetheless, according to this 10th July article from ZeroHedge, a 1% rise in yields would equate to a mark-to-market loss of $2.4trln. The chart below shows the capital impact of a 1% yield change for different categories of bonds:-

Source: ZeroHedge
Looked at another way, the table above suggests that the downside risk of holding US Treasuries, in the event of a 1% rise in yields, is 2.8 times greater than holding Investment Grade corporate bonds.
Corporate bonds, even of investment grade, traditionally exhibit less liquidity and greater credit risk, but, in the current, ultra-low interest rate, environment, the “capital” risk associated with government bonds is substantially higher. It can be argued that the “free-float” of government bonds has been reduced by central bank buying. A paper from the IMF – Government Bonds and Their Investors: What Are the Facts and Do They Matter? provides a fascinating insight into government bond holdings by investor type. The central bank with the largest percentage holding is the Bank of England (BoE) 19.7% followed by the Federal Reserve (Fed) 11.5% and the Bank of Japan (BoJ) 8.3% – although the Japanese Post Office, with 29%, must be taken into account as well. The impact of central bank buying on secondary market liquidity may be greater, however, since the central banks have principally been accumulating “on the run” issues.
Since 2008, financial markets in general, and government bond markets in particular, have been driven by central bank policy. Fear about tightening of monetary conditions, therefore, has more impact than ever before. Traditionally, when the stock market falls suddenly, the price of government bonds rises – this is the “flight to quality” effect. It also leads to a widening of the spread between “risk-free” assets and those carrying greater credit and liquidity risk. As the table above indicates, however, today the “capital” risk associated with holding government securities, relative to higher yielding bonds has increased substantially. This is both as a result of low, or negative, yields and reduced liquidity resulting from central bank asset purchases. These factors are offsetting the traditional “flight to quality” effect.
Last Friday, government bond yields increased around the world amid concerns about Fed tightening later this month – or later this year. The table below shows the change in 10yr to 30yrs Gilt yields together with a selection of Sterling denominated corporate bonds. I have chosen to focus on the UK because the BoE announced on August 4th that they intend to purchase £10bln of Investment Grade corporate bonds as part of their Asset Purchase Programme. Spreads between Corporates and Gilts narrowed since early August, although shorter maturities benefitted most.
| Issuer | Maturity | Yield | Gilt yield | Spread over Gilts | Corporate Change 7th to 12th | Gilts change 7th to 12th |
| Barclays Bank Plc | 2026 | 3.52 | 0.865 | 2.655 | 0.19 | 0.18 |
| A2Dominion | 2026 | 2.938 | 0.865 | 2.073 | 0.03 | 0.18 |
| Sncf | 2027 | 1.652 | 0.865 | 0.787 | 0.18 | 0.18 |
| EDF | 2027 | 1.9 | 0.865 | 1.035 | 0.19 | 0.18 |
| National Grid Co Plc | 2028 | 1.523 | 0.865 | 0.658 | 0.19 | 0.18 |
| Italy (Republic of) | 2028 | 2.891 | 0.865 | 2.026 | 0.17 | 0.18 |
| Kreditanstalt fuer Wiederaufbau | 2028 | 1.187 | 0.865 | 0.322 | 0.18 | 0.18 |
| EIB | 2028 | 1.347 | 0.865 | 0.482 | 0.18 | 0.18 |
| BT | 2028 | 1.976 | 0.865 | 1.111 | 0.2 | 0.18 |
| General Elec Cap Corp | 2028 | 1.674 | 0.865 | 0.809 | 0.2 | 0.18 |
| Severn Trent | 2029 | 1.869 | 1.248 | 0.621 | 0.19 | 0.18 |
| Tesco Plc | 2029 | 4.476 | 1.248 | 3.228 | 0.2 | 0.18 |
| Procter & Gamble Co | 2030 | 1.683 | 1.248 | 0.435 | 0.2 | 0.18 |
| RWE Finance Bv | 2030 | 3.046 | 1.248 | 1.798 | 0.17 | 0.22 |
| Citigroup Inc | 2030 | 2.367 | 1.248 | 1.119 | 0.2 | 0.22 |
| Wal-mart Stores | 2030 | 1.825 | 1.248 | 0.577 | 0.2 | 0.22 |
| EDF | 2031 | 2.459 | 1.248 | 1.211 | 0.22 | 0.22 |
| GE | 2031 | 1.778 | 1.248 | 0.53 | 0.21 | 0.22 |
| Enterprise Inns plc | 2031 | 6.382 | 1.248 | 5.134 | 0.03 | 0.22 |
| Prudential Finance Bv | 2031 | 3.574 | 1.248 | 2.326 | 0.19 | 0.22 |
| EIB | 2032 | 1.407 | 1.248 | 0.159 | 0.2 | 0.22 |
| Kreditanstalt fuer Wiederaufbau | 2032 | 1.311 | 1.248 | 0.063 | 0.19 | 0.22 |
| Vodafone Group PLC | 2032 | 2.887 | 1.248 | 1.639 | 0.24 | 0.22 |
| Tesco Plc | 2033 | 4.824 | 1.248 | 3.576 | 0.21 | 0.22 |
| GE | 2033 | 1.88 | 1.248 | 0.632 | 0.21 | 0.22 |
| Proctor & Gamble | 2033 | 1.786 | 1.248 | 0.538 | 0.2 | 0.22 |
| HSBC Bank Plc | 2033 | 3.485 | 1.248 | 2.237 | 0.21 | 0.22 |
| Wessex Water | 2033 | 2.114 | 1.248 | 0.866 | 0.19 | 0.22 |
| Nestle | 2033 | 0.899 | 1.248 | -0.349 | 0.16 | 0.22 |
| Glaxo | 2033 | 1.927 | 1.248 | 0.679 | 0.2 | 0.22 |
| Segro PLC | 2035 | 2.512 | 1.401 | 1.111 | 0.19 | 0.22 |
| Walmart | 2035 | 2.028 | 1.401 | 0.627 | 0.2 | 0.22 |
| Aviva Plc | 2036 | 3.979 | 1.401 | 2.578 | 0.18 | 0.22 |
| General Electric | 2037 | 2.325 | 1.401 | 0.924 | 0.23 | 0.22 |
| Lcr Financial Plc | 2038 | 1.762 | 1.401 | 0.361 | 0.2 | 0.22 |
| EIB | 2039 | 1.64 | 1.401 | 0.239 | 0.2 | 0.22 |
| Lloyds TSB | 2040 | 2.693 | 1.495 | 1.198 | 0.2 | 0.22 |
| GE | 2040 | 2.114 | 1.495 | 0.619 | 0.2 | 0.22 |
| Direct Line | 2042 | 6.738 | 1.495 | 5.243 | 0.06 | 0.22 |
| Barclays Bank Plc | 2049 | 3.706 | 1.4 | 2.306 | 0.1 | 0.22 |
Source: Fixed Income Investor, Investing.com
The spread between international issuers such as Nestle – which, being Swiss, trades at a discount to Gilts – narrowed, however, higher yielding names, such as Direct Line, did likewise.
For comparison the table below – using the issues in bold from the table above – shows the change between the 22nd and 23rd June – pre and post-Brexit:-
| Maturity | Gilts 22-6 | Corporate 22-6 | Gilts 23-6 | Corporate 23-6 | Issuer | Spread 22-6 | Spread 23-6 | Spread change |
| 10y | 1.314 | 4.18 | 1.396 | 4.68 | Barclays | 2.866 | 3.284 | 0.418 |
| 15y | 1.879 | 3.86 | 1.96 | 3.88 | Vodafone | 1.981 | 1.92 | -0.061 |
| 20y | 2.065 | 4.76 | 2.124 | 4.78 | Aviva | 2.695 | 2.656 | -0.039 |
| 25y | 2.137 | 3.42 | 2.195 | 3.43 | Lloyds | 1.283 | 1.235 | -0.048 |
| 30y | 2.149 | 4.21 | 2.229 | 4.23 | Barclays | 2.061 | 2.001 | -0.06 |
Source: Fixed Income Investor, Investing.com
Apart from a sharp increase in the yield on the 10yr Barclays issue (the 30yr did not react in the same manner) the spread between Gilts and corporates narrowed over the Brexit debacle too. This might be because bid/offer spreads in the corporate market became excessively wide – Gilts would have become the only realistic means of hedging – but the closing prices of the corporate names should have reflected mid-market yields.
If the “safe-haven” of Gilts has lost its lustre where should one invest? With patience and in higher yielding bonds – is one answer. Here is another from Ben Lord of M&G’s Bond Vigilantes – The BoE and ECB render the US bond market the only game in town:-
…The ultra-long conventional gilt has returned a staggering 52% this year. Since the result of the referendum became clear, the bond’s price has increased by 20%, and in the couple of weeks since Mark Carney announced the Bank of England’s stimulus package, the bond’s price has risen by a further 13%.
…the 2068 index-linked gilt, which has seen its price rise by 57% year-to-date, by 35% since the vote to exit Europe, and by 18% since further quantitative easing was announced by the central bank. Interestingly, too, the superior price action of the index-linked bond has occurred not as a result of rising inflation or expectations of inflation; instead it has been in spite of significantly falling inflation expectations so far this year. The driver of the outperformance is solely due to the much longer duration of the linker. Its duration is 19 years longer than the nominal 2068 gilt, by virtue of its much lower coupon!
When you buy a corporate bond you don’t just buy exposure to government bond yields, you also buy exposure to credit risk, reflected in the credit spread. The sterling investment grade sector has a duration of almost 10 years, so you are taking exposure to the 10 year gilt, which has a yield today of circa 0.5%. If we divide the yield by the bond’s duration, we get a breakeven yield number, or the yield rise that an investor can tolerate before they would be better off in cash. At the moment, as set out above, the yield rise that an investor in a 10 year gilt (with 9 year’s duration) can tolerate is around 6 basis points (0.5% / 9 years duration). Given that gilt yields are at all-time lows, so is the yield rise an investor can take before they would be better off in cash.
We can perform the same analysis on credit spreads: if the average credit spread for sterling investment grade credit is 200 basis points and the average duration of the market is 10 years, then an investor can tolerate spread widening of 20 basis points before they would be better off in cash. When we combine both of these breakeven figures, we have the yield rise, in basis points, that an investor in the average corporate bond or index can take before they should have been in cash.
With very low gilt yields and credit spreads that are being supported by coming central bank buying, accommodative policy and low defaults, and a benign consumption environment, it is no surprise that corporate bond yield breakevens are at the lowest level we have gathered data for. It is for these same reasons that the typical in-built hedge characteristic of a corporate bond or fund is at such low levels. Traditionally, if the economy is strong then credit spreads tighten whilst government bond yields sell off, such as in 2006 and 2007. And if the economy enters recession, then credit spreads widen and risk free government bond yields rally, such as seen in 2008 and 2009.
With the Bank of England buying gilts and soon to start buying corporate bonds, with the aim of loosening financial conditions and providing a stimulus to the economy as we work through the uncertain Brexit process and outcome, low corporate bond breakevens are to be expected. But with Treasury yields at extreme high levels out of gilts, and with the Fed not buying government bonds or corporate bonds at the moment, my focus is firmly on the attractive relative valuation of the US corporate bond market.
The table below shows a small subset of liquid US corporate bonds, showing the yield change between the 7th and 12th September:-
| Issuer | Issue | Yield | Maturity | Change 7th to 12th | Spread | Rating |
| Home Depot | HD 2.125 9/15/26 c26 | 2.388 | 10y | 0.17 | 0.72 | A2 |
| Toronto Dominion | TD 3.625 9/15/31 c | 3.605 | 15y | 0.04 | 1.93 | A3 |
| Oracle | ORCL 4.000 7/15/46 c46 | 3.927 | 20y | 0.14 | 1.54 | A1 |
| Microsoft | MSFT 3.700 8/8/46 c46 | 3.712 | 20y | 0.13 | 1.32 | Aaa |
| Southern Company | SO 3.950 10/1/46 c46 | 3.973 | 20y | 0.18 | 1.58 | Baa2 |
| Home Depot | HD 3.500 9/15/56 c56 | 3.705 | 20y | 0.19 | 1.31 | A2 |
| US Treasury | US10yr | 1.67 | 10y | 0.13 | N/A | AAA |
| US Treasury | US30y | 2.39 | 30y | 0.16 | N/A | AAA |
Source: Market Axess, Investing.com
Except for Canadian issuer Toronto Dominion, yields moved broadly in tandem with the T-Bond market. The spread between US corporates and T-Bonds may well narrow once the Fed gains a mandate to buy corporate securities, but, should Fed negotiations with Congress prove protracted, the cost of FX hedging may negate much of the benefit for UK or European investors.
What is apparent, is that the “flight to quality” effect is diminished even in the more liquid and higher yielding US market.
The total market capitalisation of the UK corporate bond market is relatively small at £285bln, the US market is around $4.5trln and Europe is between the two at Eur1.5trln. The European Central Bank (ECB) began its Corporate Sector Purchase Programme (CSPP) earlier this summer but delegated the responsibility to the individual National Banks.
Between 8th June and 15th July Europe’s central banks purchased Eur10.43bln across 458 issues. The average position was Eur22.8mln but details of actual holdings are undisclosed. They bought 12 issues of Deutsche Bahn (DBHN) 11 of Telefonica (TEF) and 10 issues of BMW (BMW) but total exposures are unknown. However, as the Bond Vigilantes -Which corporate bonds has the ECB been buying? point out, around 36% of all bonds eligible for the CSPP were trading with negative yields. This was in mid-July, since then 10y Bunds have fallen from -012% to, a stellar, +0.3%, whilst Europe’s central banks have acquired a further Eur6.71bln of corporates in August, taking the mark-to-market total to Eur19.92bln. The chart below shows the breakdown of purchases by country and industry sector at the 18th July:-

Source: M&G Investments, ECB, Bloomberg
Here is the BIS data for total outstanding financial and non-financial debt as at the end of 2015:-
| Country | US$ Blns |
| France | 2053 |
| Spain | 1822 |
| Netherlands | 1635 |
| Germany | 1541 |
| Italy | 1023 |
| Luxembourg | 858 |
| Denmark | 586 |
Source: BIS
In terms of CSPP holdings, Germany appears over-represented, Spain and the Netherlands under-represented. The “devil”, as they say, is in the “detail” – and a detailed breakdown by issuer, issue and size of holding, has not been published. The limited information is certainly insufficient for traders to draw any clear conclusions about which issues to buy or sell. As Wolfgang Bauer, the author of the M&G article, concludes:-
But as tempting as it may be to draw conclusions regarding over- and underweights and thus to anticipate the ECB’s future buying activity, we have to acknowledge that we are simply lacking data. Trying to “front run” the ECB is therefore a highly difficult, if not impossible task.
Conclusions and investment opportunities
Back in May the Wall Street Journal published the table below, showing the change in the portfolio mix required to maintain a 7.5% return between 1995 and 2015:-
Source: Wall Street Journal, Callan Associates
The risk metric they employ is volatility, which in turn is derived from the daily mark-to-market price. Private Equity and Real-Estate come out well on this measure but are demonstrably less liquid. However, this table also misses the point made at the beginning of this letter – that “risk-free” assets are encumbered with much higher “capital” risk in a ZIRP to NIRP world. The lower level of volatility associated with bond markets disguises an asymmetric downside risk in the event of yield “normalisation”.
Dividends
Corporates with strong cash flows and rising earnings are incentivised to issue debt either for investment or to buy back their own stock; thankfully, not all corporates and leveraging their balance sheets. Dividend yields are around the highest they have been this century:-
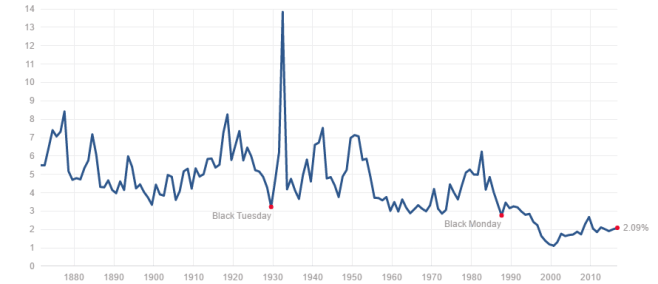
Source: Multpl.com
Meanwhile US Treasury Bond yields hit their lowest ever in July. Below is a sample of just a few higher yielding S&P500 stocks:-
| Stock | Ticker | Price | P/E | Beta | EPS | DPS | Payout Ratio | Yield |
| At&t | T | 39.97 | 17.3 | 0.56 | 2.3 | 1.92 | 83 | 4.72 |
| Target | TGT | 68.94 | 12.8 | 0.35 | 5.4 | 2.4 | 44 | 3.46 |
| Coca-cola | KO | 42.28 | 24.3 | 0.73 | 1.7 | 1.4 | 80 | 3.24 |
| Mcdonalds | MCD | 114.73 | 22.1 | 0.61 | 5.2 | 3.56 | 69 | 3.07 |
| Procter & Gamble | PG | 87.05 | 23.6 | 0.66 | 3.7 | 2.68 | 73 | 3.03 |
| Kimberly-clark | KMB | 122.39 | 22.8 | 0.61 | 5.4 | 3.68 | 68 | 2.98 |
| Pepsico | PEP | 104.59 | 29.5 | 0.61 | 3.6 | 3.01 | 85 | 2.84 |
| Wal-mart Stores | WMT | 71.46 | 15.4 | 0.4 | 4.6 | 2 | 43 | 2.78 |
| Johnson & Johnson | JNJ | 117.61 | 22.1 | 0.43 | 5.3 | 3.2 | 60 | 2.69 |
Source: TopYield.nl
The average beta of the names above is 0.55 – given that the S&P500 has an historic volatility of around 15%, this portfolio would have a volatility of 8.25% and an average dividend yield of 3.2%. This is not a recommendation to buy an equally weighted portfolio of these stocks, merely an observation about the attractiveness of returns from dividends.
Government bonds offer little or no return if held to maturity – it is a traders market. For as long as central banks keep buying, bond prices will be supported, but, since the velocity of the circulation of money keeps falling, central banks are likely to adopt more unconventional policies in an attempt to transmit stimulus to the real economy. If the BoJ, BoE and ECB are any guide, this will lead them (Fed included) to increase purchases of corporate bonds and even common stock.
Bond bear-market?
Predicting the end of the bond bull-market is not my intention, but if central banks should fail in their unconventional attempts at stimulus, or if their mandates are withdrawn, what has gone up the most (government bonds) is likely to fall farthest. At some point, the value of owning “risk-free” assets will reassert itself, but I do not think a 1% rise in yields will be sufficient. High yielding stocks from companies with good dividend cover, low betas and solid cash flows, will weather the coming storm. These stocks may suffer substantial corrections, but their businesses will remain intact. When the bond bubble finally bursts “risky” assets may be safer than conventional wisdom suggests. The breakdown in the “flight to quality” effect is just one more indicator that the rules of engagement are changing.

Macro Letter – No 60 – 02-09-2016
Drowning in debt
I was always
Far out at sea
And not waving
But drowning
Stevie Smith
During August the financial markets have been relatively quiet, however, the Bank of England (BoE) cut interest rates on 4th and added Investment Grade Corporate bonds to their Asset Purchase Programme. The following day Vodafone (VOD) issued a 40yr bond yielding 3% – a week earlier they had issued a 33yr bond yielding 3.4%.
Meanwhile, at Jackson Hole the Kansas City Federal Reserve Symposium discussed a paper by Professor Jeremy Stein – a member Federal Reserve board member between 2012 and 2014 – and two other Harvard professors entitled The Federal Reserve Balance Sheet as a Financial Stability Tool – in which the authors argue that the Fed should maintain its balance sheet at around $4.5trln but that it “should use its balance sheet to lean against private-sector maturity transformation.” In layman’s terms this is a “call to arms” encouraging the Fed to seek approval from the US government to allow the purchase a much wider range of corporate securities. It would appear that the limits of central bank omnipotence have yet to be reached. The Bank of Japan has already begun to discover the unforeseen effect that negative interest rate policy has on the velocity of the circulation of money – it collapses. Now central bankers, who’s credibility has begun to be questioned in some quarters of late, are considering the wider use of “qualitative” measures.
As Bastiat has taught us, that which is seen from these policies is a reduction in the cost of borrowing for “investment grade” corporations. What is not seen, so clearly, is the incentive corporates have to borrow, not to invest, but to buy back their own stock. Perhaps I am being unfair, but, in a world which is drowning in debt, central bankers seem to think that the over-indebted are not “drowning” but “waving”.
One of the most cherished ideas, promulgated upon an unsuspecting world, is the concept of using fiscal and monetary stimulus to offset cyclical economic downturns. The aim of these “popular” policies is to soften the blow of economic slowdowns – all highly laudable provided the “punch bowl” is withdrawn during the cyclical recovery.
So much for business cycles: but what about the impact these policies may have on structural changes in economic performance relating to supply and demand for factors of production, such as labour, fixed assets or basic materials? I’m thinking here about the impact, especially, of technology and demographics.
Firstly, the cyclical stimulus extended during the downturn is seldom withdrawn during the upturn and secondly, long term structural changes in economies are seldom considered by governments, since these changes evolve over decades or generations, rather than the span of a single parliament. This is an essential weakness in the democratic process which has stifled economic growth for centuries. This excellent paper from Carmen M. Reinhart, Vincent R. Reinhart, and Kenneth S. Rogoff – The Journal of Economic Perspectives – Volume 26 – No 3 – Summer 2012 – Public Debt Overhangs: Advanced Economy Episodes Since 1800 makes this weakness abundantly clear.
The authors expand on their earlier research, this time looking at the impact of excessive public debt overhang on economic growth. They take as their “line in the sand” the point where the government debt to nominal GDP ratio remains above 90% for more than five years. They identify 26 episodes, 20 of which lasted more than a decade – the average was 23 years. It is worth noting that more than one third of these episodes occurred without interest rates rising above normal levels.
In 23 of the 26 episodes, over the 211 year sample, the pace of economic growth was lowered from 3.5% to 2.3% – in other words GDP was reduced by roughly one third. The long term secular impact of high debt and lower growth needs to be weighed against the short-term benefits of Keynesian stimulus. A lowering of the GDP growth rate of 1.2% for 23 years is equivalent to a 24.25% reduction in the potential size of the economy at the end of the debt overhang period – a tall price for any economy to pay.
The authors briefly examine the other types of outstanding debt, in order to arrive at what they dub “the quadruple debt overhang problem”, namely, private debt, external debt (and its associated currency risks) and the “actuarial” debt implicit in “unfunded” pension schemes and medical insurance programmes. This data is hard to untangle but the authors state:-
…the overall magnitude of the debt burdens facing the advanced economies as a group is in many dimensions without precedent. The interaction between the different types of debt overhang is extremely complex and poorly understood, but it is surely of great potential importance.
The 22 developed economies in their sample are now burdened with debt to GDP ratios above the levels seen in the aftermath of WWII. Their 48 emerging market counterparts had their epiphany in the debt crisis of the mid 1980’s, since when they have assumed a certain sobriety of character. This shows up even more glaringly in the divergence since 1986 in the public, plus private, external debt. In developed countries it has risen from around 75% of GDP to more than 250% whilst emerging economies external debt has fallen from a broadly similar 75% to less than 50% today. Governments, often bailout private external debt holders in order to protect the stability of their currencies.
Private domestic credit is another measure of total indebtedness which the authors analyse. For the 48 emerging economies this has remained constant at around 40% of GDP since the mid-1980s whilst in the developed 22 it has risen from 50% in the 1950’s to above 150% today. Since the bursting of the technology stock bubble in 2000 this trend has accelerated but the authors point out that these increases are often caused by cross border capital inflows.
The rise in the debt to GDP ratio may come from a slowing in growth rather than an increase in government debt but the correlation between rising debt and slowing GDP rises dramatically as the ratio exceeds 90%.
The authors draw the following conclusions:-
…First, once a public debt overhang has lasted five years, it is likely to last 10 years or much more (unless the debt was caused by a war that ends).
…it is quite possible to have a “no drama” public debt overhang, which doesn’t involve a rise in real interest rates or a financial crisis. Indeed, in 11 of our 26 public debt overhang episodes, real interest rates were on average comparable, or lower, than at other times.
…Another line of reasoning for dismissing concerns about public debt overhangs is the view that causality mostly runs from growth to debt. However, we discussed a body of evidence which argues runs from growth to debt. However, we discussed a body of evidence which argues that causality does indeed run from the public debt overhang to slower growth. There are counterexamples where a public debt overhang was accompanied by rapid growth, like the immediate period after World War II for the United States and United Kingdom, but these exceptions to the typical pattern do not seem to be the most relevant parallels for the modern world economy.
…The pathway to containing and reducing public debt will require a change that is sustained over the middle and the long term. However, the evidence, as we read it, casts doubt on the view that soaring government debt does not matter when markets (and official players, notably central banks) seem willing to absorb it at low interest rates—as is the case for now.
The Methadone of the Markets
The bull market in fixed income securities began in the early 1980’s. The price of “risk free” assets has always had a significant influence on the valuation of equities but, since the advent of quantitative easing, the principle driver of performance has become the level of interest rates. As the yield on fixed income securities has inexorably declined the spread between the dividend and bond yield has returned to positive territory after many years of inversion.
Companies with growing earnings from their operations can finance more cheaply than at any time in history. Provided they can sustain their growth, their bonds should, theoretically, begin to trade at a discount to government bonds. This would probably have happened before now had the central banks not embarked on quantitative easing revolving around the purchase of government bonds at already artificially inflated prices. The rules on capital weighting which favour “risk free” assets and regulations requiring pension funds and other financial institutions to hold minimum levels of “risk free” assets has further distorted the marketplace.
The unfunded government pension schemes of developed nations are at the mercy of the demographic headwind of a smaller working age population supporting a growing legion of retirees. Added to which, breakthroughs in medical science suggest that actuarial expectations of life expectancy may once again be underestimated.
Ways out of debt
There are a number of solutions other than fiscal austerity. For example, increasing the pensionable age steadily towards the average life expectancy. This may sound extreme but in January 1909, when the pension was first introduced in the UK, the pensionable age was 70 years and life expectancy was 50 years for men and 53.5 for women. The latest ONS data shows male life expectancy at 79 years whilst for females it is 82.8 years. The pensionable age for women has now risen to 63 years and will be brought in line with men (65 years) by 2018. There is still a long way to go, by 2030 the NHS estimate the male average will be 85.7 years, with females living an average of 87.6 years. Meanwhile the pensionable age will reach 68 years by 2028. In other words, the current, deeply unpopular, proposed increase in the pensionable age is barely keeping pace with the projected increase in life expectancy.
Another solution which would help to reduce the level of public debt is a structural policy of capping government spending at less than 40% of GDP. This could be relaxed to less than 50% during recessions as a temporary counter-cyclical measure. UK GDP averaged 2.47% since 1953 – if government spending only increased slightly less than 1% per annum we could steadily reduce the public sector debt burden towards a manageable 30% level over the next 40 years, after all, as recently as 2005 the ratio of government debt to GDP was at 38%. The chart below of the Rahn Curve shows the optimal ratio of government debt to GDP. Once government spending exceeds 15% it acts as a drag on the potential growth of an economy:-
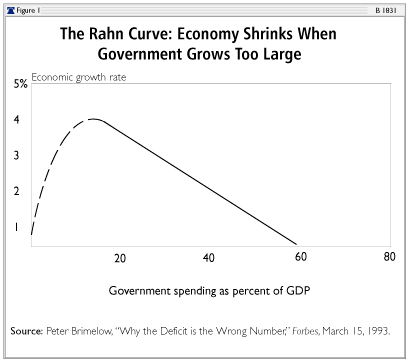
Source: The Heritage Foundation, Peter Brimelow
The interest paid on corporate debt and bank loans is tax deductible which creates an incentive to issue debt rather than equity. It is difficult to change this situation but mandating that equity may only be retired from after-tax profits would encourage leverage for investment purposes rather than to artificially enhance the return on equity. The chart below shows the decline in net domestic investment in the US despite historically low interest rates:-
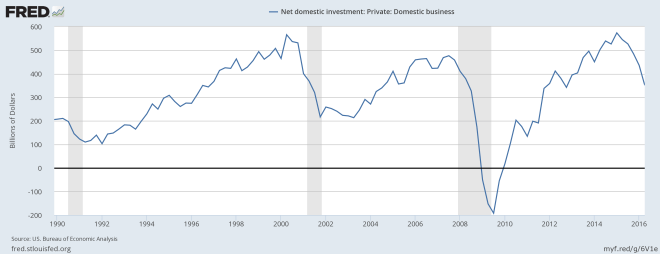
Source: Federal Reserve Bank of St Louis
The next chart shows the level of share buybacks and the performance of the S&P500:-
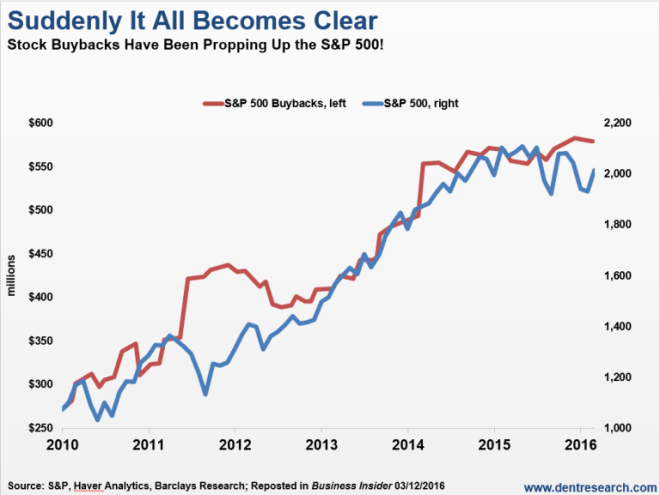
Source: Dent Research, S&P, Haver Analytics, Barclays Research, Business Insider
Household debt is predominantly in the form of mortgages. In most developed countries a shortage of housing stock, due to planning restrictions, has encouraged individuals to speculate in the real estate market. In fact BoE Chief Economist Andy Haldane was quoted in The Sunday Times – Property is a better bet than pensions, says gold-plated Bank guru stating that pensions were complex and housing was a better investment:-
As long as we continue not to build anything like as many houses in this country as we need to … we will see what we’ve had for the better part of a generation, which is house prices relentlessly heading north.
The solution is planning reform. This will reduce house price inflation but it will not reduce the level of mortgage debt, however, once housing ceases to be a “one way bet” the attraction of leveraged speculation in property will diminish.
Conclusions and Investment Opportunities
The underlying problem which caused the great recession of 2009/2010 was excessive debt. The policy response has been to throw petrol on the fire. The first phase of unconventional monetary policy – reducing official interest rates towards zero – has more or less run its course. The next phase – qualitative easing – is now under way. This will start with corporate bonds and proceed to other securities ending up with common stock. Credit spreads will continue to narrow even if government bond yields rise. There will, of course, be episodes of panic when “safe haven” government bonds outperform but this will be temporary and the spread widening will present a buying opportunity.
The UK Investment Grade bond market is relatively small at £285bln and liquidity is therefore less robust than for Euro or US$ denominated issues but there is a £10bln “put” beneath the market. Other initiatives will be forthcoming from the central banks. Their actions will continue to be the dominant factor influencing asset prices in general.

Macro Letter – No 57 – 24-06-2016
Will Japan be the first to test the limits of quantitative easing?
The Japanese stock market peaked in December 1989, marking the end of a period of economic expansion which briefly saw Japan eclipse the USA to become the world’s largest economy. Since its zenith, Japan has struggled. I wrote about this topic, in relation to the economic reform package dubbed Abenomics, in my first Macro Letter – Japan: the coming rise back in December 2013:-
As the US withdrew from Japan the political landscape became dominated by the LDP who were elected in 1955 and remained in power until 1993; they remain the incumbent and most powerful party in the Diet to this day. Under the LDP a virtuous triangle emerged between the Kieretsu (big business) the bureaucracy and the LDP. Brian Reading (Lombard Street Research) wrote an excellent, and impeccably timed, book entitled Japan: The Coming Collapse in 1989. By this time the virtuous triangle had become, what he coined the “Iron Triangle”.
Nearly twenty five years after the publication of Brian’s book, the” Iron Triangle” is weaker but alas unbroken. However, the election of Shinzo Abe, with his plan for competitive devaluation, fiscal stimulus and structural reform has given the electorate hope.
In the last two years Abenomics has delivered some transitory benefits but, as this Japan Forum on International Relations – No. 101: Has Abenomics Lost Its Initial Objective? describes, it may have lost its way:-
The key objective of Abenomics is a departure from 20 year deflation. For this purpose, the Bank of Japan supplied a huge amount of base money to cause inflation, and carried out quantitative and qualitative monetary easing so that consumers and businesses have inflationary mindsets. This “first arrow” of Abenomics was successful to boost corporate profits and raising stock prices by devaluing the exchange rate, but falling oil price makes it unlikely to achieve a 2% inflation rate, despite BOJ Governor Haruhiko Kuroda’s dedicated effort. The quantitative and qualitative monetary easing will not accomplish the core objective.
Another reason for such a huge amount of base money supply is to expand export through currency depreciation and to stimulate economic growth, but that has neither boosted export nor contributed to economic growth. We cannot dismiss world economic downturn, notably in China, but actually, Japanese big companies that lead national export, have shifted their business bases overseas during the last era of strong yen. From this point of view, I suspect that the Japanese government overlooked such structural changes that deterred export growth, even if the yen was devalued. The “second arrow” is flexible fiscal expenditure to support the economy, and the result of which has revealed that it is virtually impossible to keep the promise to the global community to achieve the equilibrium of the primary balance in 2020.
In view of the above changes, I would like to lay my hopes on the “third arrow” of economic growth strategy. The growth strategy has been announced three times up to now, in 2013, 2014, and 2015, respectively. The strategy in 2013 launched three action plans, but they were insufficient. The 2014 strategy was highly evaluated internationally, as it actively involved in the reform of basic nature of the Japanese economy, such as capital market reform, agricultural reform, and labor reform. But it takes ten to twenty years for a structural reform like this to work. Meanwhile, it is quite difficult to understand the growth strategy approved by the cabinet in June 2015. Frankly, this is empty and the quality of it has become even poorer. Abenomics was heavily dependent on monetary policy, and did not tackle long term issues so much, such as social security and regional development. However, people increasingly worry about dire prospects of long term problems like 2 population decrease, aging, and so forth, while the administration responds to such trends with mere slogans like “regional revitalization” and “dynamic engagement of all citizens”. But it is quite unlikely that these “policies” will really revitalize the region, or promote dynamic engagement by the people.
The Bank of Japan (BoJ) has held up its side of the bargain but the “Third Arrow” of structural reform seems to be stuck in the quiver. It is prudent, in light of this policy failure, for the BoJ to look ahead to the time when they are required by the government or forced by the markets, to unwind QQE. Last month they began that process.
As this article from the Nikkei Asian Review – BOJ seen preparing for exit from easing with reserves explains, the BoJ has made a provision of JPY 450bln for the year ending March 2016 against potential capital losses which might be incurred upon liquidation of their JGB holdings. This is the first provision of its kind and substantially reduces the percentage of seigniorage profits remitted to the Japanese government. The level of remittances has been falling –from JPY 757bln in 2014 to JPY 425bln last year. As at the end of May 2016 the BoJ held JPY 319.5trln of JGBs – 36.6% of outstanding issuance. Japan Macro Advisors estimate this will reach 49.3% by the end of 2017. This year’s provision, whilst prudent, is a drop in the ocean. Under the current Quantitative and Qualitative Easing (QQE) programme they are obligated to purchase JPY 80tln per annum. The Association of Japanese Institutes of Strategic Studies – The Fiscal Costs of Unconventional Monetary Policy put it like this:-
It is quite likely that quantitative easing through high-volume purchases of long-term bonds will cause the Bank of Japan enormous losses over the medium to long term, imposing burdens on taxpayers both directly and indirectly. If the current quantitative easing continues, the Bank of Japan may find itself in the near future unable to cover such losses even using all of its seigniorage profits.
…The BoJ’s seigniorage will be roughly equivalent in present value to the balance of banknotes issued. If the BoJ procures funds by issuing cash at a zero interest rate and purchases JGBs, the present discounted value of the principal and interest earned by the BoJ from its JGBs will equal the balance of banknotes. If interest rates are about 2%, Japan’s demand for banknotes will fall from 19% of GDP at present to less than 10% of GDP, and the BoJ’s aforementioned losses would even exceed the present value of its seigniorage.
Here is an extract from the BoJ’s 16th June Statement on Monetary Policy the emphasis is mine:-
Quantity Dimension: The guideline for money market operations
The Bank decided, by an 8-1 majority vote, to set the following guideline for money market operations for the intermeeting period:[Note 1]
The Bank of Japan will conduct money market operations so that the monetary base will increase at an annual pace of about 80 trillion yen.
Quality Dimension: The guidelines for asset purchases
With regard to the asset purchases, the Bank decided, by an 8-1 majority vote, to set the following guidelines:[Note 1]
a) The Bank will purchase Japanese government bonds (JGBs) so that their amount outstanding will increase at an annual pace of about 80 trillion yen. With a view to encouraging a decline in interest rates across the entire yield curve, the Bank will conduct purchases in a flexible manner in accordance with financial market conditions. The average remaining maturity of the Bank’s JGB purchases will be about 7-12 years.
b) The Bank will purchase exchange-traded funds (ETFs) and Japan real estate investment trusts (J-REITs) so that their amounts outstanding will increase at annual paces of about 3.3 trillion yen1 and about 90 billion yen, respectively.
c) As for CP and corporate bonds, the Bank will maintain their amounts outstanding at about 2.2 trillion yen and about 3.2 trillion yen, respectively.
Interest-Rate Dimension: The policy rate
The Bank decided, by a 7-2 majority vote, to continue applying a negative interest rate of minus 0.1 percent to the Policy-Rate Balances in current accounts held by financial institutions at the Bank.[Note 2]
[Note 1] Voting for the action: Mr. H. Kuroda, Mr. K. Iwata, Mr. H. Nakaso, Mr. K. Ishida, Mr. T. Sato, Mr. Y. Harada, Mr. Y. Funo, and Mr. M. Sakurai. Voting against the action: Mr. T. Kiuchi. Mr. T. Kiuchi proposed that the Bank conduct money market operations and asset purchases so that the monetary base and the amount outstanding of its JGB holdings increase at an annual pace of about 45 trillion yen, respectively. The proposal was defeated by a majority vote.
[Note 2] Voting for the action: Mr. H. Kuroda, Mr. K. Iwata, Mr. H. Nakaso, Mr. K. Ishida, Mr. Y. Harada, Mr. Y. Funo, and Mr. M. Sakurai. Voting against the action: Mr. T. Sato and Mr. T. Kiuchi. Mr. T. Sato and Mr. T. Kiuchi dissented considering that an interest rate of 0.1 percent should be applied to current account balances excluding the amount outstanding of the required reserves held by financial institutions at the Bank, because negative interest rates would impair the functioning of financial markets and financial intermediation as well as the stability of the JGB market.
The decision by the BoJ not to increase QQE at its last two meetings has surprised the markets and lead to a further strengthening of the JPY. Governor Kuroda, gave a speech Keio University on June 20th – Overcoming Deflation: Theory and Practice in which he described the history of BoJ policy in its attempts to stimulate the Japanese economy:-
As mentioned, the aim of QQE is to overcome the prolonged deflation that has gripped Japan. Even if this deflation has been mild, the fact that it has continued for more than 15 years means that its cumulative costs have been extremely large. Looked at in terms of the price level, an annual inflation rate of minus 0.3 percent over a period of 15 years implies that the price level will fall by around 5 percent, but an annual inflation rate of 2 percent over a period of 15 years means that the price level will rise by around 35 percent.
It is worth noting that the UK and USA was subject to a long period of deflation during the “Great Depression” between 1873 and 1896 (approximately -2% per annum) by this comparison Japan’s experience has been very mild indeed. The BoJ has a 2% inflation target, however, so we should anticipate more QQE. Kuroda-san, who has previously stated that the effect of NIRP will take time to feed through and that NIRP may be increased from -0.1% to -0.5%, gave no indication as to what the BoJ may do next; although he did say that Japan provides an interesting case study for academia.
On June 8th Professor George Selgin delivered the Annual IEA Hayek Memorial Lecture – Price Stability and Financial Stability without Central Banks – lessons from the past for the future in which he discussed good and bad deflation together with “Free Banking” – the concept of financial stability without central banks (if you have 45 minutes and enjoy economic history, the whole speech it is well worthwhile). With regard to the current situation in Japan – and elsewhere – he highlights the different between good deflation which is driven by supply expansion and bad deflation which is the result of demand shrinkage. Selgin also goes on to allude to Hayek’s view that that stability of spending should be the objective of monetary policy rather than the stability of prices – akin to what Market Monetarists dub the stability of monetary velocity.
Japan’s monetary base has expanded by 170% since March 2013 but at the same time the money multiplier – Money Stock/BoJ Monetary Base – has declined from 8.27 times (April 2013) to 3.35 times (March 2016). Lending market growth was at its weakest for three years in March (+2%) principally due to household hoarding.

Source: Bloomberg, BoJ
Since the announcement of Negative Interest Rate Policy (NIRP) in January the sale of safes for domestic residences has increased dramatically. Whilst I have not found evidence from Japan, this article from Bloomberg – Cash in Vaults Tested by Munich Re Amid ECB’s Negative Rates reports that MunichRE – the world’s second largest reinsurer – is setting a worrying precedent, it’s one thing when individuals hoard paper money but, when financial institutions follow suit, monetary velocity is liable to plummet. I suspect institutions in Switzerland and Japan are also assessing the merits of stuffing their proverbial mattresses with fiat money.
The chart below reveals that declining monetary velocity is not exclusively a Japanese phenomenon:-

Source: CLSA, CEIC
The Yotai Gap – the difference between bank deposits and loans – is another measure of household hoarding. It widened to JPY 207.6trln in March, close to its record high of JPY 209.9trln in May 2015. The unintended consequences of NIRP is an increase in demand for paper money and a reduction of demand for retail loans even as interest rates decline.
Japanese industry looks little better than the household sector, as this excellent article from Alhambra Investment Partners – It’s Not Stupidity, It Is Apathy (For Now) explains:-
Japanese industry has not gained anything for the surrender of Japanese households, with industrial production falling 3.5% in April, the 18th time in the past the 22 months. IP in April 2016 was slightly less than the production level in April 2013 when QQE began. Worse, IP is still 3.4% below April 2012, which further suggests both continued economic decline and a distinct lack of any effect from all the “stimulus.”
Barron’s – Unintended Consequences of NIRP listed the following additional effects:-
1) compress net interest margins and bank profits;
2) damage consumer and business confidence;
3) provide little incentive for business invest in capital rather than buy back stock;
4) hurt savers;
5) makes active management more difficult by dampening dispersion;
6) increase demand for gold and other hard assets; and,
7) likely widen the wealth gap
The BoJ can continue to buy JGBs, Commercial Paper, Corporate Bonds, ETFs and, once these avenues have been exhausted, move on to the purchase of common stocks and commercial loans. It can nationalise the stock market and circumvent the banking system in order to provide liquidity to end users or even consumers. At what point will the markets realise that they have been pushing on a string for decades? I suspect, not yet, but a dénouement, an epiphany, draws near.
Markets since the announcement of NIRP
Since the BoJ NIRP announcement at the end of January, the JPY has strengthened by around 14%. The five year chart below shows the degree to which the hopes for the first arrow of Abenomics have been dashed:-

Source: Trading Economics
Currency weakness has put pressure on stocks. International investors sold around JPY 5trln during in a 13 week selling binge to the beginning of April:-

Source: Trading Economics
The Government Pension Investment Fund (GPIF) and other domestic institutions took up the slack – the GPIF has moved from 12% to 23% equities since October 2014 – here is the 31st December breakdown of the asset mix for the JPY 140trln fund:-
| 31-12-15 % Allocation | Policy Target | Permitted Deviation | |
| Domestic Bonds | 37.76 | 35 | 10 |
| Domestic Equity | 23.35 | 25 | 9 |
| International Bonds | 13.5 | 15 | 4 |
| International Equities | 22.82 | 25 | 8 |
| Short term assets | 2.57 |
Source: GPIF
In theory the GPIF could buy another JPY 15.5trln of domestic stocks and reduce its holdings of JGBs by nearly JPY 18trln. I expect other Japanese pension funds and Trust Banks to follow the lead of the GPIF. Domestic demand for stocks is likely to continue.
As I mentioned earlier, JGBs are being steadily accumulated by the BoJ even as the GPIF and other institutions switch to equities. This is the five year yield chart for the 10 year maturity:-
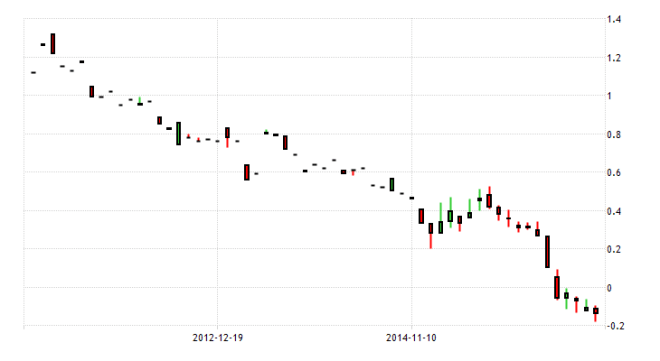
Source: Trading Economics
JGBs made new all-time lows earlier this month, with maturities out as far as 15 years turning negative, amid international concerns about the potential impact of Brexit.
Looking more closely at Japanese stocks, non-financial corporations have followed the lead of the eponymous Mrs Watanabe, accumulating an historically high cash pile. Barron’s – Abenomics Watch: Japan’s Corporates Are Hoarding Cash, Too takes up the story:-
During the three years of Abenomics between 2013 and 2015, Japan’s non-financial corporate sector increased its holding of cash and deposits by roughly 30 trillion yen, or 6% of GDP. This amount is equivalent to about 35% of retained earnings, estimates Credit Suisse.
This amount is high by historical standards. During the previous economic upswing between the end of 2002 and the beginning of 2008, Japan’s corporations held only 11.5% of their retained earnings.
So why are Japanese companies hoarding cash?
One explanation is larger intangible assets. It is easy for companies to put up their fixed assets as collateral for loans, but how should banks value intangible assets such as intellectual property? Cash would be a viable collateral option. However, Credit Suisse finds that there is not much correlation between cash and intangible asset positions. The ratio of cash to intangible fixed assets investments has moved broadly between 8.6 years and 11.6 years over the two decades since 1994.
A second explanation is lax corporate governance, which Abe has been trying to fix. Are Japanese companies only paying him lip service?
A third explanation is increasing pension liabilities. As Japanese society ages, companies feel compelled to hoard more cash to pay off employees who are due to retire in the coming years. Encouraging women to enter the labor force is a key component of Abenomics’ Third Arrow. He has not gone very far.
Last, perhaps Japanese companies are feeling uncertain about the future? Toyota Motor, for instance, drastically changed its yen assumption from 120 to 105 in the new fiscal year. Companies hoard more cash when they don’t know what’s going to happen.
According to the latest flow of funds data from the BoJ – corporate cash was estimated to be JPY 246trln in Q1 2016 – the 29th consecutive quarterly increase, whilst household assets rose to JPY 902trln the highest on record and the 36th quarterly increase in a row. A nine year trend.
Another trend which has been evident in Japan – and elsewhere – is an increase in share buybacks. The chart below tells the story since 2012:-

Source: FT, Goldman Sachs
Compared to the level of share buy backs seen in the US, Japanese activity is minimal, nonetheless the trend is growing and NIRP must assume some responsibility. Perhaps it was the precipitous decline in capital expenditure, which prompted the BoJ to introduce NIRP. The chart below is taken from the December 2015 Tankan report:-
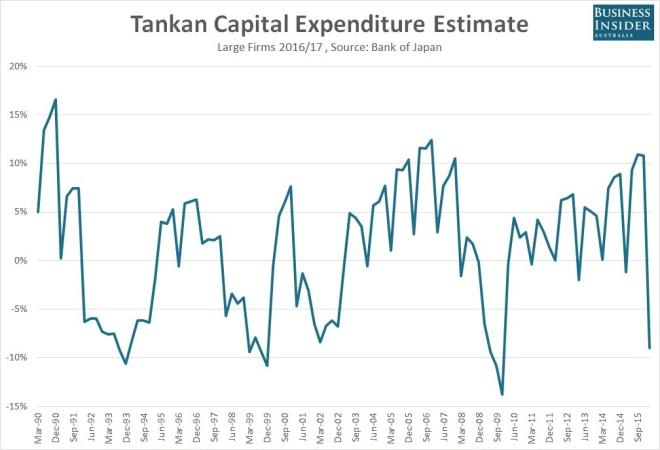
Source: Business Insider Australia, BoJ
In the March 2016 Tankan, the Business Conditions Diffusion Index remained generally positive but the decline of momentum is of concern:-
| Dec-15 | Mar-16 | June-16(F/C) | |
| Large | |||
| Manufacturers | 12 | 6 | 3 |
| Non-Manufacturers | 25 | 22 | 17 |
| Medium | |||
| Manufacturers | 5 | 5 | -2 |
| Non-Manufacturers | 19 | 17 | 9 |
Source; BoJ
I doubt capital expenditure will rebound while share buy backs appear safer to the executive officers of these companies. The Japanese stock market is also attractive by several valuation metrics. The table below compares the seven most liquid stock markets, as at 31st March, is sorted by the yield premium to 10 year government bonds (DY-10y):-
| Country | CAPE | PE | PC | PB | PS | DY | 10y | DY-10y |
| Switzerland | 20.3 | 22.5 | 13.9 | 2.3 | 1.8 | 3.50% | -0.33% | 3.83% |
| France | 16 | 20.9 | 6.5 | 1.5 | 0.8 | 3.50% | 0.41% | 3.09% |
| Germany | 16.8 | 19 | 8 | 1.6 | 0.7 | 2.90% | 0.15% | 2.75% |
| United Kingdom | 12.7 | 35.4 | 12.8 | 1.8 | 1.1 | 4.00% | 1.42% | 2.58% |
| Italy | 11.1 | 31.5 | 5 | 1.1 | 0.5 | 3.50% | 1.23% | 2.27% |
| Japan | 22.7 | 15.3 | 7.9 | 1.1 | 0.7 | 2.20% | -0.04% | 2.24% |
| United States | 24.6 | 19.9 | 11.6 | 2.8 | 1.8 | 2.10% | 1.77% | 0.33% |
Source: StarCapital.de, Investing.com
For international allocators, the strength of the JPY has been a significant cushion this year, but, for the domestic investor, the Nikkei 225 is down 16.2% YTD. Technically the market is consolidating around the support region between 16,300 and 13,900. If it breaks lower we may see a return towards to 10,000 – 11,000 area. If it recovers, a push through 18,000 should see the market retest its highs. I believe the downside is supported by domestic demand for stocks as bond yields turn increasingly negative.
International investors will remain wary of the risks associated with the currency. Further BoJ largesse must be anticipated; that they have made a first provision against losses from the unwinding of QQE is but a warning shot across the bows of the ministry of finance. As I suggested in Macro Letter – No 49 – 12-02-2016 Why did Japanese NIRP cause such surprise in the currency market and is it more dangerous? a currency hedged equity investment is worth considering. Prime Minister Abe, who began campaigning, this week, for the upper house elections on July 10th, has promised to boost the economy if he wins a majority of the 121 seats being contested. The monetary experiment looks set to continue but the BoJ may be the first central bank to discover the limits of largesse.

Macro Letter – No 25 – 05-12-2014
Will the Nikkei breakout or fail and follow the Yen lower?
The Nikkei 225 index is making new highs for the year as the JPY trends lower following a further round of aggressive quantitative and qualitative easing (QQE) from the Bank of Japan (BoJ). The Japanese Effective Exchange Rate has fallen further which should help to improve Japan’s export competitiveness whilst import price inflation should help the BoJ achieve its inflation target.
Net Assets
For several decades Japan has been a major international investor, buying US Treasury bonds, German bunds, UK Gilts as well as a plethora of other securities around the globe. Japan has also been a source of substantial direct investment, especially throughout the Asian region. May 2014 saw the release of a research paper by the BoJ -Japan’s International Investment Position at Year-End 2013 – the authors observed:-
Direct investment (assets: 117.7 trillion yen; liabilities: 18.0 trillion yen)
Outward direct investment (assets) increased by 27.9 trillion yen or 31.1 percent. Inward direct investment (liabilities) remained more or less unchanged.
Portfolio investment (assets: 359.2 trillion yen; liabilities: 251.9 trillion yen)
Outward portfolio investment (assets) increased by 54.1 trillion yen or 17.7 percent. Inward portfolio investment (liabilities) increased by 71.4 trillion yen or 39.5 percent.
Financial derivatives (assets: 8.2 trillion yen; liabilities: 8.7 trillion yen)
Financial derivatives assets increased by 3.6 trillion yen or 77.5 percent. Financial derivatives liabilities increased by 3.3 trillion yen or 62.5 percent.
Other investment (assets: 178.4 trillion yen; liabilities: 193.6 trillion yen)
Other investment assets increased by 25.5 trillion yen or 16.7 percent. Other investment liabilities increased by 31.6 trillion yen or 19.5 percent.
Reserve assets (assets: 133.5 trillion yen)
Reserve assets increased by 24.1 trillion yen or 22.0 percent.
The chart below shows how Japan continues to accumulate foreign assets despite their balance of payments moving from surplus to deficit:-
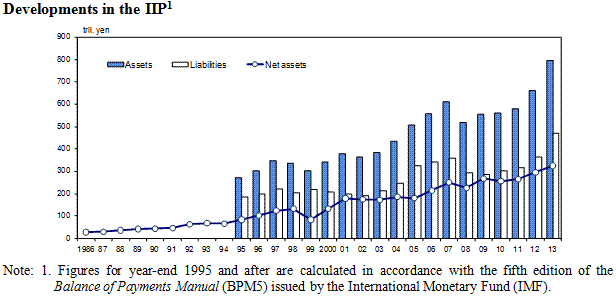
Source:BoJ
From the mid 1980’s until the aftermath of the bursting of the 1990’s technology bubble, international investment was one of the principle methods by which Japanese firms attempted to remain competitive in the international market whilst the JPY appreciated against its main trading partners.
The Japanese Effective Exchange Rate chart below shows how the JPY has weakened since the initial flight to safety after the bursting of the “Tech Bubble” and again after the flight to quality during the “Great Recession”. This currency weakness was accelerated by the introduction of Prime Minister Abe’s “Three Arrows” economic policy:-
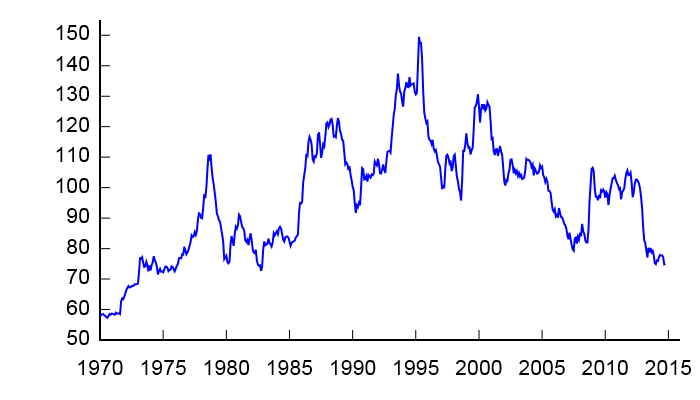
Source: BIS
We are now back to levels last seen before the Plaza Accord of 1985 – after which the JPYUSD rate rose from 250 to 130.
Whilst Japan’s foreign investments returns should remain positive – especially due to the falling value of the JPY – Japanese saving rates continue to decline, just as negative demographic forces are pushing at the door. The stock-market bubble, which burst in 1990, was most excessive in the Real-Estate and Finance sectors. With housing demand expected to decline, for demographic reasons, and financial firms now representing less than 4% of the Nikkei 225 these sectors of the domestic economy are likely to remain moribund. The chart below shows the evolution of Japanese house prices from 1980 to 2008:-
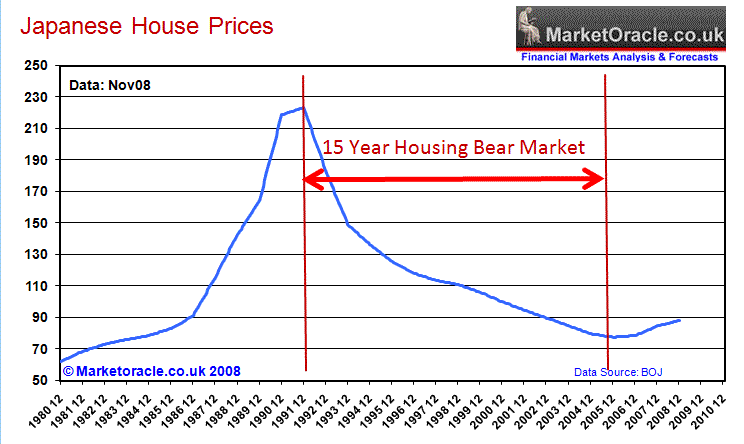
Source: Market Oracle
After the slight up-tick between 2005 and 2008 house prices have resumed their downward course despite increasingly lower interest rates.
What Third Arrow?
In order to get the Japanese economy back on track, fiscal stimulus has been the government solution since 1999, if not before. Shinzo Abe won a second term as Prime Minister with a set of economic policies known as “The Three Arrows” – a cocktail of QQE from the BoJ, JPY devaluation and structural reform. The Third Arrow of “Abenomics” is structural reform. This type of reform is always politically difficult. With this in mind Abe has called an election for the 14th December – perhaps prompted by the release of Q3 GDP data (-1.6%) confirming that, after two consecutive negative numbers, Japan is officially back in recession. He hopes to win a third term and fulfil his mandate to make the sweeping changes he believes are required to turn Japan around.
Energy reform is high on Abe’s agenda. Reopening nuclear reactors is a short term fix but he plans to make the industry more dynamic and spur innovation. In a recent interview with CFR – A Conversation With Shinzo Abe – the Prime Minister elaborated on his plan:-
…On the other hand, we wish to be the front-runner in the energy revolution, ahead of others in the world. I would like to implement the hydrogen-based society in Japan.
The development of fuel cells started something like 30 years ago as a national project. Last year, I have reformed the regulations that inhibited the commercialization of the fuel cell vehicle. And at last, a first ever in the world, we have implemented the commercialization of hydrogen station and fuel cell vehicles.
Early next year, in the store windows of automotive dealers, you’ll be able to see the line up of fuel cell cars.
In the power sector, we shall put an end to the local monopoly of power, which continued for 60 years after the war. We will be creating a dynamic and free energy market where innovation blossoms.
He then went on to discuss his ideas for reform of corporate governance:-
Companies will have to change as well. I will create an environment where you will find it easy to invest in Japanese companies. Corporate governance is the top agenda of my reform list. This summer, I have revised the company law on the question of establishment of outside directors. I have introduced the rule called “comply or explain.”
Amongst listed companies in the last one year, the number of companies which opted to have outside directors increased by 12 percent. Now, 74 percent.
Tax reform is another aspect of Abe’s package. In the past year, corporate tax rates have been cut by 2.4%. Another term in office might give Abe time to make a difference, but his ill-conceived decision to increase the sales tax earlier this year had a disastrous impact on GDP – Q2 GDP was -7.1%. A further increase from 5% to 8% was scheduled for October 2015 but has now been postponed until April 2017 – as a palliative to the “deficit hawks” the increase will be from 5% to 10%. Whilst this was a relief for the stock market it led to a further weakening of the JPY. Last week, Moody’s downgraded Japanese debt due to their concerns about the government’s ability to control the size of its deficit.
The Association of Japanese Institutes of Strategic Studies – Tax System Reform Compatible with Fiscal Soundness – makes some interesting suggestions in response to the looming problem of lower tax receipts: –
Given Japan’s challenging fiscal circumstances, broadening the tax base while lowering corporate tax rates seems a realistic compromise to head off a decline in corporate tax revenues. However, simply lowering corporate tax rates on the condition that corporate tax revenues be maintained is of limited effectiveness in stimulating the economy. If the emphasis is to be placed on the benefits of this approach for economic revitalization, then corporate tax rates will need to be drastically lowered and the rates for consumption tax and other taxes raised. Steps will also need to be taken to reform the tax system overall rather than just to secure revenues by increasing consumption taxes. Although the weight of the tax burden will inevitably shift toward consumption tax, the tax base must also be expanded through income tax reform to secure tax revenues. An obvious choice is reconsidering the spousal deduction that gives tax benefits to full-time housewives so that the tax system can be made neutral vis-a-vis the social advancement of women. A major premise in tax increases is ensuring efficiency and fairness in fiscal matters. If the public can be persuaded that tax money is being put to good use, high consumption tax rates such as those in Scandinavia will enjoy public support. A taxpayer number system should be promptly introduced and an efficient and fair tax collection environment put into place.
Japan’s government debt to GPD is currently the highest among developed nations at 227%, however, according to Forbes – Forget Debt As A Percent Of GDP, It’s Really Much Worse – as a percentage of tax revenue debt is running around 900%, far ahead of any other developed nation.
Labour market reform is high on Abe’s wish list, in particular, the roll-out of incentives to encourage Japanese women to enter the labour market. This would go a long way towards offsetting the demographic impact of an ageing population. It has the added attraction of not relying on immigration; an perennial issue for Japan for cultural and linguistic reasons:-
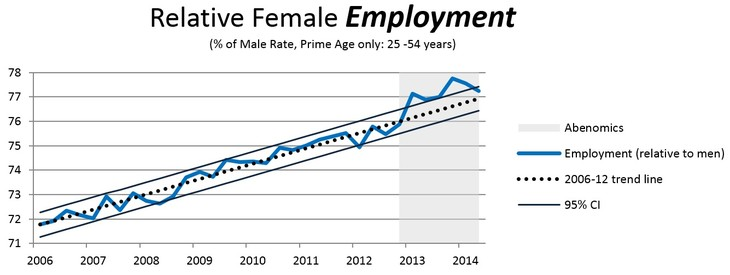
Source: OECD Bruegal
Agricultural reform is also an agenda item. It could significantly improve Japan’s competitiveness and forms a substantial part of the Trans-Pacific Partnership (TPP) negotiations which have been taking place between Japan, USA and 11 other Asian countries during the past two years. Sadly the free-trade agreement has stalled, principally, due to Japanese reluctance to embrace agricultural reform. The Peterson Institute – Will Japan Bet the Farm on Agricultural Protectionism? – takes up the story: –
What is at stake? The gains for Japan from entry into the TPP are substantial, more than what nearly any other member of the agreement would reap. Peter A. Petri, visiting fellow at the Peterson Institute for International Economics, estimates that the agreement would add 2 percent to Japan’s GDP by 2025. More broadly, the TPP represents an opportunity for Japan to reinvigorate its unproductive domestic industries (agriculture included) by permitting greater foreign competition. It would also enable Japan to reassert itself as a leader and a model in the Asia Pacific. Facing an uncertain future with China gaining influence in the region, Japan needs to remain strong and dynamic at home, economically enabling it to leverage its technical and market-size advantages to secure its position in the region. These gains are now in jeopardy largely because of Japan’s agricultural protectionism.
How protectionist is Japan? To be fair, Japan has made progress on lowering support for agriculture since the 1980s. The United States—the primary objector to the protection afforded to Japan’s agricultural sector—also still provides support for its own agriculture sector. However, the magnitudes are starkly different. For every dollar of agriculture production, Japan provides 56 cents of subsidies to farmers. The United States and European Union provide just 7 cents and 20 cents for every dollar, respectively. Additionally, Japan spends nearly 1.25 percent of its GDP on agriculture subsidies (which includes support for producers, as well as consumers). The United States and European Union spend 1 percent and 0.7 percent, respectively. There are also many internal barriers, such as restrictions on the sale and use of farm land and preferential tax structures for farmers, which discourage older generations from leaving or corporate farms from entering the farming sector in many areas.
The political importance of the rural vote may have caused Abe to backtrack on his timetable for reform. This is another example of how important the forthcoming election will be both for the Japanese economy and its stock market.
Kuroda and GPIF to the rescue (again)
On October 31st the BoJ announced an increase in its stimulus package from JPY60trln per month to JPY80trln. On the same day the Government Pension Investment Fund (GPIF) which, with $1.2 trln in assets, is the world’s largest, announced that it planned to reduce its holding of government bonds to 35% from the current 60%, this money will be reallocated equally between domestic and international equity markets. That’s $150bln waiting to be allocated to Japanese equities. The BoJ also announced an increase in their ETF purchase programme, but this pales into insignificance beside the GPIF action.
Writing back in January 2013, Adam Posen of the Peterson Institute – Japan should rethink its stimulus – gave four main reasons why Japan has been able to continue with its expansionary fiscal policy: –
Japan was able to get away with such unremittingly high deficits without an overt crisis for four reasons. First, Japan’s banks were induced to buy huge amounts of government bonds on a recurrent basis. Second, Japan’s households accepted the persistently low returns on their savings caused by such bank purchases. Third, market pressures were limited by the combination of few foreign holders of JGBs (less than 8 percent of the total) and the threat that the Bank of Japan (BoJ) could purchase unwanted bonds. Fourth, the share of taxation and government spending in total Japanese income was low.
Last month saw the release of a working paper from Peterson – Sustainability of Public Debt in the United States and Japan – which contemplates where current policy in the US and Japan may lead, it concludes:-
The implication of these projections is that even for just a 10-year horizon, somewhat more effort will be required to keep the debt-to-GDP ratio from escalating in the United States, and much more will need to be done in Japan. Using the probability-weighted ratio of net debt to GDP (federal debt held by the public for the United States), holding the ratio flat at its 2013 level would require cutting the 2024 debt ratio by 8 percentage points of GDP for the United States and by 32 percentage points of GDP for Japan. In broad terms achieving this outcome would involve reducing the average primary deficit by about 0.75 percent of GDP from the baseline in the United States and by about 3 percent of GDP in Japan.
The Japanese economy is now entirely addicted to government fiscal stimulus, reducing the primary deficit by 3% and maintaining that discipline for a decade is unrealistic.
I’m indebted to Gavyn Davies of Fulcrum Asset Management for this chart which puts the BoJ current QQE policy in perspective: –
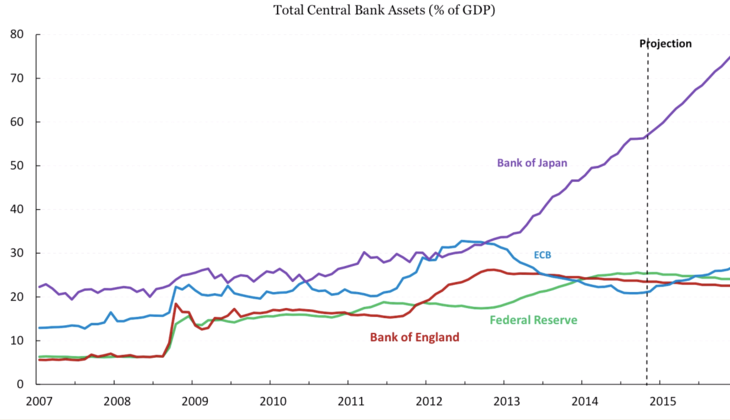
Source: Fulcrum
Whither the Nikkei 225?
With the JPY continuing to fall in response to QQE and the other government policy decisions of the last two months, the Nikkei has rallied strongly; here is a 10 year chart:-

Source: Nikkei
The long-term chart below, which ends just after the 2009 low, shows a rather different picture:-

Source: The Big Picture and The Chart Store
From a technical perspective, recent stock market strength has taken the Nikkei above long-term downtrend. Confirmation will be seen if the market can break above 18,300 – the level last reached in July 2007. A break above 22,750 – the June 1996 high – would suggest a new bull market was commencing. I am doubtful about the ability of the market to sustain this momentum without a recovery in the underlying economy – which I believe can only be achieved by way of government debt reduction. Without real reform this will be another false dawn.
The chart below shows the Real Effective Exchange Rate for a number of economies. The JPY on this basis still looks expensive however the impact of a falling JPY vs KRW or RMB will be felt in rising political tension and potentially a currency war:-

Source: BIS
Japan can play the “devaluation game” for a while longer, after all, a number of its Asian trading partners devalued last year, but the long-run implications of a weaker JPY will be seen in protectionist policies which undermine the principles of free trade.
Conclusions and investment opportunities
JPYUSD
The Japanese currency will continue to weaken versus the US$. This chart from the St Louis Fed, which only goes up to 2012, shows how far the JPY has appreciated since the breakdown of the Bretton Woods agreement:-
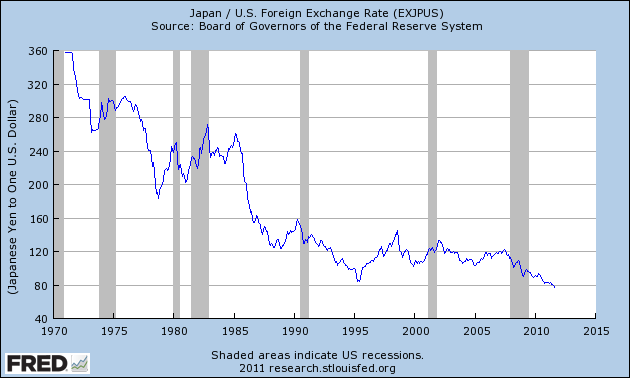
Source: Federal Reserve
I think, in the next two to three years, JPYUSD 160 is to be expected and maybe even a return to JPYUSD 240.
JGBs
The BoJ currently owns around 24% of outstanding JGBs but this is growing by the month. Assuming government spending remains at its current level the BoJ will hold an additional 7% of outstanding supply by the end of next year. By 2018 they could own more than 50% of the market. In order to encourage longer-term investment – or, perhaps, merely in search of better yields – the BoJ has extended the duration of their purchases out to 40 year maturities. The latest BoJ data is here.
Central bank buying will support the JGB market as the GPIF switch their holdings into domestic and international stocks. . International ownership remains extremely low so adverse currency movements will have little impact on this decidedly domestic market. With 10 year yields around 0.45%, I see little long-term value in holding these bonds when the BoJ inflation target is at 2% – they are strictly for trading.
Nikkei 225
The Nikkei is heavily weighted towards Technology stocks (43%) and on this basis the market still appears relatively cheap, it also looks cheap on the basis of the P/E ratio, the chart below shows the P/E over the past five years:-

Source: TSE and vectorgrader.com
Here for comparison is the Price to Book ratio, this time over 10 years:-

Source: TSE and vectorgrader.com
Neither metric indicates that the current valuation of the Nikkei is excessive, but, given the frail state of the economy, I suspect Japanese stocks are inherently vulnerable.
Over the next year the Nikkei will probably push higher, helped by buying from the GPIF and international investors, many of whom are still under-weight Japan. A break above 18,300 would suggest a move to test the April 2000 high at 20,833, but a break above the June 1996 high at 22,757 is required to confirm the beginning of a new bull market. In the current economic environment I think this will be difficult to achieve. There are trading opportunities but from a longer-term investment perspective I remain neutral.

.
.
.
Macro Letter – No 1 – 6-12-2013
Welcome to my first blog. Those of you who have followed my commentary previously will be used to the eclectic mix of subjects I tend to write about. In my new blog I aim to expand on that reportage service by adding my own, more market centric, opinions.
Japan – The Coming Rise?
On the 4th December Bank of Japan (BoJ) board member Takehiro Sato gave an interesting speech on the prospects for the Japanese economy: –
http://www.boj.or.jp/en/announcements/press/koen_2013/data/ko131204a1.pdf
Japan’s economy has been recovering moderately. While it will be affected by the two scheduled consumption tax hikes, the economy is likely to continue growing at a pace above its potential, as a trend, on the assumption that the global economy will follow a moderate growth path…
… The growth rate for fiscal 2014 is likely to dip temporarily in the April-June quarter due to a decline in demand subsequent to the front-loaded increase in the previous quarters. However, I do not expect an economic downturn such as what we experienced at the time of the previous consumption tax hike in 1997. This is because the current economic situation differs in some aspects from that of the previous tax hike. Specifically, (1) the government is preparing an economic package with a total size of about 5 trillion yen; (2) emerging economies, some of which suffered from simultaneous declines in stock prices, bond prices, and in the value of their currencies this year, are becoming resilient to negative shocks compared to 1997, when the Asian currency crisis occurred, due to the establishment of backstops such as the accumulation of foreign reserves; and (3) Japan’s financial system has been stable as a whole.
Sato went on to predict above trend growth in 2014 H2. I think the majority of this information is priced into the market already.
 .
.
.
.
Source: Barchart.com
 .
.
.
.
Source: Big Charts
Despite the sharp correction since Tuesday,during the last few weeks the Japanese Yen (JPY) has begun a renewed decline (see weekly chart above). Earlier this year short JPY and long Nikkei futures (see daily chart above) proved to be an excellent trading opportunity. The election of Shinzo Abe (LDP) as the 90th Prime Minister in December 2012, with his “Three Arrows” policy, spelt hope for an economy which had been moribund, in GDP growth terms, for more than a decade. However, the present Japan story really begins on 25th April 1949 when the JPY was fixed against the US$ at a rate of JPY360 – this fixed rate remained in tact until the collapse of the Bretton Woods agreement in 1971. In the aftermath of WWII Japan, like Germany, took advantage of, what proved to be, a relatively low rate of exchange to rebuild their shattered economy. In the case of Japan one of the societal responses to the end of WWII was to encourage a nation of savers and investors.
As the US withdrew from Japan the political landscape became dominated by the LDP who were elected in 1955 and remained in power until 1993; they remain the incumbent and most powerful party in the Diet to this day. Under the LDP a virtuous triangle emerged between the Kieretsu (big business) the bureaucracy and the LDP. Brian Reading (Lombard Street Research) wrote an excellent, and impeccably timed, book entitled Japan: The Coming Collapse in 1989. By this time the virtuous triangle had become, what he coined the “Iron Triangle”.
Nearly twenty five years after the publication of Brian’s book, the” Iron Triangle” is weaker but alas unbroken. However, the election of Shinzo Abe, with his plan for competitive devaluation, fiscal stimulus and structural reform has given the electorate hope. Abe’s “Three Arrows” policy takes its name from a 16th century Japanese legend which gives his proposal a cultural attraction, but he will need more than elegant words to overcome the difficulties of implementing the third arrow:-
Mori Motonari(1497 – 1571)ruler of the Chugoku area of Western Japan, found his land on the brink of war. He called his three eldest sons to his castle and gave the first an arrow, asking him to break it. Of course, his son easily broke the arrow in two. Then, Mori gathered three arrows together, gave them again to one of his sons, and asked him to break these three arrows, all together. His son tried with all his strength to break the arrows but it was impossible. Mori explained to his sons, “Just like one arrow, the power of just one person can easily be overcome. However, three arrows together cannot be destroyed. Human strength is the same as these arrows; we cannot be defeated if we work together.”
The BoJ’s 2% inflation target and policy of “quantitative and qualitative easing” (QQE) have been effective in managing market expectations – the JPY is lower and the Nikkei higher without too dramatic a backing up of Japanese Government Bond (JGB) yields. However, doubts about Abe’s ability to deliver the essential third arrow heralded a reversal of both JPY and the Nikkei during the summer. Now the JPY is declining once more and the Nikkei, rising – although other major stock markets have also performed strongly of late.
Is this the beginning of the next stage of the “Japan Trade” or are we merely witnessing year end rebalancing of portfolios?
Emerging Markets
To answer this question I believe we also need to consider the position of China, South Korea and other emerging markets. China is the growing regional hegemon within South East Asia and its territorial disputes with its neighbours around the South and East China Sea are likely to escalate – its announcement last month of the Air Defense Identification Zone (ADIZ) in the East China Sea is likely to sour relations with South Korea. This article from The Diplomat provides more information: –
http://thediplomat.com/2013/11/is-the-china-south-korea-honeymoon-over
Yet, at the same time China is an essential export market for these neighbours; according to a recent article from China Daily, Japan’s exports to China hit a four year low as a result of the rising military tensions surrounding the Senkaku/Diaoyu Islands : –
http://usa.chinadaily.com.cn/business/2013-08/15/content_16897913.htm
This year the US resumed its place as Japan’s largest export market, a position it had lost to China in 2009, however China is still a close second – although it also remains Japan’s largest import market.
For a broader review of the current geopolitical situation within the region, this week’s China-US Focus newsletter from the China – United States Exchange Foundation – Japan and China: Courting Confrontation – is a useful resume:-
http://www.chinausfocus.com/foreign-policy/japan-and-china-courting-confrontation/
South Korea’s exports to China are also lower this year due to a slowing of Chinese growth, but, helped by stronger exports to Europe and the US, they have been able to support higher GDP growth – together with higher inflation – than Japan. The ending of the Iranian Oil embargo, easing upward geopolitical pressure on energy prices, will help South Korea maintain growth. Its exports to Japan have been strong throughout 2013. Nonetheless, the South Korean administration is extremely sensitive to a weakening JPY, notwithstanding the world class quality of a number of its exporters. Of course, lower oil prices will also benefit Japan but its energy consumption per capita is roughly 20% lower than that of South Korea.
The US has been leading the way with structural reform and parts of Europe have followed suit, however, a number of commentators have voiced concern about the need for emerging markets to embrace structural reform. Anders Aslund of the Peterson Institute had this to say: –
http://www.piie.com/publications/wp/wp13-10.pdf
The hypothesis of this paper is that the emerging market growth from 2000 to 2012 was atypically high and we might be back in a situation that is more reminiscent of the early 1980s. The growth of the last 12 years was neither sustainable nor likely to last. Several cycles that are much longer than the business cycle exist. One is the credit cycle, which Claudio Borio (2012) assesses at 15 to 20 years.
Another is the commodity cycle, which last peaked in 1980 and might last 30 to 40 years (Jacks 2013, Hendrix and Noland forthcoming). A third is the investment or Simon Kuznets cycle, which appears related to both the credit and commodity cycles (Kuznets 1958). A fourth cycle is the reform cycle, which might also coincide with the Kondratieff cycle (Rostow 1978).
The author goes on to highlight seven reasons why high emerging market growth will not continue at the pace of the past decade:-
1. One of the biggest credit booms of all time has peaked out. Extremely low interest rates cannot
continue forever. A normalization is inevitable. Many emerging economies are financially vulnerable
with large fiscal deficits, public debts, current account deficits, and somewhat high inflation.
2. A great commodity boom has peaked out, as high prices and low growth depress demand, while the
high prices have stimulated a great supply shock.
3. The investment or Simon Kuznets cycle has peaked out, as the very high Chinese investment ratio is
bound to fall and real interest rates to rise.
4. Because of many years of high economic growth, the catch-up potential of emerging economies has
been reduced and growth rates are set to fall ceteris paribus.
5. Many emerging economies carried out impressive reforms from 1980 to 2000, but much fewer
reforms have taken place from 2000 to 2012. The remaining governance potential for growth has
been reduced. Characteristically, reforms evolve in cycles that are usually initiated by a serious crisis,
and after 12 good years complacency has set in in the emerging economies.
6. Worse, the governments of many emerging economies are drawing the wrong conclusion from
developments during the Great Recession. Many think that state capitalism and industrial policy have
proven superior to free markets and private enterprise. Therefore, they feel no need to improve their
economic policies but are inclined to aggravate them further.
7. Finally, the emerging economies have benefited greatly from the ever more open markets of the
developed countries, while not fully reciprocating. The West is likely to proceed with selective,
regional trade agreements rather than with general liberalization.
I am more optimistic about EM growth than Peterson because of the underlying economic renaissance I believe is happening in the USA, combined with the benefits which will accrue from harnessing Big Data and the improving “health-span” (the upside of extended Life-span) over the next ten to twenty years.
Free Trade
A further factor to consider is the progress, or otherwise, of the Trans Pacific Partnership (TPP) and other agreements. The European Centre for International Political Economy (ECIPE) has produced a timely up-date here: –
http://www.ecipe.org/media/publication_pdfs/ECIPE_bulletin_TPP_Nov_2013_final.pdf
The TPP is not the only Free Trade Agreement (FTA) on the agenda but the negotiations, even of bi-lateral FTAs, is so protracted that the financial markets are unlikely to afford them any credence until they are signed and sealed.
Demographics
As I mentioned earlier, historically Japan has been a nation of savers and investors. As JGB yields trended towards zero, investors looked for higher yields abroad. Today, in a world of near zero interest rates in the major economies, the “carry trade” is no longer the attraction it once was. More significantly, going forward, demographics will also change the direction of capital flows. Savers are retiring and become consumers. Foreign assets, which have gradually been repatriated during the last decade, will be eclipsed by consumption of foreign goods – the Japanese have been running a trade deficit since the beginning of 2012 – see the link below from Trading Economics:-
http://www.tradingeconomics.com/japan/balance-of-trade
Derivatives
The “carry trade” is discussed extensively in a recent working paper from the IMF – The Curious Case of the Yen – they make an impressive empirical case for a non-domestic cause of JPY “safe-haven” behaviour: –
http://www.imf.org/external/pubs/ft/wp/2013/wp13228.pdf
During risk-off episodes, the yen is a safe haven currency and on average appreciates against the U.S. dollar. We investigate the proximate causes of yen risk-off appreciations. We find that neither capital inflows nor expectations of the future monetary policy stance can explain the yen’s safe haven behavior. In contrast, we find evidence that changes in market participants’ risk perceptions trigger derivatives trading, which in turn lead to changes in the spot exchange rate without capital flows. Specifically, we find that risk-off episodes coincide with forward hedging and reduced net short positions or a buildup of net long positions in yen. These empirical findings suggest that offshore and complex financial transactions should be part of spillover analyses and that the effectiveness of capital flow management measures or monetary policy coordination to address excessive exchange rate volatility might be limited in certain cases.
The IMF concludes that the derivative “carry trade” is largely responsible for the safe-haven behaviour of the last few years:-
The evidence presented in this paper supports the interpretation of the yen as a currency with safe haven status. But safe haven effects work differently for the yen than for other safe haven currencies. Surprisingly and in contrast to the experience of the Swiss Franc, yen risk-off appreciations appears unrelated to capital inflows (cross-border transactions) and do not seem supported by expectations about the relative stance of monetary policies. Instead, we presented evidence that portfolio rebalancing through offshore derivative transactions occur contemporaneously to yen risk-off appreciations. This could reflect either a causal effect of portfolio rebalancing through derivative transactions or the workings of self-fulfilling expectations causing both currency appreciation and portfolio rebalancing.
Conclusion
In an unreformed developed economy like Japan the downside risks to growth remain and these risks temper my enthusiasm for Japanese stocks. Protracted fiscal stimulus by the Japanese government has been crowding out productive private investment for many years. Japan and South Korea may have similar deflated GDP growth rates since 1997 but I would prefer to invest in a country where private domestic product is the engine of growth. Japanese stocks may rise as the JPY trends lower but the initial windfall to Japanese corporate profits is likely to be tempered by regulatory or tariff style retaliation from their neighbours and the need to repay Japanese government debt via taxation in the longer-term.
The JPY, however, is a different matter. Regulatory reforms such as the introduction of central counterparty, increasing margin requirements for OTC derivatives and the introduction of swap execution facilities (SEFs) are factors which should reduce the nominal size of the JPY “carry trade”. The lower yield differential between the major currencies has also reduced the attraction of trade. Demographic headwinds are now beginning to favour consumption over saving and Japanese government debt will need to be repaid in the fullness of time. Japanese corporations may defy gravity by overseas expansion but domestic firms will have to accept a protracted period of slow growth as the economy rebalances away from government spending towards private sector investment.
At the beginning of 2013, whilst I liked both trades, I advocated being long Nikkei futures rather than short JPY. Going into 2014 my preferences are reversed.
