A Rose by Any Other Name – Corona Bonds and the Future of the Eurozone

A Rose by Any Other Name – Corona Bonds and the Future of the Eurozone

In the Long Run - small colour logo

Macro Letter – No 128 – 17-04-2020

A Rose by Any Other Name – Corona Bonds and the Future of the Eurozone

  • A European fiscal spending package worth Euro 540bln has been agreed
  • Eurozone bonds have crashed and recovered
  • Corona Bonds have been found unnecessary
  • The issue of Eurozone backed Eurobonds will not go away

On April 9th the Eurogroup of Finance Ministers eventually agreed upon a three-pronged package to avert some of the economic impact of the Covid-19 pandemic. For financial markets this was a relief, had the Eurogroup broken up, for the second time in a week, without a deal markets would have reacted badly. The three-pronged package included health expenditure funding from the European Stability Mechanism (ESM), loans for businesses from the European Investment Bank (EIB) and further funding from the European Commission’s unemployment fund. The total package is a modest Euro 540bln, the political ramifications are much less so.

What was not agreed, despite the unprecedented circumstances surrounding the pandemic, was a collective pooling of Eurozone (EZ) resources in the form of ‘Eurobonds,’ deftly renamed ‘Corona Bonds,’ by their advocates. For the fiscally responsible countries of Northern Europe, even the current crisis was insufficient for them to contemplate underwriting the prodigal South.

The compromise, agreed last week, included the use the ESM. The ESM itself, together with the outright monetary transactions (OMT) undertaken by the ECB, were forged in the 2010/2012 Eurozone crisis. At that time the convergence of Eurozone government bond yields, which had begun long before the advent of the Euro, was unravelling as investors realised that Europe would not collectively underwrite any individual state’s obligations. The North/South divide became a chasm, with Greek, Portuguese, Italian and Spanish bond yields rising sharply whilst German, Dutch and Finnish yields declined. The potential default of a Eurozone government was only averted by the actions of the then President of the ECB, Mario Draghi, when he stated that the central bank would do, ‘Whatever it takes.’

Once again, a motley deal has been forged, recriminations will follow. Whilst lower government financing costs remain a major attraction of EZ membership for newer members of the EU, the benefit is by no means guaranteed, as this 2017 paper – Eurozone Debt Crisis and Bond Yields Convergence: Evidence from the New EU Countries – by Minoas Koukouritakis, reveals: –

Based on the empirical results, there is some clear evidence of strong monetary policy convergence for each of the Czech Republic, Lithuania and Slovakia to Germany. Alternatively, under the UIP and ex-ante relative PPP conditions, the expected inflation rate of these three countries has converged to the expected inflation rate of Germany. This is an expected result not only because Lithuania and Slovakia are already Eurozone members, but also because Germany plays a very important role in the economies of these three countries. Furthermore, the empirical results provide evidence of weak monetary policy convergence for each of Croatia and Romania to Germany. In contrast, for the remaining seven new EU countries, namely Bulgaria, Cyprus, Hungary, Latvia, Malta, Poland and Slovenia, the empirical evidence suggests yields’ divergence for each of these countries in relation to Germany. For Cyprus, Latvia and Slovenia, which as Eurozone members they have common monetary policy with Germany, the empirical evidence could probably be attributed to the increased sovereign default risk of these countries, which in turn led to large and persistent risk premia.

In summary, the empirical evidence indicates that in the context of the Eurozone debt crisis, even though Germany has established its dominance and sets the macroeconomic policies in the Eurozone, several new EU countries are unable to follow these policies. And this conclusion addresses once more the issue of core-periphery in the Eurozone and, thus, the Eurozone’s future prospects.

The past six weeks has seen a global fiscal response to the pandemic. Stock markets have declined and credit spreads in corporate bond markets have widened. In European government bonds the pattern has been similar, the migratory flight to quality saw flocks of investors head north, especially into Switzerland and Germany. The simplified chart below shows three data points;

March 9th, when German Bund yields reached their recent nadir,

March 18th, the date investors became spooked by the sheer magnitude of the fiscal response required by EZ governments: and

April 14th, the day on which Italy and Spain announced the first relaxation their lockdown restrictions: –

European Bond Spread chart March April 2020

Source: Trading Economics, Investing.com

There are several observations; firstly, even as the lockdown comes towards its end, bond yields are higher, reflecting concerns about the impact of fiscal spending on government budgets as tax receipts collapse. Secondly, German Bund yields are now lower than Swiss Confederation bonds, despite expectations that Germany may end up footing the bill for the lion’s share of government borrowing across the EZ. This may be a reflection of the lower percentage fatality rate in Germany – 2.5% versus 4.4% in Switzerland – or simply a function of the greater liquidity available in the German bond market.

A third observation concerns the higher yielding countries of Greece, Italy, Portugal and Spain. Despite a larger number of Covid-19 infections, Spanish Bonos have maintained their lower yield relative to Italian BTPs, meanwhile, Greek bonds have converged towards Italy and Portuguese bonds trade within 4bp of Spain.

Convergence, divergence and political will

This is not the first macro letter on the topic of EZ bond convergence, the chart below is taken from Macro Letter – No 10 – 25-04-2014 – The Limits Of Convergence – Eurozone Bond Yield Compression Cracks the second of eight previous articles on subject: –

European Bond Yields - 2005 - 2014 - Bloomberg

Source: Bloomberg

At that time I suggested three scenarios: –

  1. Full Banking Union and further federalisation of Europe
  2. Full Banking Union but limitation of federalisation
  3. Eurozone break-up

The EZ crisis had finally disapated but the full impact of QE had not yet been appreciated, the table below shows the yield to maturity and spread over German Bunds of the 10 year bonds of Italy, Spain, Greece and Portugal traded on 24th April 2014 (roughly six years ago): –

Spreads in April 2014

Source: Bloomberg

In April 2014 I saw the second scenario as most likely. I anticipated limited ‘Eurobond’ issuance, this has not yet come to pass, but last week’s stimulus looks like a federal bail-out by any other name. Last month, as the Covid-19 pandemic took hold, the spread between German Bunds and Spanish Bonos touched 1.54%, whilst the spread against Greek bonds reached 4.22% and Portugal, 1.75%. Only Italy fared less well, the Bund/BTP spread reached 3.15; a marked deterioration since 2014.

Conclusions and Investment Opportunities

By the time I penned Macro Letter – No 73 – 24-03-2017 – Can a multi-speed European Union evolve? it was becoming clear that Italy was the focus of concern among fixed income investors. I concluded (a little too late) that: –

Spanish 10yr Bonos represents a better prospect than Italian 10yr BTPs, but one would have to endure negative carry to set up this spread trade: look for opportunities if the spread narrows towards zero.

The spread never returned to parity.

When I last wrote about EZ bonds, I focussed once again on Italy in Macro Letter – No 98 – 08-06-2018 – Italy and the repricing of European government debt. BTP yields had risen to a spread of 1.22% over Spanish Bonos and I expected a retracement. As the chart below reveals, BTP yields rose further before than regained composure: –

Spanish BONO vs Italian BTP 10yr Yield Spread Chart - March 31st 2020

Source: Y-Charts

Eurobonds are still not on the agenda even in a time of pandemic, therefore, Italian indebtedness remains the single greatest risk to the stability of the EZ. The convergence trade is fraught with geopolitical risk as cracks in the European Project are patched and papered over. Now is not the time for revolution, but the ongoing fiscal strain of the pandemic means the policy of issuing Eurobonds backed by a European guarantor will not go away. I expect EZ government bond yield compression accompanied by occasional violent reversals to become the pattern during the next few years, together with increasing political tension between European countries north and south.

Hard Brexit maths – walking away

400dpiLogo

Macro Letter – No 77 – 19-05-2017

Hard Brexit maths – walking away

  • The UK’s NIESR estimate the bill for Hard Brexit to the UK at EUR 66bln
  • I guesstimate the cost of Hard Brexit to the EU at EUR 62bln
  • Legal experts for both sides suggest UK obligations cease on Brexit
  • A Free-trade deal with the EU may not begin until after March 2019

…How selfhood begins with a walking away…

C. Day-Lewis

It has been estimated that if the UK accedes to EU demands for a further EUR 100bln in order to begin the process of establishing a bi-lateral trade deal with the EU post-Brexit, it will cost the UK economy 4.4% of GDP. According to estimates from the NIESR, to revert to WTO Most Favored Nation terms (the Hard Brexit option) would only cost between -2.7% and -3.7% of GDP (EUR 61bln to EUR 84bln).

In January UK MP May stated:-

No deal is better than a bad deal.

It looks, on this basis, as though the UK may indeed walk away from its purported EU obligations.

A more considered analysis from, the politically influential Brussels based thin-tank Bruegel – Divorce settlement or leaving the club? A breakdown of the Brexit bill – suggests a more modest final bill:-

Depending on the scenario, the long-run net Brexit bill could range from €25.4 billion to €65.1 billion, possibly with a large upfront UK payment followed by significant EU reimbursements later.

This substantial price range is due to the way the UK’s share of liabilities is calculated. At 12% (the UK’s rebate-adjusted share of EU commitments) it is EUR 25.4bln. At 15.7% (the UK’s gross contributions without a rebate adjustment) it rises to EUR 65.1bln.

The House of Lords legal interpretation – Brexit and the EU budget:-

Article 50 provides for a ‘guillotine’ after two years if a withdrawal agreement is not reached unless all Member States, including the UK, agree to extend negotiations. Although there are competing interpretations, we conclude that if agreement is not reached, all EU law—including provisions concerning ongoing financial contributions and machinery for adjudication—will cease to apply, and the UK would be subject to no enforceable obligation to make any financial contribution at all.

This suggests all of the UK’s commitments to the EU are linked to membership. If that legal interpretation is correct, there would be no Brexit bill at the moment of departure. Apparently EU legal experts have arrived at similar conclusions. The Telegraph – €100bn Brexit bill is ‘legally impossible’ to enforce, European Commission’s own lawyers admit has more on this contentious subject.

Setting aside the legal obligations in favour of a diplomatic solution, what is the price range where a potential agreement may lie? The cost to the UK appears to be capped at EUR 84bln in a worst case scenario. One may argue that the ability of Sterling to decline, thus improving the UK’s terms of trade, makes this scenario unrealistically high, but as I discussed in – Uncharted British waters – the risk to growth, the opportunity to reform historic evidence doesn’t support the case very well at all:-

Another factor to consider, since the June vote, is whether the weakness of Sterling will have a positive impact on the UK’s chronic balance of payments deficit. This post from John Ashcroft – The Saturday Economist – The great devaluation myth suggests that, if history even so much as rhymes, it will not:-

If devaluation solved the problems of the British Economy, the UK would have one of the strongest trade balances in the global economy…. the depreciation of sterling in 2008 did not lead to a significant improvement in the balance of payments. There was no “re balancing effect”. We always argued this would be the case. History and empirical observation provides the evidence.

There was no improvement in trade as a result of the exit from the ERM and the subsequent devaluation of 1992, despite allusions of policy makers to the contrary. Check out our chart of the day and the more extensive slide deck below.

Seven reasons why devaluation doesn’t improve the UK balance of payments …

1 Exporters Price to Market…and price in Currency…there is limited pass through effect for major exporters

2 Exporters and importers adopt a balanced portfolio approach via synthetic or natural hedging to offset the currency risks over the long term

3 Traders adopt a medium term view on currency trends better to take the margin boost or hit in the short term….rather than price out the currency move

4  Price Elasticities for imports are lower than for exports…The Marshall Lerner conditions are not satisfied…The price elasticities are too limited to offset the “lost revenue” effect

5  Imports of food, beverages, commodities, energy, oil and semi manufactures are relatively inelastic with regard to price. The price co-efficients are much weaker and almost inelastic with regard to imports

6 Imports form a significant part of exports, either as raw materials, components or semi manufactures. Devaluation increases the costs of exports as a result of devaluation

7 There is limited substitution effect or potential domestic supply side boost

8 Demand co-efficients are dominant


But what is the economic impact on the EU? CIVITAS – Potential post-Brexit tariff costs for EU-UK trade postulates some estimates:-

Our analysis shows that if the UK leaves the EU without a trade deal UK exporters could face the potential impact of £5.2 billion in tariffs on goods being sold to the EU. However, EU exporters will also face £12.9 billion in tariffs on goods coming to the UK.

Exporters to the UK in 22 of the 27 remaining EU member states face higher tariffs costs when selling their goods than UK exporters face when selling goods to those countries.

German exporters would have to deal with the impact of £3.4 billion of tariffs on goods they export to the UK. UK exporters in return would face £0.9 billion of tariffs on goods going to Germany.

French exporters could face £1.4 billion in tariffs on their products compared to UK exporters facing £0.7 billion. A similar pattern exists for all the UK’s major EU trading partners.

The biggest impact will be on exports of goods relating to vehicles, with tariffs in the region of £1.3 billion being applied to UK car-related exports going to the EU. This compares to £3.9 billion for the EU, including £1.8 billion in tariffs being applied to German car-related exports.

The net Trade Effect of a Hard Brexit on the basis of these calculations is EUR 7.7bln in favour of the UK.

Then we must consider the UK contribution to the EU budget, which, if the House of Lords assessment is confirmed, will be zero after Brexit. This will cost the EU EUR7.8bln, based on the 2017 net EU budget of EUR 134bln, to which the UK is currently the second largest contributor at 5.8%.

Next there is the question of the impact on EU27 economic growth. These headwinds will be felt especially in the Netherlands, Ireland and Cyprus but the largest absolute cost will be borne by Germany.

According to a February 2016 study by DZ Bank, a Hard Brexit would be to reduce German economic growth by -0.5%, from 1.7% to 1.4% – EUR 18.5bln. Credit Agricole published a similar study of the impact on the French economy in June 2016. They estimated that French GDP would be reduced by -0.4% in the event of a free-trade agreement and -0.6% in the event of a Hard Brexit – EUR 13.2bln. The Netherlands Bureau for Economic Policy Analysis (CPB) estimated the cost to the Netherlands at -1.2% – EUR 8.2bln. Italian Government forecasters estimate the impact at -0.5 to -1% – taking the best case scenario – EUR 8.3bln. A leaked Spanish Government report from March 2017 (interestingly, the only estimate I have been able to uncover since the Brexit vote) indicates a cost of between -0.17% and -0.34% of GDP – again, taking the best case – EUR 2bln. Ireland, given its geographic position, shared language and border, has, perhaps the closest ties with the UK of any EU27 country. Back in 2016 the Irish ERSI estimated the impact on Ireland at only -1%, I suspect it might be greater but I will take them at their word – EUR 2.6bln.

In the paragraph above I have looked at just five out of the EU27. Added together the cost to just these five countries is EUR 52.8bln, but I believe it to be representative, they accounted for 84.74% of EU GDP in 2016. From this I arrive at an extrapolated cost to the EU of a Hard Brexit of EUR 62.3bln.

The European Commission has indicated that the cost for the UK to begin negotiating the terms of a new free-trade agreement with the EU may be as much as EUR 100bln. The cost to the UK, of simply walking away – Hard Brexit – is estimated at between EUR 61bln and EUR 84bln per annum. The cost of Hard Brexit to the EU is estimated (I should probably say guesstimated, since there are so many uncertainties ahead) at EUR 62bln. A simple cost benefit analysis suggests that both sides have relatively similar amounts to lose in the short term. And I hate to admit it, but looked at from a negative point of view, in the long run, the UK, with its structural current account and trade deficit, may have less to lose from simply walking away.

Conclusion and Investment Opportunities

Brexit negotiations are already and will remain deeply political. From a short-term economic perspective it makes sense for the UK to walk away and re-establish its relationships with its European trading partners in the longer run. Given the UK trade deficit with the EU it has the economic whip-hand. Working on the assumption that Jean Claude Junker is not Teresa May’s secret weapon (after all, suggesting ever higher costs for negotiating a free-trade deal makes it more likely that the UK refuses to play ball) one needs to step back from the economics of the situation. The politics of Brexit are already and will probably become even more venal. For the sake of the UK economy, and, for that matter the economies of the EU, I believe it is better for the UK to walk away To those of you who have read my previous articles about Brexit, I wish to make clear, this is a change of opinion, politics has trumped economic common sense.

The implications for the UK financial markets over the next 22 months is uncertainty, although May’s decision to adopt a Hard Brexit starting point has mitigated a substantial part of these risks. Sterling is likely to act as the principle safety valve, however, a fall in the trade-weighted value of the currency will feed through to higher domestic inflation. Short term interest rates, and in their wake Gilt yields, are likely to rise in this scenario. Domestic stocks are also likely to be vulnerable to the negative impact of currency weakness and higher interest rates on economic growth. The FTSE 100, however, with 70% of its earnings derived from outside the UK, should remain relatively immune.

Can a multi-speed European Union evolve?

Can a multi-speed European Union evolve?

400dpiLogo

Macro Letter – No 73 – 24-03-2017

Can a multi-speed European Union evolve?

  • An EC white paper on the future of Europe was released at the beginning of the month
  • A multi-speed approach to EU integration is now considered realistic
  • Will a “leaders and laggards” approach to further integration work?
  • Will progress on integration enable the ECB to finally taper its QE?

At the Malta Summit last month German Chancellor Angela Merkel told reporters:-

We certainly learned from the history of the last years, that there will be as well a European Union with different speeds that not all will participate every time in all steps of integration.

On March 1st the European Commission released a white paper entitled the Future of Europe. This is a discussion document for debate next week, when members of the EU gather in Rome to celebrate the 60th anniversary of the signing of the Treaty of Rome.

The White Paper sets out five scenarios for the potential state of the Union by 2025:-

Scenario 1: Carrying On – The EU27 focuses on delivering its positive reform agenda in the spirit of the Commission’s New Start for Europe from 2014 and of the Bratislava Declaration agreed by all 27 Member States in 2016. By 2025 this could mean: Europeans can drive automated and connected cars but can encounter problems when crossing borders as some legal and technical obstacles persist. Europeans mostly travel across borders without having to stop for checks. Reinforced security controls mean having to arrive at airports and train stations well in advance of departure.

Scenario 2: Nothing but the Single Market – The EU27 is gradually re-centred on the single market as the 27 Member States are not able to find common ground on an increasing number of policy areas. By 2025 this could mean: Crossing borders for business or tourism becomes difficult due to regular checks. Finding a job abroad is harder and the transfer of pension rights to another country not guaranteed. Those falling ill abroad face expensive medical bills. Europeans are reluctant to use connected cars due to the absence of EU-wide rules and technical standards.

Scenario 3: Those Who Want More Do More – The EU27 proceeds as today but allows willing Member States to do more together in specific areas such as defence, internal security or social matters. One or several “coalitions of the willing” emerge. By 2025 this could mean that: 15 Member States set up a police and magistrates corps to tackle cross-border criminal activities. Security information is immediately exchanged as national databases are fully interconnected. Connected cars are used widely in 12 Member States which have agreed to harmonise their liability rules and technical standards.

Scenario 4: Doing Less More Efficiently – The EU27 focuses on delivering more and faster in selected policy areas, while doing less where it is perceived not to have an added value. Attention and limited resources are focused on selected policy areas. By 2025 this could mean A European Telecoms Authority will have the power to free up frequencies for cross-border communication services, such as the ones used by connected cars. It will also protect the rights of mobile and Internet users wherever they are in the EU.A new European Counter-terrorism Agency helps to deter and prevent serious attacks through a systematic tracking and flagging of suspects.

Scenario 5: Doing Much More Together – Member States decide to share more power, resources and decision-making across the board. Decisions are agreed faster at European level and rapidly enforced. By 2025 this could mean: Europeans who want to complain about a proposed EU funded wind turbine project in their local area cannot reach the responsible authority as they are told to contact the competent European authorities. Connected cars drive seamlessly across Europe as clear EU-wide rules exist. Drivers can rely on an EU agency to enforce the rules.

There is not much sign of a multi-speed approach in the above and yet, on 6th March the leaders of Germany, France, Italy and Spain convened in Versailles where they jointly expressed the opinion that allowing the EU to integrate at different speeds would re-establish confidence among citizens in the value of collective European action.

There are a couple of “general instruments”, contained in existing treaties, which give states some flexibility; ECFR – How The EU Can Bend Without Breaking suggests “Enhanced Cooperation” and “Permanent Structured Cooperation”(PESCO) as examples, emphasis mine:-

Enhanced cooperation was devised with the Amsterdam Treaty…in 1997, and revised in successive treaty reforms in Nice and Lisbon. Enhanced cooperation is stipulated as a procedure whereby a minimum of nine EU countries are allowed to establish advanced cooperation within the EU structures. The framework for the application of enhanced cooperation is rigid: It is only allowed as a means of last resort, not to be applied within exclusive competencies of the union. It needs to: respect the institutional framework of the EU (with a strong role for the European Commission in particular); support the aim of an ever-closer union; be open to all EU countries in principle; and not harm the single market. In this straitjacket, enhanced cooperation has so far been used in the fairly technical areas of divorce law and patents, and property regimes for international couples. Enhanced cooperation on a financial transaction tax has been in development since 2011, but the ten countries cooperating on this have struggled to come to a final agreement.

PESCO allows a core group of member states to make binding commitments to each other on security and defence, with a more resilient military and security architecture as its aim. It was originally initiated at the European Convention in 2003 to be part of the envisaged European Defence Union. At the time, this group would have consisted of France, Germany, and the United Kingdom. After disagreements on defence spending in this group and the referendum defeat for the European Constitution which meant the end of the Defence Union, a revised version of PESCO was added into the Lisbon treaty. This revised version allows for more space for the member states to decide on the binding commitments, which of them form the group, and the level of investment. However, because of its history, some member states still regard it as a top-down process which lacks clarity about how the groups and criteria are established. So far, PESCO has not been used, but it has recently been put back on the agenda by a group of EU member states.

These do not get the EU very far, but the ECFR go on to mention an additional Schengen-style approach, where international treaties of EU members can be concluded outside of the EU framework. These treaties can later be adopted by other EU members.

As part of their research the ECFR carried out more than 100 interviews with government officials and experts at universities and think-tanks across the 28 member states to discover their motivation for adopting a more flexible approach. The chart below shows the outcomes:-

ECFR FutureEU_MotiviationFlexibility

Source: ECFR

Interestingly, in two countries, Denmark and Greece, officials and experts believe that more flexibility will result in greater fragmentation. Nonetheless, officials and experts in Croatia, Finland, Germany, Italy, Latvia, and Spain are in favour of embracing a more flexible approach. Benelux and France remain sceptical. Here is how the map of Europe looks to the ECFR:-

ECFR206_THE_FUTURE_SHAPE_OF_EUROPE_-_CountryMap

Source: ECFR

The timeline for action is likely to be gradual. President Juncker’s plans to develop the ideas contained in the white paper in his State of the Union speech in September. The first policy proposals may be drafted in time for the European Council meeting in December. It is envisaged that an agreed course of action will be rolled out in time for the European Parliament elections in June 2019.

Can Europe wait?

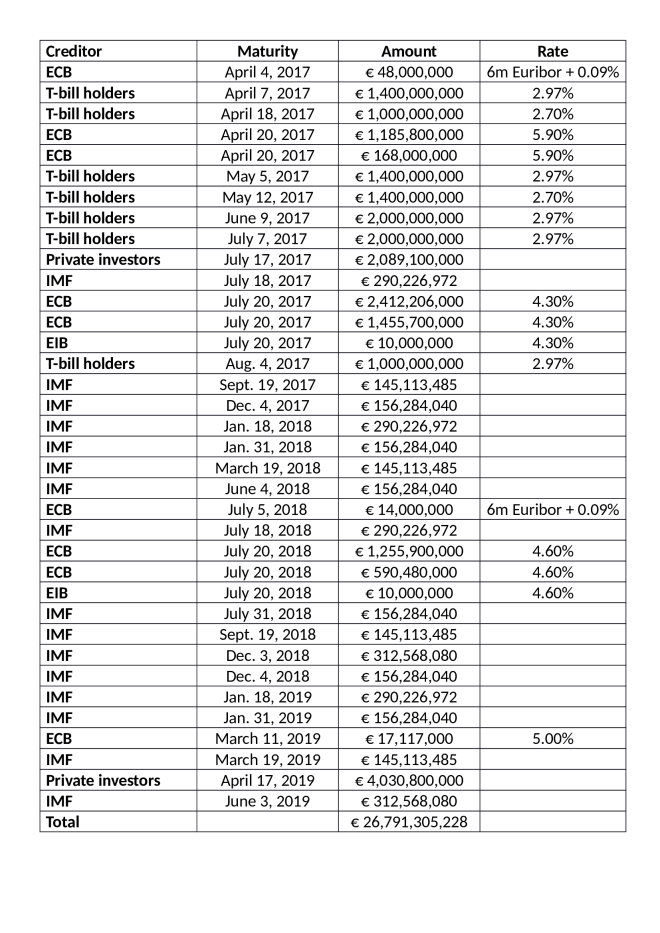
Two years is not that long a time in European politics but financial markets may lack such patience. Here is the Greek government debt repayment schedule prior to the European Parliament Elections:-

Greece_-_Repayment_Schedule_-_WSJ

Source: Wall Street Journal

This five year chart shows the steady rise in total Greek government debt:-

greece-government-debt

Source: Tradingeconomics, Bank of Greece

Greek debt totalled Eur 326bln in Q4 2016, the debt to GDP ratio for 2015 was 177%. Italy’s debt to GDP was a mere 133% over the same period.

ECB dilemma

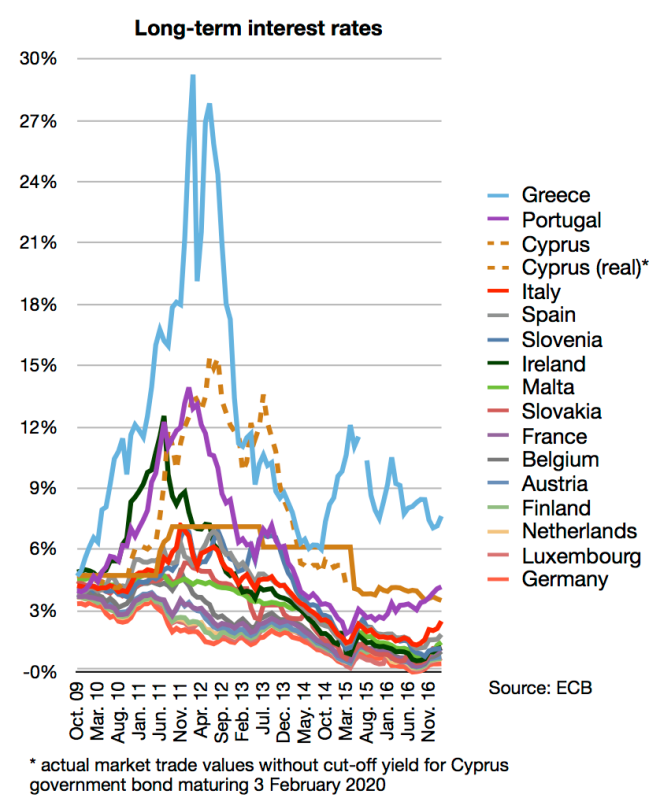
The ECB would almost certainly like to taper its quantitative easing, especially in light of the current tightening by the US. It reduced its monthly purchases from Eur 80bln per month to Eur 60bln in December but financial markets only permitted Mr Draghi to escape unscathed because he extended the duration of the programme from March to December 2017. Further reductions in purchases may cause European government bond spreads to diverge dramatically. Since the beginning of the year 10yr BTPs have moved from 166bp over 10yr German Bunds to 2.11% – this spread has more than doubled since January 2016. The chart below shows the evolution of Eurozone long-term interest rates between October 2009 and November 2016:-

Long-term_interest_rates_(eurozone) Oct 09 to Nov 16 - ECB

Source: ECB

In 2011 the Euro Area debt to GDP ratio was 86%, by 2015 it had reached 91%. The table below shows the highest 10yr yield since the great financial crisis for a selection of Eurozone government bonds together with their ratios of debt to GDP. It goes on to show the same ratio at the end of 2015. Only Germany is in a stronger position today than it was during the Eurozone crisis in terms of its debt as a percentage of its GDP:-

Bond_yields_and_debt_to_GDP (1)

Source: Trading Economics

Since these countries bond markets hit their yield highs during the Eurozone Crisis, Greece, Italy and Spain have seen an improvement in GDP growth, but only Spain is likely to achieve sufficient growth to reduce its debt burden. If the ECB is to cease killing the proverbial fatted calf, a less profligate fiscal approach is required.

Euro Area GDP averaged slightly less than 1.8% per annum over the last two years, yet the debt to GDP ratio only declined a little over 1% from its all-time high. Further European integration sounds excellent in theory but in practice any positive impact on economic growth is unlikely to be evident for several years.

EU integration has been moving at different speeds for years, if anything, the process has been held back by attempts to move in unison. There are risks of causing fragmentation with both approaches, either within countries or between them.

Conclusions and Investment Opportunities

Another Eurozone financial crisis cannot be ruled out this year. The political uncertainty of the Netherlands is past, but France may yet surprise. Once Germany has voted in September, it will be time to focus on the endeavours of the ECB. Their asset purchase programme is scheduled to end in December.

I would expect this programme to be extended once more, if not, the stresses which nearly tore the Eurozone asunder in 2011/2012 are likely to return. The fiscal position of the Euro Area is only slightly worse than it was five years ago, but, having flirted with the lowest yields ever recorded, bond markets have considerably further to fall in percentage terms than in during the previous crisis.

Spanish 10yr Bonos represents a better prospect than Italian 10yr BTPs, but one would have to endure negative carry to set up this spread trade: look for opportunities if the spread narrows towards zero. German Bunds are always likely to act as the safe haven in a crisis and their yields have risen substantially in the past year, yet at less than ½% they are 300bp below their “safe-haven” level of April 2011.

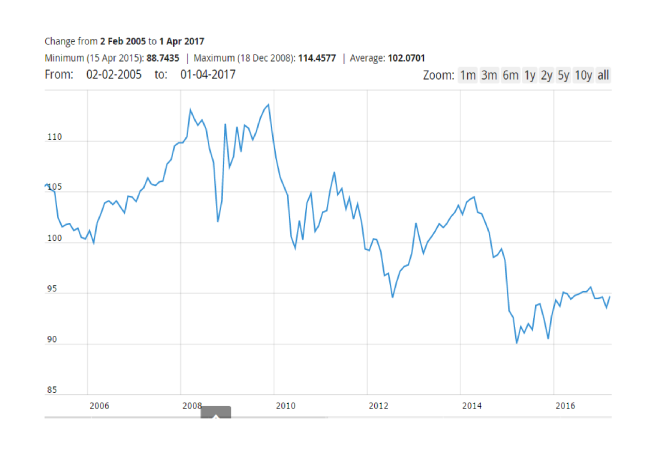
The Euro is unlikely to rally in this environment. The chart below shows the Euro Effective Exchange Rate since 2005:-

Euro_Effective_Exchange_Rate_-_ECB (1)

Source: ECB

The all-time low for the Euro is 82.34 which was the level is plumbed back in October 2000. This does sound an outlandish target during the next debacle.

Euro weakness would, however, be supportive for export oriented European stocks. The weakness that stocks would initially suffer, as a result of the return of the Euro crisis, would quickly be reversed, in much the same manner that UK stocks were pummelled on the initial Brexit result only to rebound.