First In, First Out – China as a Leading Indicator

First In, First Out – China as a Leading Indicator

Macro Letter – No 138 – 21-05-2021

First In, First Out – China as a Leading Indicator

  • China was the first country to recover from the Covid-19 pandemic
  • The PBoC began tightening monetary conditions in May 2020
  • Chinese housing and stocks remain strong despite official policy
  • Chinese contagion remains a risk to the global recovery

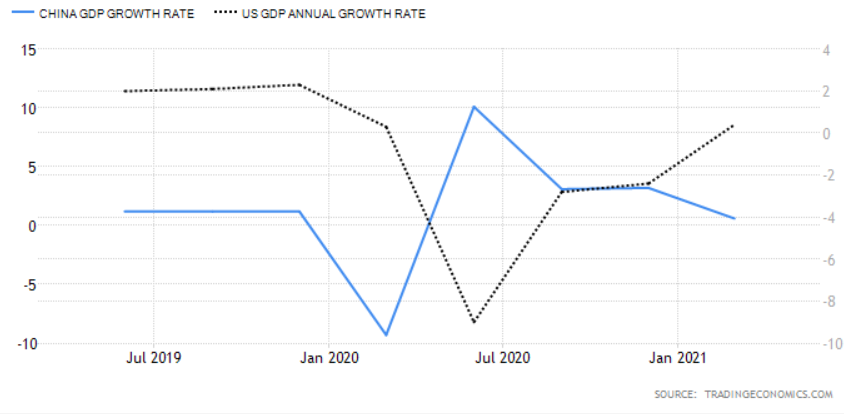
Whilst there are many aspects of the Chinese command economy which differ radically from that of the US, it is worth examining the performance of China’s economy, fiscal and monetary policy, and its financial markets. They may afford some insight into the future direction of other developed and developing markets as we gradually emerge from the Covid crisis: –

Source: Trading Economics

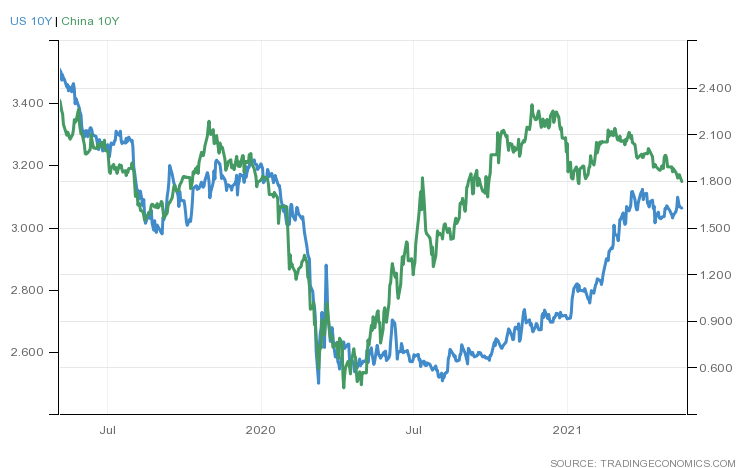
As can be seen from the chart above, whilst China was the first country to be struck by the Covid-19 pandemic it was also the first country to recover, however, a comparison of the Chinese and US bond markets provides a rather different picture: –
Source: Trading Economics

Chinese bond yields reached their lows at roughly the same time as those of the US, since when they have returned more rapidly to their pre-pandemic levels. If the US follows a similar trajectory the yield on US Treasuries is set to rise further.

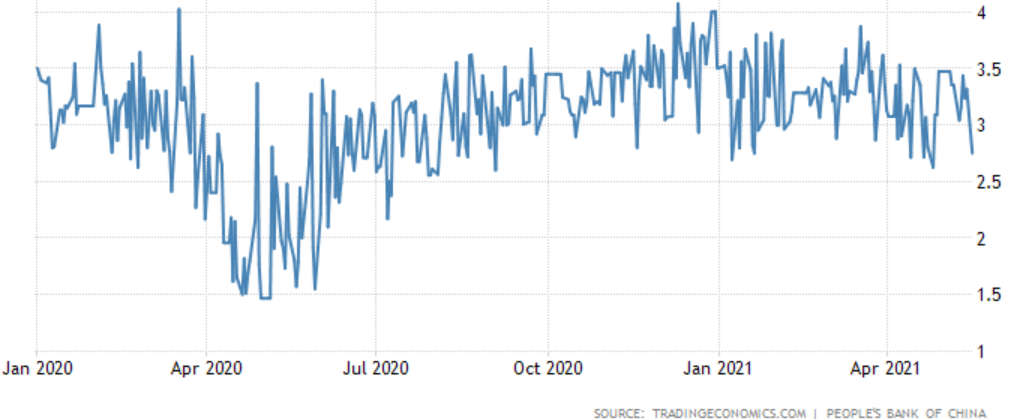
It can be argued, however, that the plight of the Chinese bond market is a function of the monetary stance of the People’s Bank of China (PBoC). When the crisis first erupted the PBoC cut its interest rate corridor by 0.3% and also drove down Chinese interbank rates by around 1.2% through its open market operations. By May 2020 that policy had changed, accommodation was replaced by a steady drain of liquidity.

The chart below shows the, rather volatile, 3 month Shibor rate, this is in marked contrast to the ‘lower for longer’ approach taken after the 2008 crisis. The Covid accommodation has been remarkably short-lived: –
Source: Trading Economics, PBoC

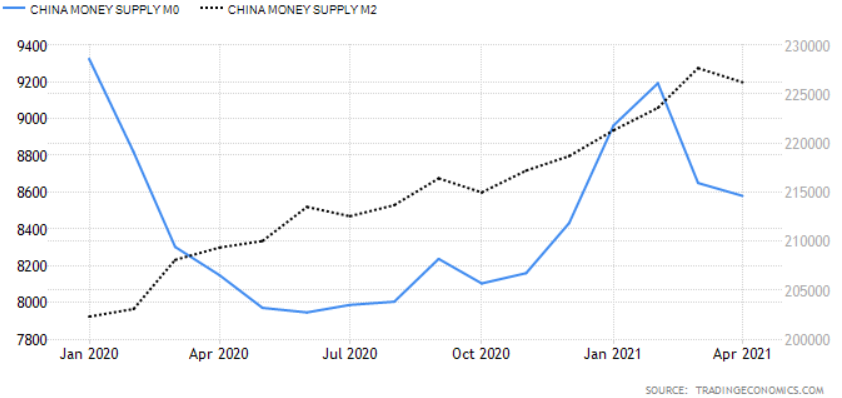
This PBoC tightening, which began in May 2020 and has been accompanied by official talk of the need for stability and the desire to avoid creating asset bubbles, is finally becoming evident in the money supply data: –
Source: Trading Economics

This contrasts with the continued expansion of US monetary aggregates: –
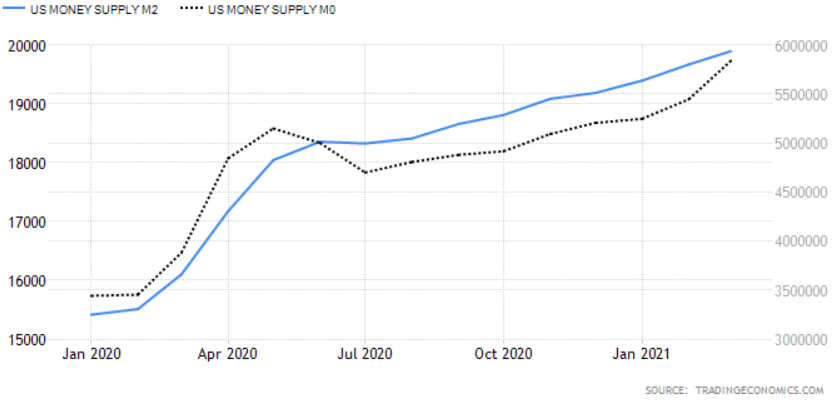
Source: Trading Economics

One of the challenges facing all central bankers is that interest rates are a blunt tool. Not all China’s asset markets have heeded the PBoC advice. The residential property market, for example, remains red hot despite the introduction of the three red lines policy – which aims to limit their liability-to-asset ratio (excluding advance receipts) to less than 70%, or their net gearing ratio to less than 100%, or their cash-to-short-term debt ratio to less than 1x, or a combination of all three. New home prices surged on regardless, gaining 4.8% in April, led by luxury real estate in Shenzhen, Shanghai and Guangzhou which is up 16% to 19% over the last year – a further tightening of regulation seems inevitable.

The PBoC has had greater influence elsewhere, Total Social Financing, their favoured measure of lending across the entire domestic financial system, rose by 12% in March, its slowest pace since April 2020:-
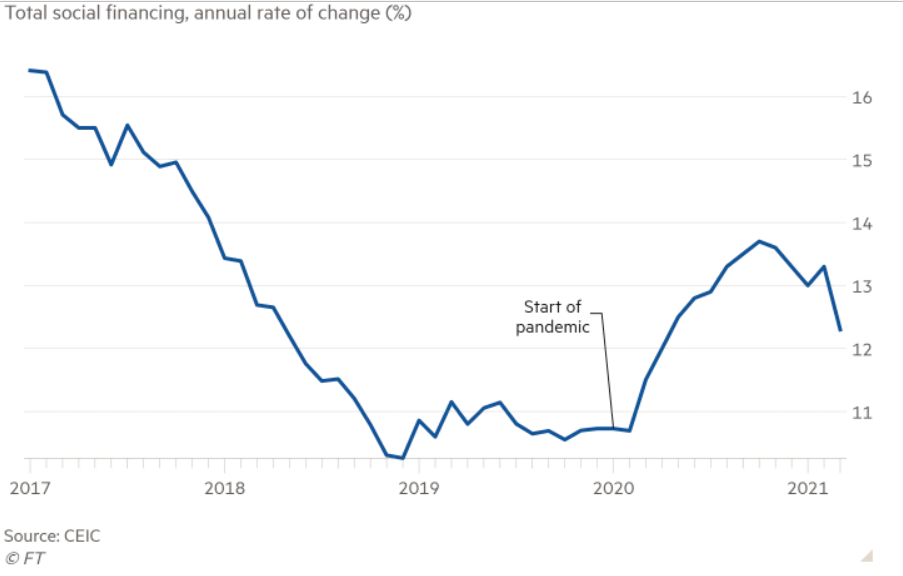
Source: Financial Times, CEIC

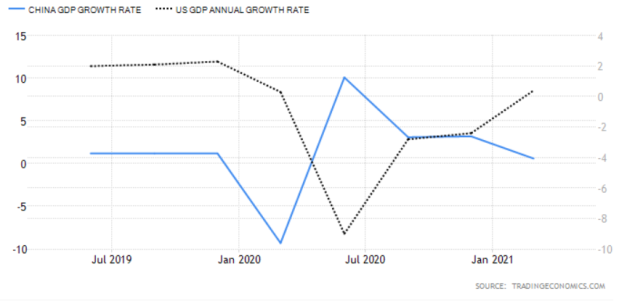
Another sign that official policy measures may be biting was seen in April’s retail sales which, whilst they rose by 17.7%, were down from a 34.2% in March, and came in well below the consensus forecast of 24.9%. Here again, China appears to be a leading indicator of the direction that the US economy might take: –
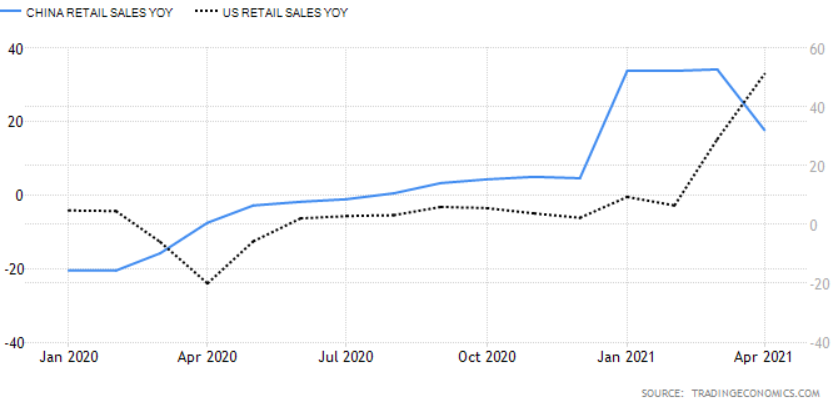
Source: Trading Economics

Interestingly, unlike 2015, the Chinese stock market has, thus far, reacted in a more measured way to the general tightening of monetary conditions. The next chart shows the relative performance of the Shanghai Composite versus the S&P 500 Index: –
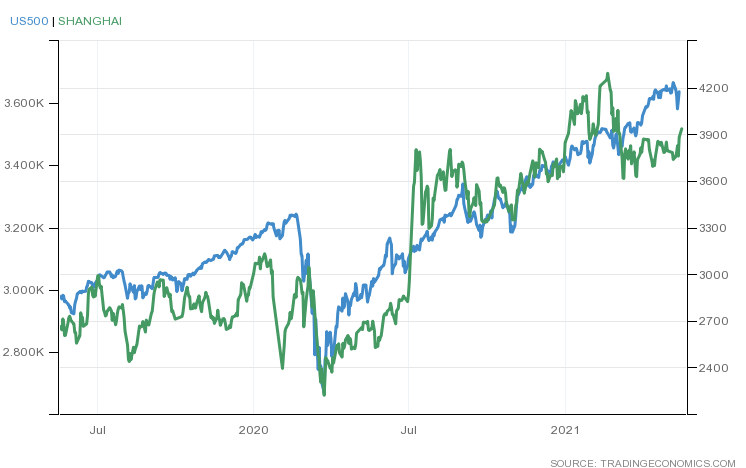
Source: Trading Economics

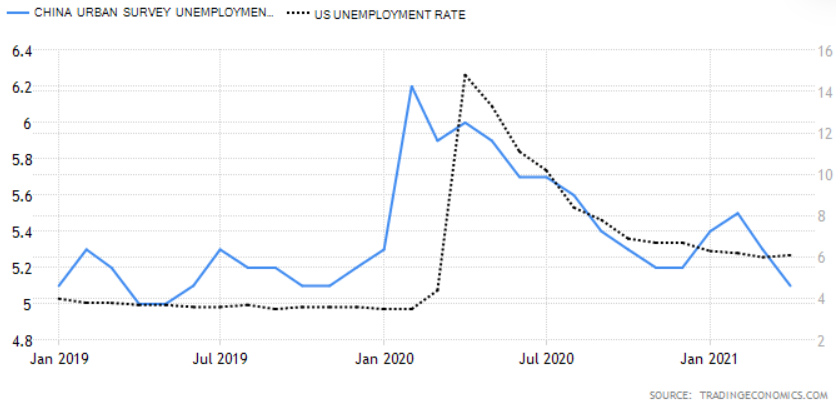
As mentioned above, money supply data points to a slowing of the Chinese economy but, like so many other countries, China saw a sharp rise in its, already high, household saving rate. The Paulson Institute estimates that Chinese households saved 3% more of their income than prior to Covid; Pantheon Macroeconomics equate this pool of savings to roughly 3% of GDP. While many commentators suggest that in China’s case this is a pool of precautionary saving, consumption will likely resume its long-term growth, now that employment prospects have begun to improve. The chart below shows the lagged trajectory of unemployment in US compared to China: –
Source: Trading Economics

US unemployment remains elevated relative to its pre-Covid rate but the economic recovery continues to gather momentum.

In China, as elsewhere, that portion of excess savings not consumed will either be left on deposit, used to reduce debt or invested. Even though interest rates have risen, the liquidity of Chinese capital markets should remain plentiful for the next six months to a year, sufficient to cushion any sudden downturns in the post-Covid recovery.

Conclusions and Investment Opportunities

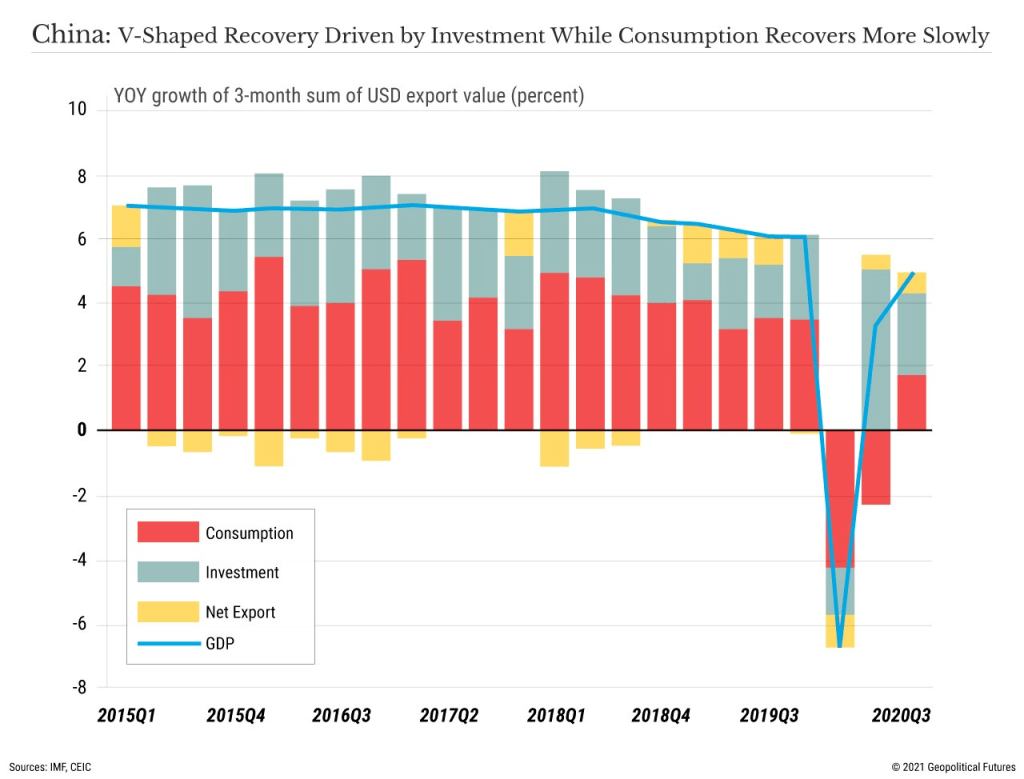
In the analysis above, I have produced a strew of charts suggesting that the US may follow the trajectory of China as the post-Covid recovery unfolds. This is almost certainly too simplistic. Above all else Beijing craves stability, it knows its pace of economic growth is slowing, this is structural. The investment-led growth model which has transformed the economy over the last four decades, requires the methadone of more credit to sustain even these lower rates of return. The policy of rebalancing towards domestic consumption offers longer-term hope, but China’s recovery from the Covid crisis was driven principally by investment and, to a much lesser extent, exports. The chart below, from George Friedman of Geopolitical Futures, shows the damage done to Chinese consumption by the pandemic and the subsequent rebound: –
Source: Geopolitical Futures, IMF, CEIC

The new(ish) US administration is also different from any we have seen for several decades. Markets believe in the arrival of a New New Deal fuelled by a gargantuan monetary and fiscal tonic which will heal-all. Asset prices continue to rise as The Everything Bubble inflates further.

We are still in the early stages of the economic recovery. Supply-chain constraints and labour shortages, even whilst under-employment remains elevated, have driven inflation expectations higher in the near-term, yet asset markets look beyond these shorter-term factors to the productivity gains, which have, in many cases, been a long overdue response to the crisis itself.

A few brave central bankers are seeking to temper the speculative frenzy. The majority, however, will place their emphasis on outcomes rather than the outlookas Federal Reserve Governor Lael Brainard recently stated. This politically expedient approach means fiat currencies will continue their race to the bottom, bond markets will remain neutered by the policy of QE; that leaves assets as the solitary safety-valve, somewhere between a store of wealth and thar she blows. They afford some protection against debasement and, with the advent of Decentralised Finance, there is a non-zero possibility that some of these assets might even become a means of exchange.

In the near-term we have seen the Norges Bank indicate that it may raise rates in H2 2021. The Bank of Canada has announced a tapering of government bond purchases, inking in a potential rate increase for late 2022, meanwhile the Bank of Japan, whilst it has made no bald statements, has moderated its ETF purchases and stands accused of taper by stealth because the scale of its bond-buying has actually slowed since it adopted yield curve control in 2016. These isolated actions are but clouds in a blue sky of endless liquidity but financial markets prefer to travel rather than to arrive. Choppier markets are likely over the next few months, there may be some excellent asset buying opportunities on sharp corrections.

Robots, employment and the mis-measurement of productivity

Robots, employment and the mis-measurement of productivity

In the Long Run - small colour logo

Macro Letter – No 97 – 18-05-2018

Robots, employment and the mis-measurement of productivity

  • UK productivity – output/hour has risen 1.5% in a decade
  • UK unemployment, at 4.2%, is the lowest since April 1975
  • UK real-wages have risen by 1.1% per annum over the last four years
  • Robots may be coming but it’s not showing up in the data

The subject matter of this Macro Letter is broad, so I shall confine my investigation to the UK. It was, after all, one of the first countries where services became a larger percentage of GDP than manufacturing. The crossover between manufacturing and services is estimated to have happened around 1881. When Napoleon Bonaparte described England as, ‘A nation of shopkeepers,’ his intension may have been derisive, but his observation was prescient. Of course, M. Bonaparte was actually quoting Adam Smith, who first coined the phrase in his magnum opus, An Inquiry into the Nature and Causes of the Wealth of Nations, published in 1776: now, he really was prescient.

As we stare into the abyss, anticipating the huge percentage of manufacturing – and now, many services – jobs which are expected to be replaced by machines, it behoves us to begin by reviewing the accuracy with which we measure services in general. A recent paper from the Centre for Economic and Business Research does just that for one sub-sector, although it suggests that mis-measurement of economic activity in services, always difficult to define, may be a factor in the poor productivity record of the UK. I have often described Britain as a post-industrial nation but this research, into one of the most vibrant corners of the economy, makes fascinating reading – The True Value of Creative Industries Digital Exports – CIC, CBER – March 2018 – finds, among other things that: –

The UK’s creative industries exports are: –

£46bn in goods and services – 24% higher than the official figure

£31bn of total creative exports are services – 41% higher than the official figure

£21bn of these creative services are digital services – 40% higher than the official figure

The CEBR goes on to point out other weaknesses in current measurements of economic activity: –

…estimated official figures for 2016 highlight that the majority of creative industries sub-sectors are exporting digital services. The IT, software and computer services sector, for example, exports £8.95bn in digital services. However, according to these figures, the crafts and museums, galleries and libraries sectors’ digital services exports are zero – which we know is not the case.

Many UK YouTube channels, for example, are watched by millions of viewers across the world. It is through these types of platforms that the creative industries export audiovisual content, music, and tutorials. Such platforms and the content they offer, however, may not be registered as a service export. This is due to difficulties capturing data for business models such as those offering free content and based on advertising revenues.

There are also structural challenges with collecting data on such exports. Often, it is difficult for digital intermediaries to determine the point of sale and purchase. The borderless way in which many global firms operate presents additional complications and the origin of the creative content, and of those who consume it, is frequently hard to track.

This brings me to the vexed question of productivity growth in the new machine age. In the Deloitte – Monday Briefing – Thoughts on the global economy – from 30th April, the author reflects on the discussions which occurred at the annual global gathering of Deliotte’s economic experts. I’m cherry picking, of course, the whole article is well worth reading: –

Despite discussion of recession risks I was struck by a cautious optimism about the long-term outlook. There was a general view that the slowdown in productivity growth in the West has been overstated, partly because of problems in capturing gains from technological change and quality improvements. As a result most of us felt that Western economies should be able to improve upon the lacklustre growth rates seen in the last ten years.

We agreed too that apocalyptic media stories about new technologies destroying work were overcooked; technology would continue to create more jobs than it destroys. The challenge would be to provide people with the right skills to prosper. The question was, what skills? We had a show of hands on what we would recommend as the ideal degree subjects for an 18-year-old planning for a 40-year career. Two-thirds advocated STEM subjects, so science, technology, engineering and maths. A third, myself included, opted for humanities/liberal arts as a way of honing skills of expression, creativity and thinking.

Mr Stewart ends by referring to a letter to the FT from Dr Lawrence Haar, Associate Professor at the University of Lincoln, in which he argues that poor UK productivity is a function of the low levels of UK unemployment. In other words, when everyone, even unproductive workers, are employed, productivity inevitably declines:-

…it does not have to be this way. Some economies, including Singapore, Switzerland and Germany, combine low unemployment and decent productivity growth. The right training and education can raise productivity rates for lower skilled workers. 

This theme of productivity growth supported by the right education and training is at the heart of a recent paper written by Professor Shackleton of the IEA – Current Controversies No. 62 – Robocalypse Now? IEA – May 2018 – the essay cautions against the imposition of robotaxes and makes the observation that technology has always created new jobs, despite the human tendency to fear the unknown: why should the adoption of a new swath of technologies be different this time? Here is his introduction: –

It is claimed that robots, algorithms and artificial intelligence are going to destroy jobs on an unprecedented scale.

These developments, unlike past bouts of technical change, threaten rapidly to affect even highly-skilled work and lead to mass unemployment and/or dramatic falls in wages and living standards, while accentuating inequality.

As a result, we are threatened with the ‘end of work’, and should introduce radical new policies such as a robot tax and a universal basic income.

However the claims being made of massive job loss are based on highly contentious technological assumptions and are contested by economists who point to flaws in the methodology.

In any case, ‘technological determinism’ ignores the engineering, economic, social and regulatory barriers to adoption of many theoretically possible innovations. And even successful innovations are likely to take longer to materialise than optimists hope and pessimists fear.

Moreover history strongly suggests that jobs destroyed by technical change will be replaced by new jobs complementary to these technologies – or else in unrelated areas as spending power is released by falling prices. Current evidence on new types of job opportunity supports this suggestion.

The UK labour market is currently in a healthy state and there is little evidence that technology is having a strongly negative effect on total employment. The problem at the moment may be a shortage of key types of labour rather than a shortage of work.

The proposal for a robot tax is ill-judged. Defining what is a robot is next to impossible, and concerns over slow productivity growth anyway suggest we should be investing more in automation rather than less. Even if a workable robot tax could be devised, it would essentially duplicate the effects, and problems, of corporation tax.

Universal basic income is a concept with a long history. Despite its appeal, it would be costly to introduce, could have negative effects on work incentives, and would give governments dangerous powers.

Politicians already seem tempted to move in the direction of these untested policies. They would be foolish to do so. If technological change were to create major problems in the future, there are less problematic policies available to mitigate its effects – such as reducing taxes on employment income, or substantially deregulating the labour market.

Professor Shackleton provides a brief history of technological paranoia. Riccardo added a chapter entitled ‘On Machinery’ to the third edition of his ‘Principles of Political Economy and Taxation,’ stating: –

‘I am convinced that the substitution of machinery for human labour is often very injurious to the interests of the class of labourers’.

While Marx, writing only a few decades later, envisaged a time when man would be enabled to: –

‘…to hunt in the morning, fish in the afternoon, rear cattle in the evening, criticise after dinner… without ever becoming hunter, fisherman, herdsman or critic.’

As for Keynes essay on the, ‘Economic Possibilities for our Grandchildren’, his optimism is laudable if laughable – 15 hour working week anyone?

The paranoia continues, nonetheless – The Economist – A study finds nearly half of jobs are vulnerable to automation – April 2018 – takes up the story:-

A wave of automation anxiety has hit the West. Just try typing “Will machines…” into Google. An algorithm offers to complete the sentence with differing degrees of disquiet: “…take my job?”; “…take all jobs?”; “…replace humans?”; “…take over the world?”

Job-grabbing robots are no longer science fiction. In 2013 Carl Benedikt Frey and Michael Osborne of Oxford University used—what else?—a machine-learning algorithm to assess how easily 702 different kinds of job in America could be automated. They concluded that fully 47% could be done by machines “over the next decade or two”.

A new working paper by the OECD, a club of mostly rich countries, employs a similar approach, looking at other developed economies. Its technique differs from Mr Frey and Mr Osborne’s study by assessing the automatability of each task within a given job, based on a survey of skills in 2015. Overall, the study finds that 14% of jobs across 32 countries are highly vulnerable, defined as having at least a 70% chance of automation. A further 32% were slightly less imperilled, with a probability between 50% and 70%. At current employment rates, that puts 210m jobs at risk across the 32 countries in the study.

For a robust analysis, if not refutation, of the findings of Frey and Osborne, I refer you back to Professor Shackleton’s IEA paper. He is more favourably disposed towards the OECD research, which is less apocalyptic in its conclusions. He goes on to find considered counsel in last year’s report from McKinsey Global Institute (2017) A Future that Works: Automation Employment and Productivity.

The IEA paper highlights another factor which makes it difficult to assess the net impact of technological progress, namely, the constantly changing nature of the labour market. As the table below reveals it has hardly been in stasis since the turn of the millennium: –

Percentage change in employment 2001-2017, selected occupations

Percentage change in employment 2001 - 2017 - IEA,ONS, Shackleton

Notes: April-June of years. Figures in brackets are April-June 2017 levels of employment.

Source: Author’s calculation from ONS

The job losses are broadly predictable; that technology has usurped the role of the travel agent is evident to anyone who booked a flight, hotel or hire-car online recently.  For economists there are always challenges in capturing the gains; back in 1987 Robert Solow, a recipient of the Nobel prize from economics,  famously observed, ‘You can see the computer age everywhere but in the productivity statistics’ – perhaps the technology has been creating more jobs than thought. Does the 170% rise in Animal Care and Control owe a debt to technology? You might be inclined to doubt it but the 400,000 Uber drivers of London probably do. We are still seeking signs in the economic data for something we know instinctively should be evident.

Between the mis-measurement of economic activity (if technology is being under-estimated to the tune of 24% in the creative industries sector to what extent are productivity gains from technology being underestimated elsewhere?) and the ever changing employment landscape, I believe the human race will continue to be employed in a wide and varied range of increasingly diverse roles. If some of the more repetitive and less satisfying jobs are consigned to robots and machine learning computer code, so much the better for mankind. For more on, what is sometimes termed, the routinisation of work, this working paper from Bruegel – The impact of industrial robots on EU employment and wages: A local labour market approach – April 2018 is inciteful. They examine six EU countries and make comparisons, or highlighting contrasts, with the patterns observed in the US. Their conclusions are somewhat vague, however, which appears to be a function of the difficulty of measurement: –

We only find mixed results for the impact of industrial robots on wage growth, even after accounting for potential endogeneity and potential offsetting effects across different population or sectoral groups.

…We believe that future research on the topic should focus on exploiting more granular data, to explore whether insignificant aggregate effects (on wages) are to the result of counterbalancing developments happening at the firm level.

Bruegel refrain from proposing cuts to personal taxation as favoured by the IEA, suggesting that a more complex policy response may be required, however, their conclusions are only marginally negative. I am inclined to hope that market forces may be allowed to deal with the majority of the adjustment; they have worked well if history is any guide.

Conclusions and investment opportunities

Ignoring the fact that we are nine years into an equity bull market and that interest rates are now rising from their lowest levels ever recorded, the long term potential for technology remains supportive for equity markets, for earnings growth and for productivity. If history repeats, or even if it simply rhymes, it should also be good for employment.

With interest rates looking more likely to rise than fall over the next few years, companies will remain reticent to invest in capital projects. Buying back stock and issuing the occasional special dividend will remain the policy du jour. Assuming we do not suffer a repeat of the great financial recession of 2008 – and that remains a distinct possibility – the boon of technology will create employment with one invisible hand as it creatively destroys it with the other (with apologies to Smith and Schumpeter). If governments can keep their budgets in check and resist the temptation to siphon off investment from the productive sectors of the economy (which, sadly, I doubt) then, in the long run, the capital investment required to create the employment opportunities of the future will materialise.

Inflation or Employment

Inflation or Employment

In the Long Run - small colour logo

Macro Letter – No 95 – 20-04-2018

Inflation or Employment

  • Inflationary fears are growing and US rates continue to rise
  • Employment has become more flexible since the crisis of 2008/2009
  • Commodity prices have risen but from multi-year lows
  • During the next recession job losses will rapidly temper inflationary pressures

Given the official policy response to the Great Financial Recession – a mixture of central bank balance sheet expansion, lower for longer interest rates and a general lack of fiscal rectitude on the part of developed nation governments – I believe there are two factors which are key for stock markets over the next few years, inflation and employment. The fact that these also happen to be the two mandated targets of the Federal Reserve – full employment and price stability – is more than coincidental. My struggle is in attempting to decide whether demand-pull inflation can survive the impact of a rapid rise in unemployment come the next recession.

Inflation and the Central Bankers response is clearly the new narrative of the financial markets. In his latest essay, Ben Hunt of Salient Partners makes some fascinating observations – Epsilon Theory: The Narrative Giveth and The Narrative Taketh Away:-

This market, like all markets, cares about two things and two things only — the price of money and the real return on invested capital. Or, as they are typically represented in cartoon form, interest rates and growth.

…This market, like all markets, needs a positive narrative on risk (the price of money) or reward (the real return on capital) to go up. Any narrative will do! But when neither risk nor reward is represented with a positive narrative, this market, like all markets, will go down. And that’s where we are today. 

Does the Fed have our back? No, they do not. They’ve told us and told us that they’re going to keep raising rates. And they will. The market still doesn’t fully believe them, and that’s going to be a constant source of market disappointment over the next few years. In the same way that markets go up as they climb a wall of worry, so do markets go down as they descend a wall of hope. The belief that central bankers care more about the stock market than the price stability of money is that wall of hope. It’s a forlorn hope.

The author goes on to discuss the way that inflation and the war on trade has derailed the global synchronized growth narrative. Dr Hunt writes at length about narratives; those who have been reading my letters for a while will know I regularly quote from his excellent Epsilon Theory.

The narrative has not yet become flesh, to coin a phrase, but in the author’s opinion it will:-

My view: the inflation narrative will surge again, as wage inflation is, in truth, not contained at all.

The trade war narrative hit markets in force in late February with the White House announcement on steel and aluminum tariffs. It subsided through mid-March as hope grew that Trump’s bark was worse than his bite, then resurfaced in late March with direct tariff threats against China, then subsided again on hopes that direct negotiations would contain the conflict, and has now resurfaced this past week with still more direct tariff threats against and from China. Already this weekend you’ve got Kudlow and other market missionaries trying to rekindle the hope of easy negotiations. But being “tough on trade” is a winning domestic political position for both Trump and Xi, and domestic politics ALWAYS trumps (no pun intended) international economics. 

My view: the trade war narrative will be spurred on by BOTH sides, and is, in truth, not contained at all.

The two charts below employ natural language processing techniques. They show how the inflation narrative has rapidly increased during the last 12 months. I shall leave Dr Hunt to elucidate:-

… analysis of a large set of market relevant articles — in this case everything Bloomberg has published that talks about inflation — where linguistic similarities create clusters of articles with similar meaning (essentially a linguistic “gravity model”), and where the dynamic relationships between and within these clusters can be measured over time.

epsilon-theory-the-narrative-giveth-and-the-narrative-taketh-away-april-10-2018-chart-one

Source: Quid.inc

What this chart shows is the clustering of content in 1,400 Bloomberg articles, which mention US inflation, between April 2016 and March 2017. The graduated colouring – blue earlier and red later in the year – enriches the analysis.

The next chart is for the period April 2017 to March 2018:-

epsilon-theory-the-narrative-giveth-and-the-narrative-taketh-away-april-10-2018-chart-two

Source: Quid.Inc

During this period there were 2,400 articles (a 75% increase) but, of more relevance is the dramatic increase in clustering.

What is clear from these charts is the rising importance of inflation as a potential driver of market direction. Yet there are contrary signals that suggest that economic and employment growth are already beginning to weaken. Can inflation continue to rise in the face of these headwinds. Writing in The Telegraph, Ambrose Evans-Pritchard has his doubts (this transcript is care of Mauldin Economics) – JP Morgan fears Fed “policy mistake” as US yield curve inverts:-

US jobs growth fizzled to stall-speed levels of 103,000 in March. The worldwide PMI gauge of manufacturing and services has dropped to a 14-month low. The average “Nowcast” tracker of global growth has slid suddenly to a quarterly rate of 3.2pc from 4.1pc as recently as early February.

Analysts at JP Morgan say the forward curve for the one-month Overnight Index Swap rate (OIS) – a market proxy for the Fed policy rate – has flattened and “inverted” two years ahead. This is a collective bet by big institutional investors and fund managers that interest rates may be falling by then.

…The OIS yield curve has inverted three times over the last two decades. In 1998 it proved to be a false alarm because the Greenspan Fed did a pirouette and flooded the system with liquidity. In 2000 it was a clear precursor of recession. In 2005 it signaled that the US housing boom was already starting to deflate.

…Growth of the “broad” M3 money supply in the US has slowed to a 2pc rate over the last three months (annualised)…pointing to a “growth recession” by early 2019. Narrow real M1 money has actually contracted slightly since November.

…RBC Capital Markets says this will drain M3 money by roughly $300bn a year…

…Three-month Libor rates – used to set the cost of borrowing on $9 trillion of US and global loans, and $200 trillion of derivatives – have surged 60 basis points since January.

…The signs of a slowdown are even clearer in Europe…Citigroup’s economic surprise index for the region has seen the worst four-month deterioration since 2008.  A reduction in the pace of QE from $80bn to $30bn a month has removed a key prop. The European Central Bank’s bond purchase programme expires altogether in September.

…The global money supply has been slowing since last September. The Baltic Dry Index measuring freight rates for dry goods peaked in mid-December and has since dropped 45pc.

Which brings us neatly to the commodity markets. Are real assets a safe place to hide in the coming inflationary (or perhaps stagflationary) environment? Will the lack of capital investment, resulting from the weakness in commodity prices following the financial crisis, feed through to cost-push inflation?

The trouble with commodities

Commodities are an excellent portfolio diversifier because they tend to be uncorrelated with stock, bonds or real estate. They have a weakness, however, since to invest in commodities one needs to accept that over the long run they have a negative real-expected return. Why? Because of man’s ingenuity. We improve our processes and invest in new technologies which reduce our production costs. We improve extraction techniques and enhance acreage yields. You cannot simply buy and hold commodities: they are trading assets.

Demand and supply of commodities globally is a complex challenge to measure; for grains, oilseeds and cotton the USDA World Agricultural Supply and Demand Estimates for March offers a fairly balanced picture:-

World 2017/18 wheat supplies increased this month by nearly 3.0 million tons as production is raised to a new record of 759.8 million

Global coarse grain production for 2017/18 is forecast 7.0 million tons lower than last month to 1,315.0 million

Global 2017/18 rice production is raised 1.2 million tons to a new record led by 0.3- million-ton increases each for Brazil, Burma, Pakistan, and the Philippines. Global rice exports are raised 0.8 million tons with a 0.3-million-ton increase for Thailand and 0.2- million-ton increases each for Burma, India, and Pakistan. Imports are raised 0.5 million tons for Indonesia and 0.3 million tons for Bangladesh. Global domestic use is reduced fractionally. With supplies increasing and total use decreasing, world ending stocks are raised 1.4 million tons to 144.4 million and are the second highest stocks on record.

Global oilseed production is lowered 5.7 million tons to 568.8 million, with a 6.1-million-ton reduction for soybean production and slightly higher projections for rapeseed, sunflower seed, copra, and palm kernel. Lower soybean production for Argentina, India, and Uruguay is partly offset by higher production for Brazil.

Cotton – Lower global beginning stocks this month result in lower projected 2017/18 ending stocks despite higher world production and lower consumption. World beginning stocks are 900,000 bales lower this month, largely attributable to historical revisions for Brazil and Australia. World production is about 250,000 bales higher as a larger Brazilian crop more than offsets a decline for Sudan. Consumption is about 400,000 bales lower as lower consumption in India, Indonesia, and some smaller countries more than offsets Vietnam’s increase. Ending stocks for 2017/18 are nearly 600,000 bales lower in total this month as reductions for Brazil, Sudan, the United States, and Australia more than offset an increase for Pakistan.

It is worth remembering that local market prices can be dramatically influenced by small changes in regional supply or demand and the vagaries of supply chain logistics. Added to which, for US grains there is heightened anxiety regarding tariffs: they are expected to be the main target of the Chinese retaliation.

Here is the price of US Wheat since 2007:-

Wheat since 2007

Source: Trading Economics

Crisis? What crisis? It is still near to multi-year lows, although above the nadir of the financial crisis in 2009.

The broader CRB Index shows a more pronounced recovery, it has been rising since the beginning of 2016:-

CRB Index since 2007 Core Commodity Indexes

Source: Reuters, Core Commodity Indexes

Neither of these charts suggest that price momentum is that robust.

Another (and, perhaps, more global) measure of economic activity is the Baltic Dry Freight Index. This chart shows a very different reaction to the synchronised increase in world economic growth:-

Baltic Dry Index - Quandl since 2007

Source: Quandl

In absolute terms the index has more than tripled in price from the 2016 low, nonetheless, it is still in the lower half of the range of the past decade.

Global economic growth may have encouraged a rebound in Copper, another industrial bellwether, but it appears to have lost some momentum of late:-

Copper Since 2007

Source: Trading Economics

Brent Crude Oil also appears to be benefitting from the increase in economic activity. It has doubled from its low of two years ago. The US rig count has increased in response but at 800 it remains at half the level of a few years ago:-

Brent Oil Since 2007

Source: Trading Economics

US Natural Gas, which might still manage an upward price spike on account of the unseasonably cold weather in the US, provides a less compelling argument:-

US Nat Gas Since 2007

Source: Trading Economics

Commodity markets are clearly off their multi-year lows, but the strength of momentum looks mixed and, in grains and oil seeds, global supply and demand look fairly balanced. Cost push inflation may be a factor in certain markets, but, without price-pull demand, inflation pressures are likely to be short-lived. Late cycle increases in commodity prices are quite common, however, so we may experience a short-run stagflationary squeeze on incomes.

Conclusions and investment opportunities

When ever I write about commodities in a collective way, I remind readers that each market is unique, pretending they are homogenous is often misleading. The recent rise in Cocoa, after a two-year downtrend resulting from an increase in global supply, is a classic example. The time it takes to grow a Cocoa plant governs the length of the cycle. Similarly, the lead time for producing a new ship is a major factor in determining the length of the freight rate cycle. Nonetheless, at the risk of contradicting myself, what may keep a bid under commodity markets is the low level of capital investment which has been a hall-mark of the long, listless recovery from the great financial recession. I believe an economic downturn is likely and job losses will occur rapidly in response.  

I entitled this letter ‘Inflation or Employment’, these are the factors which will dominate Central Bank policy. Currently commentators view inflation as the greater concern, as Dr Hunt’s research indicates, but I believe those Central Bankers who can (by which I mean the Federal Reserve) will attempt to insure they have raised interest rates to a level from which they can be cut, rather than having to rely on ever more unorthodox monetary policies.