The Beginning of the End of Uncertainty for the UK

The Beginning of the End of Uncertainty for the UK

In the Long Run - small colour logo

Macro Letter – No 124 – 20-12-2019

The Beginning of the End of Uncertainty for the UK

  • The UK election result was a clear mandate for Brexit
  • A UK/EU free-trade agreement may not be ready by December 2020
  • Uncertainty remains but real economic progress can now begin

For traders and investors in financial markets, risk and reward are two sides of a single coin. There are, of course, exceptions and geopolitical risk is one of them. The difficulty with geopolitical risk is that it is really geopolitical uncertainty. As Frank Knight observed back in 1921 in Risk, Uncertainty and Profitrisk is can be measured and forecast, uncertainty, cannot: –

Uncertainty must be taken in a sense radically distinct from the familiar notion of Risk, from which it has never been properly separated…. The essential fact is that ‘risk’ means in some cases a quantity susceptible of measurement, while at other times it is something distinctly not of this character; and there are far-reaching and crucial differences in the bearings of the phenomena depending on which of the two is really present and operating…. It will appear that a measurable uncertainty, or ‘risk’ proper, as we shall use the term, is so far different from an unmeasurable one that it is not in effect an uncertainty at all.

I have kept this in mind throughout my investing career and it is for this reason that I have avoided investing in the UK stock market since the Brexit referendum. The uncertainty surrounding Brexit has not disappeared, but I now have sufficient confidence in the decisiveness of the incumbent administration to believe that progress can at last be made. To judge by the immediate reaction of financial markets in the wake of the UK election result, I am not alone in my optimism.

To begin, here is a chart of G7 GDP since Q2 2016: –

GDP comparison since 2016

Source: OECD

The UK has fared better than Japan and Italy but its momentum has diminished relative to the remainder of G7.

A more nuanced view of the relative underperformance of the UK is revealed by comparison with Eurozone growth. The chart below, which starts in 2014, shows the switch from UK outperformance to underperformance which began even before the Brexit referendum in mid-2016: –

GDP UK v EU

Source: Eurostat, Full Fact

Whilst there are many factors which have contributed to this change in the UK growth rate, the principal factor has been uncertainty relating to Brexit.

Of course, the direct impact of the Brexit referendum was felt by Sterling. The chart below shows the (Trade-weighted) Sterling Effective Exchange Rate since 2016: –

Sterling Effective Exchange Rate since 2016

Source: Bank of England

The rise since August 2019 appears to predict the outcome of the election, but the currency still has far to rise if it is to return to pre-financial crisis levels, as this 20 year chart reveals: –

Sterling Effective Exchange Rate since 2000

Source: Bank of England

The strong upward momentum which began in 2012 was swiftly terminated by the political morass which culminated in the UK referendum. The unexpected outcome of the 2016 Brexit vote only served to exacerbate the malaise.

The weakness of Sterling merely accelerated the deterioration in the UK terms of trade. The UK has run a continuous trade deficit since 1998 but, as the chart below reveals, the deficit has become structural: –

UK Trade Balance

Source: ONS

Any significant imbalance in trade makes an economy sensitive to changes in the value of its currency. The fall in Sterling since 2016 has had a knock on effect on the rate of UK inflation: –

united-kingdom-inflation-cpi since 2016

Source: ONS, Trading Economics

Viewed from a 10 year perspective, the reversal is even more pronounced. UK interest rates would probably have been substantially lower during the last four years had it not been for the uncertainty surrounding Brexit: –

united-kingdom-inflation-cpi since 2010

Source: ONS, Trading Economics

Is optimism now justified?

Aside from the trade balance, the charts above are a reflection of the discount financial markets have imposed on the UK. This month’s election justifies a rerating. Whilst the markets have not been overly enamoured with the latest Tory Brexit deal they have been craving certainty. A working majority of 80 allows room for any Conservative dissenters to be quashed. Then there is the ‘Corbyn Factor.’ Promises of widespread nationalisation, without clarity about the price with which private investors would be compensated, did not sit well. Neither did the proposed tax increases required to fuel the £80bln increase in fiscal spending. That threat has now passed.

Finally there was clarification of the nation’s opinion on Brexit itself. Labour lost ground almost everywhere; to Tories and the Brexit party in England and Wales, whilst in Scotland they ceded ground to the SNP.

This summation of the UK situation is an over-simplification, but from a financial market perspective the UK political landscape has improved. Suffice to say, there remain many challenges ahead, not least the Brexit transition period (end 2020) during which a free-trade agreement (FTA) needs to be agreed to avert unnecessary trade disruption. After four years, one might hope there has been behind the scenes preparation and that much of the deal will be a slight amendment to current access arrangements. In reality to complete a deal by year-end 2020 it will have to be an ‘FTA-lite’ affair, which may prove less than satisfactory. A swift trade deal should, nonetheless, reduce uncertainty which is also in the interests of the EU. I remain sceptical, there may be many a slip twixt cup and lip.

Conclusions and Investment Opportunities

Four years of deferred investment and consumption will now gradually be unleashed. This should bolster Sterling. As the Pound rises inflation should fall. Assuming they do not give up on their inflation target, currency strength should prompt the Bank of England to ease monetary conditions. Gilt yields will decline, forcing investors to seek longer duration bonds or higher credit risk to compensate for the shortfall in returns. Companies will find it easier to issue debt in order to fuel capital expenditure: although I expect it may lead to more share buybacks too. UK equity markets will rise, driven by an improved outlook for inflation, a lowering of interest rates and expectations of stronger economic growth.

For equity investors, this rising tide will float most ships, but not all companies will benefit equally. Those firms which were at risk of nationalisation have been immediate beneficiaries. The chart below tracks their relative underperformance: –

UK Nationalisation Tragets v FTSE 350

Source: Bloomberg, The Economist

A longer term investment opportunity should be found in the FTSE 250. The four year picture is found below (FTSE 100 in blue, FTSE 250 in red): –

FTSE 100 vs 250 - 4yr

Source: AJ Bell

It might appear as if the FTSE 250 has already caught up with the FTSE 100, but this next chart reveals a rather different picture: –

FTSE 100 vs 250 10yr

Source: AJ Bell

The FTSE 250 is much more closely entwined with the fortunes of the domestic UK economy. For the past four years many business plans in the UK have been on hold, awaiting clarity on Brexit. Now that a deal will be done and an FTA with the EU will follow, we may have finally reached the beginning of the end of uncertainty.

Hard Brexit maths – walking away

400dpiLogo

Macro Letter – No 77 – 19-05-2017

Hard Brexit maths – walking away

  • The UK’s NIESR estimate the bill for Hard Brexit to the UK at EUR 66bln
  • I guesstimate the cost of Hard Brexit to the EU at EUR 62bln
  • Legal experts for both sides suggest UK obligations cease on Brexit
  • A Free-trade deal with the EU may not begin until after March 2019

…How selfhood begins with a walking away…

C. Day-Lewis

It has been estimated that if the UK accedes to EU demands for a further EUR 100bln in order to begin the process of establishing a bi-lateral trade deal with the EU post-Brexit, it will cost the UK economy 4.4% of GDP. According to estimates from the NIESR, to revert to WTO Most Favored Nation terms (the Hard Brexit option) would only cost between -2.7% and -3.7% of GDP (EUR 61bln to EUR 84bln).

In January UK MP May stated:-

No deal is better than a bad deal.

It looks, on this basis, as though the UK may indeed walk away from its purported EU obligations.

A more considered analysis from, the politically influential Brussels based thin-tank Bruegel – Divorce settlement or leaving the club? A breakdown of the Brexit bill – suggests a more modest final bill:-

Depending on the scenario, the long-run net Brexit bill could range from €25.4 billion to €65.1 billion, possibly with a large upfront UK payment followed by significant EU reimbursements later.

This substantial price range is due to the way the UK’s share of liabilities is calculated. At 12% (the UK’s rebate-adjusted share of EU commitments) it is EUR 25.4bln. At 15.7% (the UK’s gross contributions without a rebate adjustment) it rises to EUR 65.1bln.

The House of Lords legal interpretation – Brexit and the EU budget:-

Article 50 provides for a ‘guillotine’ after two years if a withdrawal agreement is not reached unless all Member States, including the UK, agree to extend negotiations. Although there are competing interpretations, we conclude that if agreement is not reached, all EU law—including provisions concerning ongoing financial contributions and machinery for adjudication—will cease to apply, and the UK would be subject to no enforceable obligation to make any financial contribution at all.

This suggests all of the UK’s commitments to the EU are linked to membership. If that legal interpretation is correct, there would be no Brexit bill at the moment of departure. Apparently EU legal experts have arrived at similar conclusions. The Telegraph – €100bn Brexit bill is ‘legally impossible’ to enforce, European Commission’s own lawyers admit has more on this contentious subject.

Setting aside the legal obligations in favour of a diplomatic solution, what is the price range where a potential agreement may lie? The cost to the UK appears to be capped at EUR 84bln in a worst case scenario. One may argue that the ability of Sterling to decline, thus improving the UK’s terms of trade, makes this scenario unrealistically high, but as I discussed in – Uncharted British waters – the risk to growth, the opportunity to reform historic evidence doesn’t support the case very well at all:-

Another factor to consider, since the June vote, is whether the weakness of Sterling will have a positive impact on the UK’s chronic balance of payments deficit. This post from John Ashcroft – The Saturday Economist – The great devaluation myth suggests that, if history even so much as rhymes, it will not:-

If devaluation solved the problems of the British Economy, the UK would have one of the strongest trade balances in the global economy…. the depreciation of sterling in 2008 did not lead to a significant improvement in the balance of payments. There was no “re balancing effect”. We always argued this would be the case. History and empirical observation provides the evidence.

There was no improvement in trade as a result of the exit from the ERM and the subsequent devaluation of 1992, despite allusions of policy makers to the contrary. Check out our chart of the day and the more extensive slide deck below.

Seven reasons why devaluation doesn’t improve the UK balance of payments …

1 Exporters Price to Market…and price in Currency…there is limited pass through effect for major exporters

2 Exporters and importers adopt a balanced portfolio approach via synthetic or natural hedging to offset the currency risks over the long term

3 Traders adopt a medium term view on currency trends better to take the margin boost or hit in the short term….rather than price out the currency move

4  Price Elasticities for imports are lower than for exports…The Marshall Lerner conditions are not satisfied…The price elasticities are too limited to offset the “lost revenue” effect

5  Imports of food, beverages, commodities, energy, oil and semi manufactures are relatively inelastic with regard to price. The price co-efficients are much weaker and almost inelastic with regard to imports

6 Imports form a significant part of exports, either as raw materials, components or semi manufactures. Devaluation increases the costs of exports as a result of devaluation

7 There is limited substitution effect or potential domestic supply side boost

8 Demand co-efficients are dominant


But what is the economic impact on the EU? CIVITAS – Potential post-Brexit tariff costs for EU-UK trade postulates some estimates:-

Our analysis shows that if the UK leaves the EU without a trade deal UK exporters could face the potential impact of £5.2 billion in tariffs on goods being sold to the EU. However, EU exporters will also face £12.9 billion in tariffs on goods coming to the UK.

Exporters to the UK in 22 of the 27 remaining EU member states face higher tariffs costs when selling their goods than UK exporters face when selling goods to those countries.

German exporters would have to deal with the impact of £3.4 billion of tariffs on goods they export to the UK. UK exporters in return would face £0.9 billion of tariffs on goods going to Germany.

French exporters could face £1.4 billion in tariffs on their products compared to UK exporters facing £0.7 billion. A similar pattern exists for all the UK’s major EU trading partners.

The biggest impact will be on exports of goods relating to vehicles, with tariffs in the region of £1.3 billion being applied to UK car-related exports going to the EU. This compares to £3.9 billion for the EU, including £1.8 billion in tariffs being applied to German car-related exports.

The net Trade Effect of a Hard Brexit on the basis of these calculations is EUR 7.7bln in favour of the UK.

Then we must consider the UK contribution to the EU budget, which, if the House of Lords assessment is confirmed, will be zero after Brexit. This will cost the EU EUR7.8bln, based on the 2017 net EU budget of EUR 134bln, to which the UK is currently the second largest contributor at 5.8%.

Next there is the question of the impact on EU27 economic growth. These headwinds will be felt especially in the Netherlands, Ireland and Cyprus but the largest absolute cost will be borne by Germany.

According to a February 2016 study by DZ Bank, a Hard Brexit would be to reduce German economic growth by -0.5%, from 1.7% to 1.4% – EUR 18.5bln. Credit Agricole published a similar study of the impact on the French economy in June 2016. They estimated that French GDP would be reduced by -0.4% in the event of a free-trade agreement and -0.6% in the event of a Hard Brexit – EUR 13.2bln. The Netherlands Bureau for Economic Policy Analysis (CPB) estimated the cost to the Netherlands at -1.2% – EUR 8.2bln. Italian Government forecasters estimate the impact at -0.5 to -1% – taking the best case scenario – EUR 8.3bln. A leaked Spanish Government report from March 2017 (interestingly, the only estimate I have been able to uncover since the Brexit vote) indicates a cost of between -0.17% and -0.34% of GDP – again, taking the best case – EUR 2bln. Ireland, given its geographic position, shared language and border, has, perhaps the closest ties with the UK of any EU27 country. Back in 2016 the Irish ERSI estimated the impact on Ireland at only -1%, I suspect it might be greater but I will take them at their word – EUR 2.6bln.

In the paragraph above I have looked at just five out of the EU27. Added together the cost to just these five countries is EUR 52.8bln, but I believe it to be representative, they accounted for 84.74% of EU GDP in 2016. From this I arrive at an extrapolated cost to the EU of a Hard Brexit of EUR 62.3bln.

The European Commission has indicated that the cost for the UK to begin negotiating the terms of a new free-trade agreement with the EU may be as much as EUR 100bln. The cost to the UK, of simply walking away – Hard Brexit – is estimated at between EUR 61bln and EUR 84bln per annum. The cost of Hard Brexit to the EU is estimated (I should probably say guesstimated, since there are so many uncertainties ahead) at EUR 62bln. A simple cost benefit analysis suggests that both sides have relatively similar amounts to lose in the short term. And I hate to admit it, but looked at from a negative point of view, in the long run, the UK, with its structural current account and trade deficit, may have less to lose from simply walking away.

Conclusion and Investment Opportunities

Brexit negotiations are already and will remain deeply political. From a short-term economic perspective it makes sense for the UK to walk away and re-establish its relationships with its European trading partners in the longer run. Given the UK trade deficit with the EU it has the economic whip-hand. Working on the assumption that Jean Claude Junker is not Teresa May’s secret weapon (after all, suggesting ever higher costs for negotiating a free-trade deal makes it more likely that the UK refuses to play ball) one needs to step back from the economics of the situation. The politics of Brexit are already and will probably become even more venal. For the sake of the UK economy, and, for that matter the economies of the EU, I believe it is better for the UK to walk away To those of you who have read my previous articles about Brexit, I wish to make clear, this is a change of opinion, politics has trumped economic common sense.

The implications for the UK financial markets over the next 22 months is uncertainty, although May’s decision to adopt a Hard Brexit starting point has mitigated a substantial part of these risks. Sterling is likely to act as the principle safety valve, however, a fall in the trade-weighted value of the currency will feed through to higher domestic inflation. Short term interest rates, and in their wake Gilt yields, are likely to rise in this scenario. Domestic stocks are also likely to be vulnerable to the negative impact of currency weakness and higher interest rates on economic growth. The FTSE 100, however, with 70% of its earnings derived from outside the UK, should remain relatively immune.

Which parts of the UK economy and which stocks will be the winners from Brexit?

400dpiLogo

Macro Letter – No 63 – 14-10-2016

Which parts of the UK economy and which stocks will be the winners from Brexit?

  • Sterling has fallen to its lowest since 1985 on fears of a “Hard Brexit”
  • UK stocks, led by the FTSE100, have rallied sharply
  • Sectors such as IT and Pharmaceuticals will benefit long-term
  • Even construction and financial services present investment opportunities

If you are in the habit of reading the mainstream financial press you will see headlines such as:-

The Times – Leak of gloomy Brexit forecast pushes pound to 31-year low – 12th October

The Economist – The pound and the fury – Brexit is making Britons poorer, and meaner – 11th October

Over the last three months, this has been typical of almost all financial media commentary. Sterling, meanwhile, has fallen, on a trade weighted basis, to a low not seen since the effective exchange rate index was recalibrated in 1990. At 73.79 it has even breached its close of December 2008 (73.855):-

sterling-effective-excahnge-rate-1990-2016

Source: Bank of England

The recent weakness in Sterling has been linked to the publication of parts of draft cabinet committee papers, suggesting UK revenues could drop by £66bln. From a technical perspective the “Flash Crash” in Cable (GBPUSD) last week has exacerbated the situation, creating the need for the currency to retest the low of 1.18 during normal market hours – the market reached 1.2086 on 11th – more downside is likely:-

gbpusd-2014-2016

Source: DailyFX.com

As the two charts above reveal, Sterling has weakened by 16% versus the US$ and by 18.5% on a trade-weighted basis.

Here is the chart of GBPUSD since 1953. It reinforces my expectation, from a technical perspective, that we will see further downside:-

cable-since-1953-fxtop

Source: fxtop.com

Given the seismic impact of a “Hard Brexit” on the UK economy, it would not be surprising to see a return to the February 1985 low of 1.0440.

I am not alone in my expectation of further weakness, Ashoka Mody – who organised the EU-IMF bailout of Ireland – told the Telegraph this week that Sterling was between 20% and 25% overvalued going into the Brexit vote.

Trade

The EU is the UK’s largest trading partner, accounting for 44% of goods and services exports in 2015 – though this was a decline the on previous year. Of greater concern to the neighbours, is the 53% of UK imports which emanate from the EU. In theory Sterling weakness should benefit UK exports; the impact has been minimal, so far:-

united-kingdom-exports-5yr

Source: Tradingeconomics.com, ONS

Similarly, imports should be falling – they are not:-

united-kingdom-imports-5yr

Source: Trading Economics, ONS

I discussed the prospects for UK growth and the effect of Sterling weakness on the balance of trade in Macro Letter – No 59 – 15-07-2016 – Uncharted British waters – the risk to growth, the opportunity to reform – quoting in turn from John Ashcroft – The Saturday Economist – The great devaluation myth:-

There was no improvement in trade as a result of the exit from the ERM and the subsequent devaluation of 1992, despite allusions of policy makers to the contrary.

…1 Exporters Price to Market…and price in Currency…there is limited pass through effect for major exporters

2 Exporters and importers adopt a balanced portfolio approach via synthetic or natural hedging to offset the currency risks over the long term

3 Traders adopt a medium term view on currency trends better to take the margin boost or hit in the short term….rather than price out the currency move

4 Price Elasticities for imports are lower than for exports…The Marshall Lerner conditions are not satisfied…The price elasticities are too limited to offset the “lost revenue” effect

5 Imports of food, beverages, commodities, energy, oil and semi manufactures are relatively inelastic with regard to price. The price co-efficients are much weaker and almost inelastic with regard to imports

6 Imports form a significant part of exports, either as raw materials, components or semi manufactures. Devaluation increases the costs of exports as a result of devaluation

7 There is limited substitution effect or potential domestic supply side boost

8 Demand co-efficients are dominant

If Sterling weakness will not improve the UK terms of trade, what will happen to growth? Again, in Macro Letter 59  I quote, Open Europe’s worst case scenario – that UK economic growth will be 2.2% less, on an annual basis, than its current trend, by 2030. Trend GDP growth between 1956 and 2015 averaged 2.46%. Is the media gloom justified and…

Are there any winners?

I concluded my July article saying:-

Companies with foreign earnings will be broadly immune to the vicissitudes of the UK economy, but domestic firms will underperform until there is more clarity about the future of our relationship with Europe and the rest of the world. The UK began trade talks with India last week and South Korea has expressed interest in similar discussions. Many other nations will follow, hoping, no doubt, that a deal with the UK can be agreed swiftly – unlike those with the EU or, indeed, the US. The future could be bright but markets will wait to see the light.

The UK stock market has already jumped the gun. The chart below shows the strong upward momentum of the FTSE100, dragging the, less international, FTSE250 in its wake; yet UK property has been hit hard by expectations of a slowdown in foreign demand:-

ambrosebexit

Source: Daily Telegraph

The obvious winners in the short term are companies with non-Sterling earnings – the constituents of the FTSE100 have an estimated 77% of overseas revenues – 47 of them pay their dividends in US$. The FTSE250 is not far behind, its members have 50% of foreign revenues. This is not dissimilar to the French CAC40 and German DAX. The table below lists the top and bottom ten FTSE350 companies by Sterling revenues:-

10 FTSE 350 companies with lowest sterling revenues
Company Sterling revenues
Vedanta Resources (VED) 0%
Hikma Pharmaceuticals (HIK) 0.20%
BHP Billiton (BLT) 0.30%
Antofagasta (ANT) 0.40%
Mondi (MNDI) 0.40%
Tate & Lyle (TATE) 0.60%
Rio Tinto (RIO) 0.70%
British American Tobacco (BATS) 1%
Laird (LRD) 1.60%
Victrex (VCT) 1.80%
10 FTSE 350 companies with highest sterling revenues
Company Sterling revenues
Saga (SAGAG) 69.80%
Capita (CPI) 70.40%
Wm Morrison (MRW) 70.60%
Booker Group (BOK) 70.80%
Intu Properties (INTU) 71.60%
Home Retail Group (HOME) 72.10%
OneSavings Bank (OSBO) 72.50%
Standard Life (SL) 88.90%
Grainger (GRI) 96.30%

Source: S&P Global Market Intelligence

Some of these companies are not exactly household names. Below is a table of the top 30 stocks in the FTSE100 by market capitalisation as at 28th September. The table also shows the year to date performance by stock as at 12th October:-

Company Ticker Sector Market cap-£mln (28-09) YTD (12-10) >50% Non-£ revenue % of non-£ revenue
Royal Dutch Shell RDSA Oil and gas 149,100 16.33% Yes 85%?
HSBC HSBA Banking 113,455 15.97% Yes
British American Tobacco BATS Tobacco 92,162 28.58% Yes 99%
BP BP Oil and gas 81,196 25.99% Yes 85%?
GlaxoSmithKline GSK Pharmaceuticals 80,629 32.02% Yes 91%
AstraZeneca AZN Pharmaceuticals 64,771 18.72% Yes 93%
Vodafone Group VOD Telecomms 59,259 6.10% Yes
Diageo DGE Beverages 55,931 20.41% Yes
Reckitt Benckiser RB Consumer goods 50,446 20.66% Yes
Unilever ULVR Consumer goods 46,917 32.18% Yes 85%?
Shire plc SHP Pharmaceuticals 45,899 16.56% Yes 96%
National Grid plc NG Energy 41,223 15.14% Yes
Lloyds Banking Group LLOY Banking 39,634 -29.62%
BT Group BT.A Telecomms 38,996 -15.03%
Imperial Brands IMB Tobacco 37,677 13.35% Yes
Prudential plc PRU Finance 35,544 -3.61% Yes 60%
Rio Tinto Group RIO Mining 34,715 6.72% Yes 99%
Glencore GLEN Mining 30,135 94.96% Yes
Barclays BARC Banking 28,089 -34.34% Yes
Compass Group CPG Food 24,528 37.40% Yes
WPP plc WPP Media 23,330 16.44% Yes 87%
BHP Billiton BLT Mining 23,169 5.18% Yes 97%
CRH plc CRH Building materials 21,314 50.45% Yes
Royal Bank of Scotland Group RBS Banking 20,799 -46.12%
Associated British Foods ABF Food 20,481 -27.11%
Standard Chartered STAN Banking 20,403 -9.76% Yes
Aviva AV. Insurance 17,925 -3.27% Yes 60%
BAE Systems BA. Military 16,698 16.87% Yes
RELX Group REL Publishing 15,842 27.83% Yes 85%?
SSE plc SSE Energy 15,548 -1.75%

Source: Stockchallenge.co.uk, Financial Times

The table indicates where non-Sterling revenues exceed 50% and, where I have been able to glean current data, the most recent percentage of international revenues. These 30 names represent 70% of the total market capitalisation of the FTSE100 Index. The positive impact of the fall in Sterling on the performance of the majority of these stocks is unequivocal.

On a sectoral basis this is a continuation of the price action evident in the week following the Brexit vote. The chart below was published by the FT on 29th June:-

ftse350-sectors-29-06-2016

Source: Bloomberg, FT

The underperforming sectors are not difficult to explain. Banks and Insurance companies, despite having international revenues, have been hurt by concerns about the loss of access to EU markets after Brexit. Real Estate remains nervous about a collapse in international demand, now the UK is no longer the gateway to Europe. Meanwhile, the retail and household sectors are likely to suffer as UK economic growth slows, consumer spending declines, inflation – driven by higher import prices – squeezes corporate profit margins and the Bank of England is forced to respond to higher consumer prices with monetary tightening.

Yet, looking at the table below, the dividend cover of the consumer sector is robust and the data we have seen since Brexit – retails sales +6.2% in July and 6.3% in August, combined with the rebound in consumer confidence – suggests that the consumer is what might be deemed serene:-

dividend-cover-ftse350-q4-2015

Source: Daily Telegraph, Highcharts

Other UK economic indicators also seem to be rebounding. Manufacturing PMI was 55.4 in September –its highest level since the middle of 2014. Services PMI, at 52.6, is still expanding and Construction PMI, at 52.3, has returned to growth. Rumours of the death of the consumer may be grossly exaggerated. Even consumer credit, which dipped in July, rebounded in August.

The “Sterling Effect” on stock valuation has more to deliver in the near-term, but once the currency stabilises this one-off benefit will diminish.

Who will the longer term winners be?

It is difficult to assess the long run impact of a “Hard Brexit” without reviewing the WTO – Most Favoured Nation – Tariff schedule for the EU. The trade weighted average tariff for 2013 was 3.2%, but on agricultural products it was a much higher 22.3% whilst it was only 2.3% on Non-Agricultural products:-

wto-eu-mft-tariffs-2015

Source: WTO

A “Hard Brexit” will probably entail a reversion to Most Favoured Nation terms with the EU under WTO rules.

The 18.5% decline in the Sterling Effective Exchange Rate means the cost to the UK of exporting, even agricultural products – excepting dairy – has been priced in. No wonder economists are busy revising their 2016/2017 growth forecasts higher – until Brexit actually happens, UK exports to the EU, and the majority of our other trading partners, will remain incredibly competitive.

Developing beyond this theme, a recent speech – The economic outlook – by Michael Saunders, a Bank of England MPC Member, reminded the Institute of Directors in Manchester:-

…we should not lose sight of the UK economy’s considerable supply-side advantages, with relatively flexible labour and product markets, openness to foreign investment, low-ish tax rates, strength in knowledge-intensive services and hi-tech manufacturing…

And the winners are…

This by no means an exhaustive list – some sectors are an obvious response to the decline in the currency, others are rather less certain.

Tourism – with the UK suddenly an inexpensive destination for tourists from around the world. In 2015, 7.3mln tourists visited the UK, of which 4.6mln were from the EU. Tourism Alliance estimates the UK tourist industry was worth £126.9bln in 2013. The chart below shows the volatile but upward sloping evolution of tourism revenues:-

united-kingdom-tourism-revenues

Source: Trading Economics, ONS

Here is an edited table of the Leisure and Travel constituents of the FTSE350, it excludes bookmakers, travel agents and airlines:-

Ticker Company
CCL Carnival
CINE Cineworld Group
CPG Compass Group
DOM Domino’s Pizza Group
FGP FirstGroup
GNK Greene King
GOG Go-Ahead Group
GVC GVC Holdings
IHG InterContinental Hotels Group
JDW Wetherspoon (J.D.)
MAB Mitchells & Butlers
MARS Marston’s
MERL Merlin Entertainments
MLC Millennium & Copthorne Hotels
NEX National Express Group
RNK Rank Group
RTN Restaurant Group
SGC Stagecoach Group
WTB Whitbread

Source: Shareprices.com

There should also be a positive impact on construction, as many operators, particularly within the unlisted sector, upgrade their facilities to capture the increased demand.

Not all the omens are positive; many of the jobs created by tourism are temporary and seasonal, the impact of a “Hard Brexit” is likely to lead to an increase in average earnings – good for employees, though not necessary for employers:-

united-kingdom-wage-growth-average-weekly-earnings

Source: Trading Economics, ONS

The trend in wage growth has been steady for several years, but as inflation picks up and UK immigration declines, wages will rise.

Value Added Industries such as IT, Technology, Pharmaceuticals – these are growth industries in which the UK has a comparative advantage. Typically their growth is delivered through productivity enhancing innovation. That they will also benefit, from a structurally lower exchange rate, is an added bonus.

Property and Construction should recover strongly – according to the Nationwide, UK house prices increased again in September. Only in central London, where stamp duty increases on higher value properties has undermined sentiment, have prices eased.

The UK has a shortage of residential property. Whether interest rates remain low or not, this situation will not change until there is genuine planning reform. The three largest housebuilders Barratt Developments (BDEV) Taylor Wimpey (TW) and Persimmon (PSN) are all trading with P/E ratios below 10 times. The only real concern is the difficulty these companies may experience in securing skilled manual labour – Barrett Developments source between 30% and 40% of their current workforce from mainland Europe.

There are other companies in the construction sector such as Balfour Beatty (BBY) Carillion (CLLN) and Kier Group (KIE) which will benefit from increased public investment in infrastructure projects. Monetary policy is nearing the end of its effectiveness – although the central banks still have plenty of stocks they could buy. The next step is to pass the gauntlet back to their respective governments’. I believe fiscal stimulus on a substantial scale will be the next phase.

Banking and Financial Services may seem like the last place to look for performance. The regulators have been tightening the noose since 2008 – as the current crisis at Deutsche Bank highlights, this trend has yet to run its course. However, challenger banks and shadow banking institutions, including hedge funds, are beginning to fill the void. In the days before the financialisation of the economy, banking was the servant of industry. The real-economy still needs banking and credit facilities. The oldest of the Peer to Peer lenders (unlisted) Zopa, announced their first securitisation this summer. After a decade of development their business it is finally coming of age.

The CMA – Making the Banks Work Harder For You – August 9th is certainly supportive for the digital disruptors of traditional banking. Government support is no guarantee of success but it’s easier to have them on your side.

You may argue that the success of companies such as Zopa are based on technological advantages but the recent history of banking has been about harnessing technology to increase trading volumes and reduce the costs of financial transactions. Growth in the profitability of financial services is integrally tied to advances in technology.

A final argument for Banks is the FTSE350 Banks Index:-

big

Source: Bigcharts.com

The high in 2007 was 11,263, the low in March 2009, 2,782 – a 75% decline. The index nearly doubled in in the next six months, reaching 5,224 in September of the same year. This June the index failed to break to a new low after the Brexit vote. A base is forming – the banking sector may not have seen the last of fines and regulation but I believe the downside is limited.

Uncharted British waters – the risk to growth, the opportunity to reform

400dpiLogo

Macro Letter – No 59 – 15-07-2016

Uncharted British waters – the risk to growth, the opportunity to reform

  • Uncertainty will delay investment and damage growth near term
  • A swift resolution of Britain’s trade relations with the EU is needed
  • Without an aggressive liberal reform agenda growth will be structurally lower
  • Sterling will remain subdued, Gilts, trade higher and large cap stocks well supported

Look, stranger, on this island now
The leaping light for your delight discovers,
Stand stable here
And silent be,
That through the channels of the ear
May wander like a river
The swaying sound of the sea.

W.H. Auden

thames-chart-collins-3057

Source: Captain Greenvile Collins – Great Britain’s Coasting Pilot – 1693

Captain Greenvile Collins was the Hydrographer in Ordinary – to William and Mary. His coastal pilot was the first, more or less, accurate guide to the coastline of England, Scotland and Wales, prior to this period mariners had relied mainly on Dutch charts. Collins’s charts do not comply with the convention of north being at the top and south at the bottom – the print above, of the Thames estuary, has north to the right. This, and the extract from W. H. Auden with which I began this letter, seem appropriate metaphors for the new way we need to navigate the financial markets of the UK post referendum.

Sterling has borne the brunt of the financial maelstrom, weakening against the currencies of all our major trading partners. Gilts have rallied on expectations of further largesse from the Bank of England (BoE) and a more generalised international flight to quality in “risk-free” government bonds. This saw Swiss Confederation bonds trade at negative yields to maturity out to 48 years.

With interest rates now at historic lows around the developed world and investors desperate for yield, almost regardless of risk, equity markets have remained well supported. Many individual UK companies with international earnings have made new all-time highs. Banks and construction companies have not fared so well.

Now the dust begins to settle, we have the more challenging task of anticipating the longer term implications of the British schism, both for the UK and its European neighbours. In this letter I will focus principally on the UK.

A Return to the Astrolabe?

Astrolabe

Source: University of Cambridge

The Greeks invented the astrolabe sometime around 200BCE. The one above of Islamic origin and dates from 1309. Before the invention of the sextant this was the only reliable means of navigation.

Our aids to navigation have been compromised by the maelstrom of Brexit – it’s not quite a return to the Astrolabe but we may have lost the use of GPS and AIS.

This week the OECD was forced to suspend the publication of its monthly Composite Leading Indicators (CLI). Commenting on the decision they said:-

The CLIs cannot…account for significant unforeseen or unexpected events, for example natural disasters, such as the earthquake, and subsequent events that affected Japan in March 2011, and that resulted in a suspension of CLI estimates for Japan in April and May 2011. The outcome of the recent Referendum in the United Kingdom is another such significant unexpected event, which is affecting the underlying expectation and outturn indicators used to construct the CLIs regularly published by the OECD, both for the UK and other OECD countries and emerging economies.

It will be difficult to draw any clear conclusions from the economic data produced by the OECD or other national and international agencies for some while.

Speaking to the BBC prior to the referendum, OECD Secretary General, Angel Gurria had already suggested that UK growth would be damaged:-

It is the equivalent to roughly missing out on about one month’s income within four years but then it carries on to 2030. That tax is going to be continued to be paid by Britons over time.

Back in March Open Europe – What if…? The consequences, challenges and opportunities facing Britain outside the EU put it thus:-

UK GDP could be 2.2% lower in 2030 if Britain leaves the EU and fails to strike a deal with the EU or reverts into protectionism. In a best case scenario, under which the UK manages to enter into liberal trade arrangements with the EU and the rest of the world, whilst pursuing large-scale deregulation at home, Britain could be better off by 1.6% of GDP in 2030. However, a far more realistic range is between a 0.8% permanent loss to GDP in 2030 and a 0.6% permanent gain in GDP in 2030, in scenarios where Britain mixes policy approaches.

…Based on economic modelling of the trade impacts of Brexit and analysis of the most significant pieces of EU regulation, if Britain left the EU on 1 January 2018, we estimate that in 2030:

In a worst case scenario, where the UK fails to strike a trade deal with the rest of the EU and does not pursue a free trade agenda, Gross Domestic Product (GDP) would be 2.2% lower than if the UK had remained inside the EU.

In a best case scenario, where the UK strikes a Free Trade Agreement (FTA) with the EU, pursues very ambitious deregulation of its economy and opens up almost fully to trade with the rest of the world, UK GDP would be 1.6% higher than if it had stayed within the EU.

Open_Europe_Brexit_Impact_Table

Source: Open Europe, Ciuriak Consulting

Given that UK annual GDP growth averaged 2.46% between 1956 and 2016, the range of outcomes is profoundly important. GDP forecasts are always prone to error but the range of outcomes indicated above is exceedingly broad – divination might prove as useful.

Also published prior to the referendum Global Counsel – BREXIT: the impact on the UK and the EU assessed the prospects both for the UK and EU in the event of a UK exit. The table below is an excellent summary, although I don’t entirely agree with all the points nor their impact assessment:-

Global_Counsel_-_Brexit

Source: Global Counsel

Another factor to consider, since the June vote, is whether the weakness of Sterling will have a positive impact on the UK’s chronic balance of payments deficit. This post from John Ashcroft – The Saturday Economist – The great devaluation myth suggests that, if history even so much as rhymes, it will not:-

If devaluation solved the problems of the British Economy, the UK would have one of the strongest trade balances in the global economy…. the depreciation of sterling in 2008 did not lead to a significant improvement in the balance of payments. There was no “re balancing effect”. We always argued this would be the case. History and empirical observation provides the evidence.

There was no improvement in trade as a result of the exit from the ERM and the subsequent devaluation of 1992, despite allusions of policy makers to the contrary. Check out our chart of the day and the more extensive slide deck below.

Seven reasons why devaluation doesn’t improve the UK balance of payments …

1 Exporters Price to Market…and price in Currency…there is limited pass through effect for major exporters

2 Exporters and importers adopt a balanced portfolio approach via synthetic or natural hedging to offset the currency risks over the long term

3 Traders adopt a medium term view on currency trends better to take the margin boost or hit in the short term….rather than price out the currency move

4  Price Elasticities for imports are lower than for exports…The Marshall Lerner conditions are not satisfied…The price elasticities are too limited to offset the “lost revenue” effect

5  Imports of food, beverages, commodities, energy, oil and semi manufactures are relatively inelastic with regard to price. The price co-efficients are much weaker and almost inelastic with regard to imports

6 Imports form a significant part of exports, either as raw materials, components or semi manufactures. Devaluation increases the costs of exports as a result of devaluation

7 There is limited substitution effect or potential domestic supply side boost

8 Demand co-efficients are dominant

Curiouser and Curiouser – the myth of devaluation continues. The 1992 experience….

“The UK’s trade performance since the onset of the economic downturn in 2008 has been one of the more curious developments in the UK economy” according to a recent report from the Office for National Statistics. “Explanation beyond exchange rates: trends in UK trade since 2007. 

We would argue, it is only curious for those who choose to ignore history. 

Much reference is made to the period 1990 – 1995 when the last “great depreciation led to an improvement in the balance of payments” – allegedly. Analysing the trade in goods data [BOKI] from the ONS own report demonstrates the failure of depreciation to improve the net trade in goods performance in the period 1990 – 1995.

Despite the fall in sterling, the inexorable structural decline in net trade in goods continued throughout. As we have long argued would be the case, in the most recent episode. Demand co-efficients are powerful, the price co-efficients much weaker and almost inelastic with regard to imports. Check out the slide show below for more information. 

The conclusions from the ONS report do not add up. Curiouser and Curiouser, policy makers just like Alice, sometimes choose to believe in as many as six impossible things before breakfast.

A brief history of devaluation from 1925 onwards…. 

The great devaluation of 1931 – 24%

In 1925, the dollar sterling exchange rate was $4.87. Britain had readopted the gold standard. Unfortunately, the relative high value of the pound placed considerable pressure on the trade and capital account, the balance of payments problem developed into a “run on the pound”. The UK left the gold standard in 1931, the floating pound quickly dropped to $3.69, providing an effective devaluation of 24%. The gain, if such it was, could not be sustained. Over the next two years, confidence in the currency returned, the dollar weakened, sterling rallied in value to a level of $5.00 but…Fears of conflict in Europe placed pressure on the sterling. In 1939, with the outbreak of World War II the rate dropped to $3.99 from $4.61. In March, 1940, the British government pegged the value of the pound to the dollar, at $4.03.

The great devaluation of 1949 – 30%

Post war, Britain was heavily indebted to the USA. Despite a soft loan agreement with repayments over fifty years, the pound remained once again under intense pressure In 1949 Stafford Cripps devalued the pound by over 30%, giving a rate of $2.80. 

The great devaluation of 1967 – 14%

In 1967 another “balance of payments” crisis developed in the British economy with a subsequent “run on the pound. Harold Wilson announced, in November 1967, the pound had been devalued by just over 14%, the dollar sterling exchange rate fell to $2.40. This the famous “pound in your pocket” devaluation. Wilson tried to reassure the country by pointing out that the devaluation would not affect the value of money within Britain. 

In 1971, currencies began to float, depreciation not devaluation became the guideline

In 1977, sterling fell against the dollar with pound plummeting to a low of $1.63 in the autumn 1976. Another sterling crisis and a run on the pound. The British government was forced to borrow from the IMF to bridge the capital gap. The princely sum of £2.3 billion was required to restore confidence in the pound.  

By 1981, the pound was trading back at the $2.40 level but not for long. Parity was the pursuit by 1985 as the pound fell in value to a month low of $1.09 in February 1985.

In the late 1980s, Chancellor Lawson was pegging the pound to the Deutsche Mark to establish some form of stability for the currency. In October of 1990, Chancellor Major persuaded Cabinet to enter the ERM, the European Exchange Rate Mechanism. The DM rate was 2.95 to the pound and $1.9454 against the dollar. 

Less than two years later, Britain left the European experiment. 

The strains of holding the currency within the trading band had pushed interest rates to 12% in September, with some suggestions that rates would have to rise to 20% to maintain the peg. 

In September 1992, Chancellor Lamont announced the withdrawal from the ERM. The Pound fell in value against the dollar from $1.94 to $1.43, an effective depreciation of 26%. According to the wider Bank of England Exchange rate the weighted depreciation was 15%. 

The chart below shows GBPUSD since 1953, it doesn’t capture everything mentioned above but it highlights the volatility and terminal decline of the world’s ex-reserve currency:-

Cable since 1953

Source: FX Top

Reform, reform, reform

The UK needs to renegotiate terms with the EU as quickly as possible in order to minimise the damage to UK and global economic growth. I believe there are four options: –

EEA – the Norwegian Option

Pros

  • Maintain access to the Single Market in goods and services and movement of capital.
  • Ability to negotiate own trade deals.
  • Least disruptive alternative to EU membership.

Cons

  • Commitment to free movement of people and the provision of welfare benefits to EU citizens.
  • Accept EU regulation but have no influence over them.
  • Must comply with “rules of origin” – which impose controls on the use of products from outside the EU in goods which are subsequently exported within the EU. The cost of determining the origin of products is estimated to be at least 3.0% – the average tariff on goods from the US and Australia is 2.3% under World Trade Organisation (WTO) rules.
  • Comply with EU rules on employment, consumer protection, environmental protection and competition policy.
  • Pay an annual fee to access the Single Market, although less than for full EU membership.

EFTA – the Swiss Option

Pros

  • Maintain access to the Single Market in goods.
  • Ability to negotiate own trade deals.
  • Greater independence over the direction of social and employment law.

Cons

  • Commitment to free movement of people.
  • Must comply with “rules of origin”.
  • Restricted access to the EU market in services – particularly financial services.

WTO – the Default Option

Pros

  • Subject to Most Favoured Nation tariffs under WTO guidelines. In 2013, the EU’s trade-weighted average MFN tariff was 2.3% for non-agricultural products.
  • Ability to negotiate own trade deals.
  • Independence over legislation.

Cons

  • Tariffs on agricultural products range from 20% to 30%.
  • Tariffs for automobiles are 10%.
  • Services sector would face higher levels of non-tariff barriers such as domestic laws, regulations and supervision. Services made up 37% of total UK exports to the EU in 2014 – the WTO option will be costly.

Bilateral Free-Trade Agreement – the Canadian Option

Pros

  • Negotiate a bilateral trade agreement with the EU – sometimes called the Canada option after the, still unratified, Comprehensive Economic and Trade Agreement (CETA).

Cons

  • Must comply with “rules of origin” – if it mirrors the CETA deal.
  • Services are only partially covered.
  • Negotiations may take years.

The quickest solution would be the WTO default option, the least cathartic would be to join the EEA. I suspect we will end up somewhere between these two extremes; The Peterson Institute – Theresa May—More Merkel than Thatcher? Is of a different opinion:-

To survive politically at home, May must deliver Brexit at almost any cost, suggesting that she might well in the end be compelled to accept a “hard Brexit” that puts the UK entirely outside the internal market. Lacking a public mandate in a fractious party that retains only a slim parliamentary majority, May not surprisingly opposes new general elections, which would focus on Brexit and thus easily cost the Conservatives their majority, along with their new prime minister’s job. Unless the UK suffers substantially additional economic hardship in the coming years, the next UK elections may well occur as late as 2020.

For the financial markets there is a certain elegance in the “hard Brexit” WTO option. Uncertainty is removed, unilateral trade negotiations can be undertaken immediately and the other options remain available in the longer term.

Beyond renegotiation with the EU there is a broader reform agenda. Dust off your copy of Hayek’s The Road to Serfdom, this could see a return to the liberal policies, of smaller government and freer trade, which we last witnessed in the 1980’s. The IEA’s Ryan Bourne wrote an article this week for City AM – Forget populist executive pay curbs: Prime Minister May should embrace these six policies to revitalise growth in which he advocated:-

1) Overhaul property taxation: the government should abolish both council tax and stamp duty entirely and replace them with a single tax on the “consumption” of property – i.e. a tax on imputed rent. It is well known among economists that taxes on transactions like stamp duty are highly damaging, and we have already seen the high top rates significantly slow transactions since April.

2) Abolish corporation tax entirely: profit taxes discourage capital investment by lowering returns, which makes workers less productive and results in lower wage growth. In a globalised world, profits taxation also encourages capital to move elsewhere, both because it makes the UK less attractive as a location for “real” economic activity and because it creates incentives for avoidance through complex business structures. Rather than continuing this goose chase, let’s abolish it entirely and tax dividends at an individual level, as Estonia does.

Read more: Ignore Google’s corporation tax bill and scrap the tax altogether

3) Planning liberalisation: if you ask anyone to name the UK’s main economic problems, you’ll probably hear “poor productivity performance”, “a high cost of living” and “entrenched economic difficulties in some areas”. Constraining development through artificial boundaries and regulations is acknowledged to be a key driver of high house price inflation. Less acknowledged is that, for sectors like childcare, social care, restaurants and even many office-based industries, high rents and property prices raise other prices for consumers, with a dynamic strain on our growth prospects brought about by a reduction in competition and innovation. That’s not to mention the impact on labour mobility. Liberalisation of planning, including greenbelt reform – which May has sadly already seemingly ruled out – is probably the closest thing to a silver bullet as far as productivity improvements are concerned.

4) Sensible energy policy: the UK government has gone further than many EU countries on the “green agenda”. But the EU’s framework, with binding targets for renewables, has certainly helped shape policy in the direction of subsidies and subsidy-like obligations and interventions. Even if one accepts the need to reduce carbon emissions, an economist would suggest the implementation of either a straight carbon tax or, less optimally, a cap-and-trade scheme, rather than the current raft of interventions which make energy more expensive than it need be.

5) Agricultural liberalisation: exiting the EU Common Agricultural Policy gives us the opportunity to reassess agricultural policy. The UK should gradually phase out all subsidies, as New Zealand did, opening up the sector to global competition. This improved agricultural productivity in that country significantly. Combined with a policy of unilateral free trade, it would deliver substantially lower food prices for consumers too.

6) Deregulation: in the long term, Britain should extricate itself from the Single Market and May should set up a new Office for Deregulation, tasked with examining all existing EU laws and directives, with the clear aim of removing unnecessary burdens and lowering costs. In particular, this should focus on labour market regulation, financial services, banking and transport

In a departure from my normal focus on the nexus of macroeconomics and financial markets I wrote a reformist article last week for the Cobden Centre – A Plan to Engender Prosperity in Perfidious Albion – from Pariah to Paragon; in it, I made some additional reform proposals:-

Banking Reform: The financialisation of the UK economy has reached a point where productive, long term capital investment is in structural decline. Increasing bank capital requirements by 1% per annum and abolishing a zero weighting for government securities would go a long way to reversing this pernicious trend.

Monetary Reform: The key to long term prosperity is productivity growth. The key to productivity growth is investment in the processes of production. Interest rates (the price of money) in a free market, act as the investment signal. Free banking (a banking system without a lender of last resort) is a concept which all developed countries have rejected. Whilst the adoptions of Free banking is, perhaps, too extreme for credible consideration in the aftermath of Brexit, a move towards the free-market setting of interest rates is desirable to attempt to avert any further malinvestment of capital.

Labour Market Reform: A repeal of the Working Time Directive and the Agency Workers Directive would be a good start but we must resist the temptation to close our borders to immigration. Immigrants, both regional and international, have been essential to the economic prosperity of Britain for centuries. There will always be individual winners and losers from this process, therefore, the strain on public services should be addressed by introducing a contribution-based welfare system that ensures welfare for all – migrants and non-migrants – contingent upon a record of work.

Educational Reform: investment in technology to deliver education more efficiently would yield the greatest productivity gains but a reform of the incentives based on individual choice would also help to improve the quality of provision.

Free Trade Reform: David Ricardo defined the economic law of comparative advantage. In the aftermath of the UK exit from the EU it would be easy for the UK to slide towards introspection, especially if our European trading partners close ranks. We should resist this temptation if at all possible; it will undermine the long term productivity of the economy. We should promote global free trade, unilaterally, through our membership of the World Trade Organisation. In the last 43 years we have lost the art of negotiating trade deals for ourselves. It will take time to reacquire these skills but gradual withdrawal from the EU by way of the EEA/EFTA option would give the UK time to adjust. The EEA might even prove an acceptable longer term solution. I suspect the countries of EFTA will be keen to collaborate with us.

We should apply to rejoin the International Organization for Standardization , the International Electrotechnical Commission , and the International Telecommunication Union (all of which are based in Geneva) and, under the auspices of EFTA, we can rejoin the European Committee for Standardization (CEN), the European Committee for Electrotechnical Standardization (CENELEC), the European Telecommunications Standards Institute (ETSI), and the Institute for Reference Materials and Measurements (IRMM).

Conclusion

Financial markets will remain unsettled for an extended period; domestic capital investment will be delayed, whilst international investment may be cancelled altogether. If growth slows, and I believe it will, further easing of official interest rates and renewed quantitative easing are likely from the BoE. Gilts will trade higher, pension funds and insurance companies will continue to purchase these fixed income assets but the BoE will acquire an ever larger percentage of outstanding issuance. In 2007 Pensions and Insurers held nearly 50%, with Banks and Building Societies accounting for 17% of issuance. By Q3 2014 Pensions and Insurers share had fallen to 29%, Banks and Building Societies to 9%. Over seven years, the BoE had acquired 25% of the entire Gilt issuance.

Companies with foreign earnings will be broadly immune to the vicissitudes of the UK economy, but domestic firms will underperform until there is more clarity about the future of our relationship with Europe and the rest of the world. The UK began trade talks with India last week and South Korea has expressed interest in similar discussions. Many other nations will follow, hoping, no doubt, that a deal with the UK can be agreed swiftly – unlike those with the EU or, indeed, the US. The future could be bright but markets will wait to see the light.


Which way now – FTSE, Gilts, Sterling and the EU referendum?

400dpiLogo

Macro Letter – No 39 – 03-07-2015

Which way now – FTSE, Gilts, Sterling and the EU referendum?

  • Uncertainty is bad for business and the UK will struggle ahead of the referendum
  • Gilt yields have been around 150bps higher than Bunds over the last 25yrs
  • The DAX has substantially outperformed FTSE over the same period
  • Higher productivity is key to UK growth but, in the long run, demographics will help

Last week the UK Prime Minister began to debate EU treaty reform with his European counterparts. He has a long way to go. The deadline for a UK referendum on EU membership is the end of 2017 but an up-hill battle is likely because all EU countries must ratify treaty changes – the referendum will come before EU treaty changes have been agreed. In this letter I will review the history of UKs, uncomfortable, membership of the EU and previous renegotiations, compared with today’s proposals. I will then go on to consider the implications for Sterling, Gilts and UK Stocks should the UK decide to stay or go.

A brief history of the UK and the EU

The last time the UK voted on EU, or as it was then called, European Economic Community (EEC) membership, was in 1975. At that time the “yes” vote won by 67.5%. This took place only two years after first joining, previous attempts to join in 1961 and 1967 having been vetoed by French President de Gaulle.

British scepticism about the political ambitions of the Schuman declaration of May 1950 meant the UK failed to join the European Coal and Steel Community – established at the Treaty of Paris in 1951 – but spent much of the decade debating EEC membership. When the EEC was finally established in 1958, the UK opted out for two principal reasons: concern about its relationship with the Commonwealth and other international alliances, and its preference for free-trade over economic organisation and sectoral policies. At that time the UK was torn between two foreign policy strategies, one focused on the European Free Trade Area, the other on the General Agreement on Tariffs and Trades – the predecessor to the World Trade Organisation (WTO).

The 1974 treaty renegotiation, just a year after joining the EEC, was driven by three factors: free-trade versus political integration, the effects of the collapse of Bretton Woods and subsequent inflation on the UK economy – Sterling had been considered a quasi-reserve currency up to this point – and the size of UK contributions to the EEC budget which the UK government considered to be excessive.

The table below lists the 1974 UK government demands for renegotiation and the outcomes:-

DEMAND OUTCOME
Changes to CAP so as not to undermine free-trade None
Fairer financing of EEC budget Correcting mechanism
Withdrawal of UK from EMU Accepted
Retention of UK powers over regional, industrial and fiscal policy Creation of Regional Development fund supported by Ireland and Italy
Agreement on capital movement to protect UK jobs and balance of payments None
No harmonisation of VAT Never planned anyway
Access to Commonwealth goods Minor concessions

The next major test of the UK relationship with the EU came during Margaret Thatcher’s first Conservative government (1979-1983) although an agreement with the EEC was not reached until her second term in 1984. On this occasion the issue was simply a question of how much the UK was paying in to the EU budget given that 80% of that budget was then spent on maintaining the Common Agricultural policy (CAP). The UK “rebate” was sanctioned because at that time the UK was the second poorest of the ten member EEC.

UK demands for treaty change 2015

The current UK renegotiation of EU membership is concerned with the following issues:-

Restrictions to freedom of movement within the EU
Sovereignty of Sterling
Structural reform of the EU bureaucracy
Reclaiming of powers from Brussels to protect UK interests

On the latter point, this takes two principal forms: the ability to block EU legislation where it may be detrimental to UK interests and the ending of a commitment to “ever closer union” in respect of UK membership.

The Sovereignty of Sterling is a relatively uncontentious issue, whilst structural reform of the EU bureaucracy is an ideal to which all European governments will accede, at least in principal; the problems arise over restrictions on free-movement of people – enshrined in Article 48 of the Treaty of Rome:-

1.Freedom of movement for workers shall be secured within the Community by the end of the transitional period at the latest. 2. Such freedom of movement shall entail the abolition of any discrimination based on nationality between workers of the Member States as regards employment, remuneration and other conditions of work and employment. 3. It shall entail the right, subject to limitations justified on grounds of public policy, public security or public health: (a) to accept offers of employment actually made; (b) to move freely within the territory of Member States for this purpose; (c) to stay in a Member State for the purpose of employment in accordance with the provisions governing the employment of nationals of that State laid down by law, regulation or administrative action; (d) to remain in the territory of a Member State after having been employed in that State, subject to conditions which shall be embodied in implementing regulations to be drawn up by the Commission. 4. The provisions of this Article shall not apply to employment in the public service.

This leaves, the reclaiming of powers from Brussels. “Ever closer union” is probably negotiable since EU member states have always moved at different rates, both economically and culturally. Allowing the UK to pick and choose which aspects of EU legislation it accepts, however, is like joining an exclusive club and then ignoring the rules. Under normal circumstances you’d be asked to leave.

One of the associated problems for the EU – that of, when to stop expanding – is discussed in this essay by Tim Price – Let’s Stick Together. He reviews the work of Leopold Kohr, in particular his seminal work “The Breakdown of Nations”:-

It all comes down to scale. As Kirkpatrick Sale puts it in his foreword to ‘The Breakdown of Nations’,

“What matters in the affairs of a nation, just as in the affairs of a building, say, is the size of the unit. A building is too big when it can no longer provide its dwellers with the services they expect – running water, waste disposal, heat, electricity, elevators and the like – without these taking up so much room that there is not enough left over for living space, a phenomenon that actually begins to happen in a building over about ninety or a hundred floors. A nation becomes too big when it can no longer provide its citizens with the services they expect – defence, roads, post, health, coins, courts and the like – without amassing such complex institutions and bureaucracies that they actually end up preventing the very ends they are intending to achieve, a phenomenon that is now commonplace in the modern industrialized world. It is not the character of the building or the nation that matters, nor is it the virtue of the agents or leaders that matters, but rather the size of the unit: even saints asked to administer a building of 400 floors or a nation of 200 million people would find the job impossible.”

Kohr showed that there are unavoidable limits to the growth of societies:

“..social problems have the unfortunate tendency to grow at a geometric ratio with the growth of an organism of which they are a part, while the ability of man to cope with them, if it can be extended at all, grows only at an arithmetic ratio.”

In the real world, there are finite limits beyond which it does not make sense to grow. Kohr argued that only small states can have true democracies, because only in small states can the citizen have some direct influence over the governing authorities.

What’s in it for the UK

In the interests of levity I’ve included a link to this summation of UK foreign policy with regard to Europe from the satirical TV programme Yes, Minister – this episode was first aired in 1980.

In the intervening 35 years, trying to decipher what is best for the UK has not become any easier. I’ve chosen just two organisations to represent the views for and against EU membership: Business for New Europe and Better off Out. Here’s how Business for New Europe make the case for staying in:-

As a member of the European Union, our companies can sell, without barriers, to a market of 500 million people. The Single Market means that exporters only need to abide by one set of European regulations, instead of 28 national ones. Europe is our biggest trading partner- it buys 45% of our exports. If we left the EU, companies would face tariffs and regulatory barriers to trade.

The free movement of capital means that EU companies can invest here in Britain freely. This investment, by companies like Siemens, creates jobs and grows our economy. 46% of all the foreign investment in Britain came from EU countries.

The EU provides funding for businesses to all regions of Britain, particularly those with the greatest need. From 2014 until 2020, £8 billion of EU money will go from Brussels to the UK. The biggest winners from this process are Cornwall, Wales, the Scottish Highlands, Northern Ireland and the North of England.

EU research funding helps universities and firms innovate to create the technologies of the future. Britain will receive £7 billion from the EU’s Horizon 2020 fund, and our small businesses receive more funding for hi-tech research than those of any other EU country. EU membership is vital to rebalancing the British economy.  

Better off Out – sponsored by the Freedom Association – counter thus:-

10 Reasons to Leave

1.Freedom to make stronger trade deals with other nations. 2. Freedom to spend UK resources presently through EU membership in the UK to the advantage of our citizens. 3. Freedom to control our national borders. 4. Freedom to restore Britain’s special legal system. 5. Freedom to deregulate the EU’s costly mass of laws. 6. Freedom to make major savings for British consumers. 7. Freedom to improve the British economy and generate more jobs. 8. Freedom to regenerate Britain’s fisheries. 9. Freedom to save the NHS from EU threats to undermine it by harmonising healthcare across the EU, and to reduce welfare payments to non-UK EU citizens. 10. Freedom to restore British customs and traditions.

They go on to highlight 10 Myths about the risk of leaving – not all are economic so I’ve paraphrased their opinions below;-

Britain would lose 3mln jobs if we left the EU – Under the terms of the Lisbon Treaty the UK would enter into an FTA with the EU. The WTO obliges them to do so too. Of more importance the UK trade balance will the EU is in increasing deficit – the other member states have more to lose.

Britain will be excluded from trade with the EU by Tariff Barriers – EU has FTAs with 53 countries with a further 74 countries pending. In 2009 UK charged customs duty of just 1.76% on non-EU imports. The EU Common Market is basically redundant already.

Britain cannot survive economically outside the EU in a world of trading blocs – Japan does and it’s not a member. The EU’s share of world GDP is forecast to be 15% in 2020, down from 26% in 1980. Norway and Switzerland export more, per capita, to the EU than the UK does. Britain’s best trading relationships are with the USA and Switzerland. The largest investor in the UK is US.

The EU is moving towards the UK’s position on cutting regulation and bureaucracy – EU directives are subject to a ‘rachet’ effect – once in place they are unlikely to be reformed or repealed. 80% of the UK’s GDP is generated within the UK so should not be subject to EU laws. In 2010, Open Europe estimated EU regulation had cost Britain £124 billion since 1998.

If we leave, Britain will have to pay billions to the EU and implement all its regulations without having a say – The UK has 8.4% of votes. The Lisbon Treaty ensured the loss of Britain’s veto in many more policy areas.

Swiss Case Study: The Swiss pay the EU less than CHF600mln a year for access to the EU market. They estimate the cost of full membership would be CHF3.4bln.

Norway Case Study: In 2009 Norway’s total financial contributions to the EEA (European Economic Area) agreement was Eur340mln Britain pays £18.4bln per annum.

The EU has a positive impact on the British Economy – Fishing (115,000 jobs lost) farming, postal services and manufacturing have been devastated by EU membership. Unnecessary red tape, aid contributions, inflated consumer prices (due to CAP etc.) are indirect costs.

Britain will lose vital foreign investment as a consequence of leaving the EU – The 2010 Ernst and Young survey on UK’s attractiveness to foreign investors, found Britain still the number one Foreign Direct Investment (FDI) destination in Europe owing largely to the City of London and the UK’s close corporate relationship with the US. Key factors, in order of importance:-

Culture and values, English language, Telecommunications infrastructure, Quality of life, Stable social environment, Transport and logistics infrastructure.

Britain will lose all influence in the world by being outside the EU – Britain has a substantial ‘portfolio of power’ including membership of the G20 and G8, a permanent seat on the UN Security Council and seats on the IMF and WTO. The British Commonwealth has 54 nations which is being discriminated against by EU policy. London is the financial capital of the world and Britain has the sixth largest economy. The UK is also in the top ten manufacturing nations in the world.

Legally, Britain cannot leave the EU – A single clause Bill passed at Westminster can repeal the European Communities Act 1972 and its attendant Amendment Acts.

Having dealt with the main arguments for remaining in the EU, Better off Out do point out that creating an FTA with the EU may take time.

Greenland established a precedent when it left the EEC in 1985, this followed a referendum in 1982 and the signing of the Greenland Treaty in 1984. It had joined, as part of Denmark in 1973 but after it had achieved home rule in 1979 the importance of its fishing industry became a major economic incentive for it to leave the forerunner to the EU.

Greece may leave as early as next week and, as this March 2015 article from ECFR – The British problem and what it means for Europe makes clear, a Brexit will not be good for the EU either:-

An EU without Britain would be smaller, poorer, and less influential on the world stage. The UK makes up nearly 12.5 percent of the EU’s population, 14.8 percent of its economy, and 19.4 percent of its exports (excluding intra-EU trade). Furthermore, it runs a trade deficit of £28 billion, is home to around two million other EU citizens, and remains one of the largest net contributors to the EU budget (responsible for 12 percent of the budget in total).

Meanwhile the Confederation of British Industry claim that being a member of the EU is worth £3,000 per household whilst Business for Britain estimate that the UK would save £933 per person from cheaper food if they left. In a report last week S&P chimed in, saying 30% of foreign direct investment (FDI) into the UK – representing 17% of GDP – was directed to financial services and insurance. 50% of this FDI emanated from other EU countries – this could be at risk if the UK should leave. So the debate rumbles on.

How is the UK economy evolving?

UK manufacturing has been in decline since the start of the millennium, whilst this decline was initially a reaction to the strength of Sterling it has yet to benefit from the subsequent weakness of the currency:-

UK_Effective_Exchange_Rate_and_Manufacturing

Source: ERC, IMF, UN

Total factor productivity is near the heart of this conundrum:-

UK_TFP_vs_G7

Source: ERC, ONS

The UK is lying 6th out of the G7 in terms of output per hours worked, and since 2007, has underperformed the G7 average. The dotted line shows where productivity would have been had the recession not hit. The UK had been lagging its peers during the 1990’s so the predicted outperformance would merely have brought it back into the fold.

In a speech given last week the BoE’s Sir John Cunliffe – Pay and productivity: the next phase made a number of observations about the future:-

Between 2000 and 2007, the average worker in the UK automotive manufacturing industry produced 7.7 vehicles a year. Over the past seven years he/she averaged 9.8 vehicles a year. Productivity – output per worker – in car manufacturing has increased by 30% since the onset of the great financial crisis. Britain has become the fourth-biggest vehicle maker in the EU and is more efficient than bigger producers such as Germany and France.

Unfortunately productivity in the UK has not followed the lead of the car industry. Indeed, the opposite is true. In 2014 labour productivity in the UK was actually slightly lower than its 2007 level. In the seven years between 2000 and 2007 labour productivity grew at an average annual rate of about 2% a year. In the seven years that followed, our annual productivity growth averaged just below zero.

Or to look at it another way, the level of labour productivity – output per hour worked – in the UK economy is now 15% below where it would have been if pre-crisis trends had continued.

…It is true that the average output per hour of the rest of the G7 advanced economies is only around 5% above its pre-crisis level. But as I have noted, in the UK it has not even recovered to that level. And in 2013 output per hour in the UK was 17 percentage points below the average for the rest of the G7 – the widest gap since 1992.

In the 10 years prior to the crisis, growth in the hours worked in the UK economy, accounted for 23% of the UK’s overall economic growth. The mainstay of our economic growth, the other 77%, came from growth in productivity. Since 2013 only 9% of our annual economic growth has come from productivity improvement. The remaining 91% has come from the increase in the total hours worked.

As a result, employment in the UK is now around its highest rate since comparable records began in 1971. Over 73% of people aged 16-64 are working. There are now over 31 million people in work in the UK.   Unemployment has fallen at among its fastest rate for 40 years and is now very close to its pre-crisis level – over the past two years over 1 million jobs have been created.

Productivity growth can be divided into two sorts of change: the change in productivity inside individual firms and the changes between firms. The first, the changes within firms, happens as firms increase their efficiency. The second happens as labour and capital are reallocated between firms, from the less productive ones to the more productive.

After collapsing in the crisis, productivity began to increase again within firms two years ago. We expect that to continue. As the economy grows, spare capacity is used up. The real cost of labour increases relative to the cost of investment. Firms have a greater incentive to find efficiency gains and to switch away from more labour-intensive forms of production. This should boost productivity.

In contrast, productivity growth due to the reallocation of resources in the economy remains weak. We can see this in the divergence of rates of returns across firms which remain remarkably and unusually high and the change in capital across sectors which has been particularly low. When the reallocation mechanism is working, the transfer of capital and labour from the less productive to the more productive pulls up the level of productivity in the economy and reduces the divergence between firms. The high degree of divergence between firms at present implies that this reallocation mechanism is working significantly less powerfully now than before the crisis. This can also be seen in the proportion of loss-making firms which stands at around 20% higher than its long-run average. Company liquidations also remain low. So there is still more than a hint of ‘zombiness’ in the corporate sector.

For more on productivity issue this working paper BoE – The UK productivity puzzle 2008–13: evidence from British businesses is full of interesting insights.

The UK service sector continues to grow, although its share of exports to the EU remains smaller than that of goods – 37% vs 49%. Services exports to the rest of the world are the driver of UK export growth.

Conclusion and Investment Opportunities

Sterling

In search of a surrogate for the uncertainty surrounding the UK referendum, the chart below shows the impact on Sterling of the sudden realization that the Scottish might vote to leave the Union in 2014:-

GBP_vs_USD_and_EUR_-_Scottish_Vote_2014

Source: Oanda and ERC

Should the population of the UK vote to forsake the EU, the relative stability of the GBPEUR exchange rate is likely to become structurally more volatile, the move against the USD from 1.72 to 1.61 is but a foretaste of what we should anticipate. However, the 40% appreciation in the UK effective exchange rate between 1995 and 2000 – see the earlier chart above – and reversal between 2000 and 2009, suggests that membership of the EU has not led to the stability in exchange rates one might have expected.

Between the breakdown of Bretton Woods in March 1973 and the establishment of the European Exchange Rate Mechanism (ERM) In March 1979 (which the UK chose not to join until October 1990) was a period of intense currency volatility – exacerbated by significant interest rate differentials. During this period the GBP effective exchange rate actually moved less than it has since 2000. Nonetheless, higher daily volatility will impose a modicum of additional cost on UK businesses. This 2004 paper from the FRBSF – Measuring the Costs of Exchange Rate Volatility looks at the subject in more detail:-

The main quantitative finding is that the welfare effects of exchange rate volatility are likely to be very small for many countries. When numbers are chosen to permit the model to reproduce basic characteristics of the U.S. economy, the model indicates that the loss of utility is equal in size to only about 0.1% of annual consumption; that is, people would be willing to exchange only about 0.1% of their annual consumption level to eliminate the exchange rate volatility in the economy.

Gilts

The UK has exhibited structurally higher inflation than much of the Eurozone (EZ) since the collapse of Bretton Woods. That, combined with the relative asynchronicity of the UK and German economic cycles, made it difficult for the UK to operate inside the ERM – it lasted less than two years, from October 1990 to September 1992. The chart below shows German and UK 10yr Government bond yields during this period, Bunds, with lower yields, on the right hand scale:-

united-kingdom-and german government-bond-yield 1990 - 1992

Source: Trading Economics

Germany was struggling during this period and the Hartz labour market reforms occurred shortly thereafter.

germany-UK-government-bond-yield 1990 - 2015

Source: Trading Economics

As the chart above shows UK Gilts have traded at a higher yield than German Bunds for most of last 25 years. I think it would be reasonable to assume Gilt yields, had the UK remained in the ERM and joined the Euro, would have been between those of Germany and France during this period. In other words, the cost of UK government financing has been around 150bp higher than it might have achieved had it joined the EZ.

UK inflation over the same period has been significantly higher than Germany’s, in real-terms Bunds have offered vastly superior returns. This differential may also be due to the UK government running a substantially larger budget deficit during the period. I regret the data in the chart below only goes back to 1996. The UK balance is shown on the right hand scale:-

germany-UK government-budget 1996-2015

Source: Trading Economics

Stocks

The chart below shows the relative performance of the FTSE100 vs Germany’s DAX40 since 1990. The German market (right hand scale) has increased from 2,000 to 12,000 whilst the UK market has risen from 2,000 to 7,000. Germany has been the clear winner of this race:-

united-kingdom-German stock-market 1990-2015

Source: Trading Economics

Would the UK stock market have fared better inside the EZ and would the UK departure from the EU be detrimental or positive to stock performance going forward? Here is the 1990-2015 comparison between FTSE100 and the French CAC40 index:-

united-kingdom-france stock-market

Source: Trading Economics

Germany appears to be something of an exception, France, Italy and the Netherlands have underperformed the UK during the same period: although Spain has delivered German-like returns. It is worth mentioning that Germany has run a balance of trade surplus for the entire period 1990 – 2015 whilst, excepting a brief period between 1991 and 1997, the UK has run a continuous trade deficit.

I don’t believe UK membership of the EU has much influence over the value of UK stocks in aggregate. Certain companies benefit from access to Europe, others are disadvantaged.

Unless the UK joins the EZ, currency fluctuations will continue whether they stay or go. Gilt yields will continue to reflect inflation expectations and estimates of credit worthiness; being outside the EU might impose greater fiscal discipline on subsequent UK governments – in this respect the benefits of EU membership seem minimal. The UK stock market will remain diverse and the success of UK stocks will be dependent on their individual businesses and the degree to which the regulatory environment is benign. The chart below shows UK GDP by sector since 2008. Services stand out both in terms of their resilience to the effects of the recession and continued growth in its aftermath, it is now 8.5% higher than before the recession, all the remaining sectors languish below their 2008 levels. Improving total factor productivity is key:-

UK_GDP_by_sector_ECR_ONS

Source: ERC and ONS

Ahead of the referendum, uncertainty will lead to weakness in Sterling, higher Gilt yields and relative underperformance of UK stocks. If the UK electorate decide to remain in the EU there will be a relief rally before long-term trends resume. If the UK leaves the EU, Sterling will fall, inflation will rise, Gilt yields will rise in response and the FTSE will decline. GDP growth will slow somewhat, until an export led recovery kicks in as a result of the lower value of Sterling. The real cost to the UK is in policy uncertainty.

Longer term the demographic divergence between the UK and other countries of Europe will become evident. By 2060 the working age population of the UK is projected to increase from 37.8mln (2013) to 41.8mln whilst in Germany the same population will decline from 49.7mln to 35.4mln. The EC – Ageing Report 2015 – has more details. The UK can benefit from staying in the EU and continuously negotiating. However, it must become much more involved in the future of the EU project, including “ever closer union”. It can also benefit from “Brexit”, directly flattering the government’s bottom line. The worst of both worlds is to remain, as the UK has since 1950, sitting on the fence –decisiveness is good for financial markets and the wider economy.

Whither the UK – From Tantalus to Sisyphus?

400dpiLogo.

Macro Letter – No 4 – 31-01-2014

Whither the UK – From Tantalus to Sisyphus?

It has been a long time since I have reviewed the UK economy and the prospects for our financial markets but the recent spate of positive economic news deserves investigation.
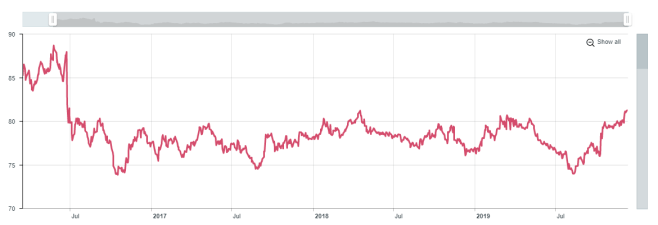
Sterling

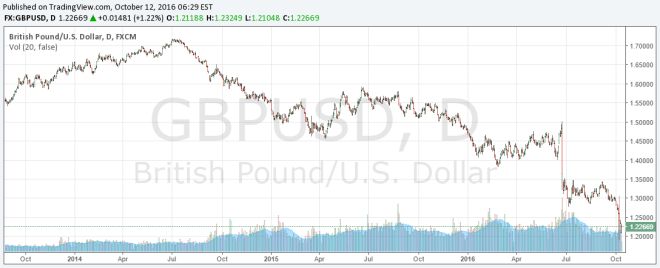
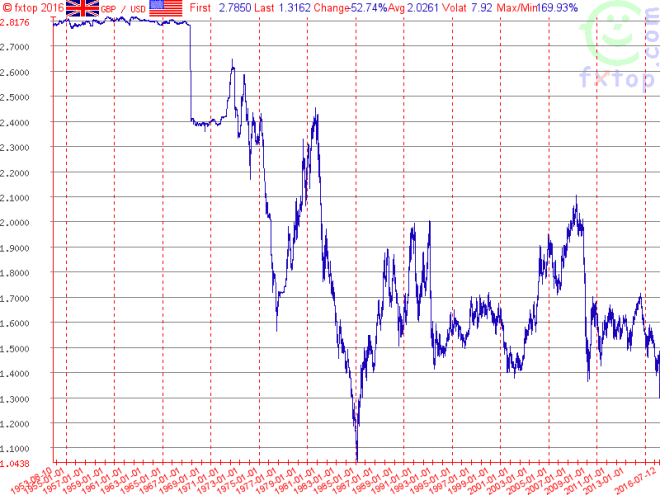
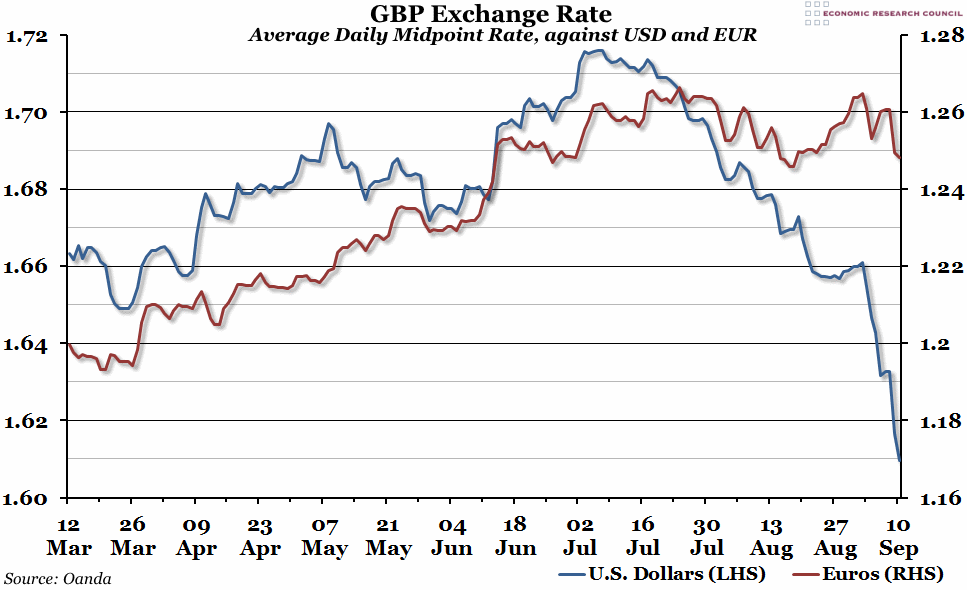
To begin I have enclosed a chart of GBP/USD. You will notice that despite a significant strengthening of GBP, in line with the improving economic data, we still have a distance to travel before returning to the pre-Northern Rock range. The near-term trend looks clear but a comprehensive break above 1.70 is required for confirmation.


GBP-USD FX 10yr - source fxtop.com

GBP/USD FX 10yr – source fxtop.com


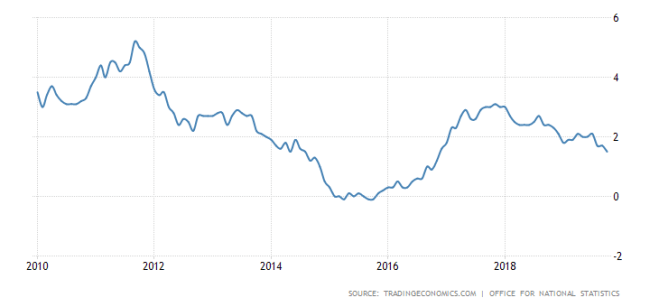
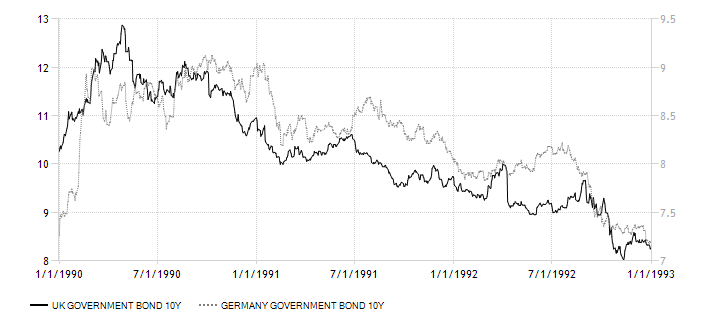
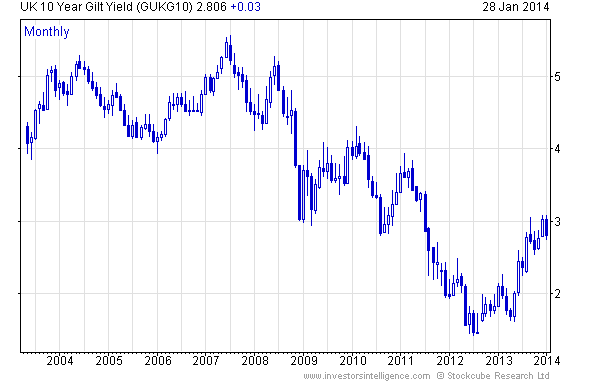
To understand why GP/USD may return to its pre-crisis range one needs to consider why it has been languishing in purgatory since 2008/2009. Partly this is due to the size of the UK financial services sector, where regulatory headwinds remain fierce, and partly the direction of long-term interest rates globally. Here is a chart of 10 year Gilt yields:-

10yr Gilt yield - 10yr Monthly - source investorsintelliegence.com Stockcube Research Ltd.

10yr Gilt yield – 10yr Monthly – source investorsintelligence.com Stockcube Research Ltd

Of course short and long term interest rates have declined in most countries since the Great Recession but traditionally GBP was a “carry-currency” due to our structurally higher inflation rates. The “sea-change” in interest rate differentials has seen the “carry-trader” depart this sceptre isle. There are a number of other factors including the arrival of a coalition government in 2010, a significant decline in the UK housing market and a collapse in the UK export sector, despite the precipitous decline of sterling against its trading partners. Financial services went out of fashion and North Sea oil and gas production took an unfortunate nose-dived simultaneously.

The chart below showing the GBP Trade-Weighted Index is from Ashraf Laidi . It is a couple of years old but it’s still valid, the annotation is his:-

GBP Trade Weighted Index - 1990 - 2013 - source AshrafLaidi 

Source – AshrafLaidi.com

Gilts

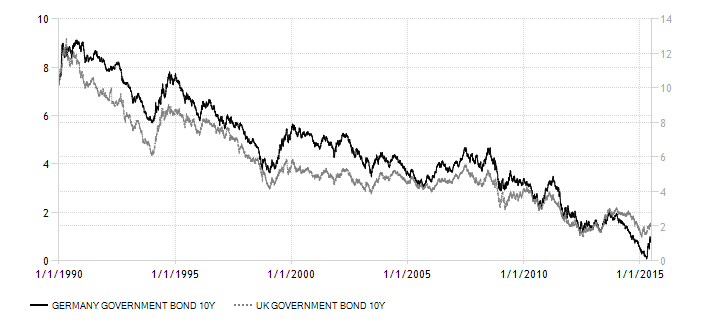
Looking  at the chart of 10 year Gilt yields above, you will notice that yields bottomed in mid-2012 whilst GBP/USD took until 2013 to begin its recovery. The external factor driving Gilt yields to their nadir was the Eurozone crisis, however, since Draghi’s “whatever it takes” speech (July 26th 2012) Gilt yields have begun to normalise in a similar manner to the US. Meanwhile Eurozone rates have converged lower and German 10 year Bund rates have remained relatively low.

Looking ahead it is not unreasonable to expect Gilt yields to go higher, but, with GBP rising and inflation falling this is likely to be a gradual process; added to which the Bank of England (BoE) have been softening their tone on prospective interest rate increases.

Here’s a quote from MPC member Ben Broadbent speaking at the LSE on 17th January: –

The final and more general point is to caution against inferring too much about future growth from its current composition. Of course there’s a risk the recovery could falter. But, if it does, it will probably be because of more fundamental problems – a failure of productivity to respond to stronger demand, for example, or continuing stagnation in the euro area – not any imbalance in expenditure or income per se. These are outcomes, not determinants, of the economic cycle. As we shall see, they are poor predictors of future growth.

http://www.bankofengland.co.uk/publications/Pages/news/2014/024.aspx

On 23rd January Ian McCafferty reiterated the MPC’s position on rates: –

…the MPC sees no immediate need to increase interest rates, even if unemployment reaches 7% in the near future.

McCafferty goes on to discuss capital expenditure which, along with productivity growth, has been weak during the early stages of the recovery.

http://www.bankofengland.co.uk/publications/Pages/news/2014/027.aspx

Also on 23rd January MPC memberPaul Fisher, after explaining why the BoE allowed inflation to remain above target for so long, went on to opine: –

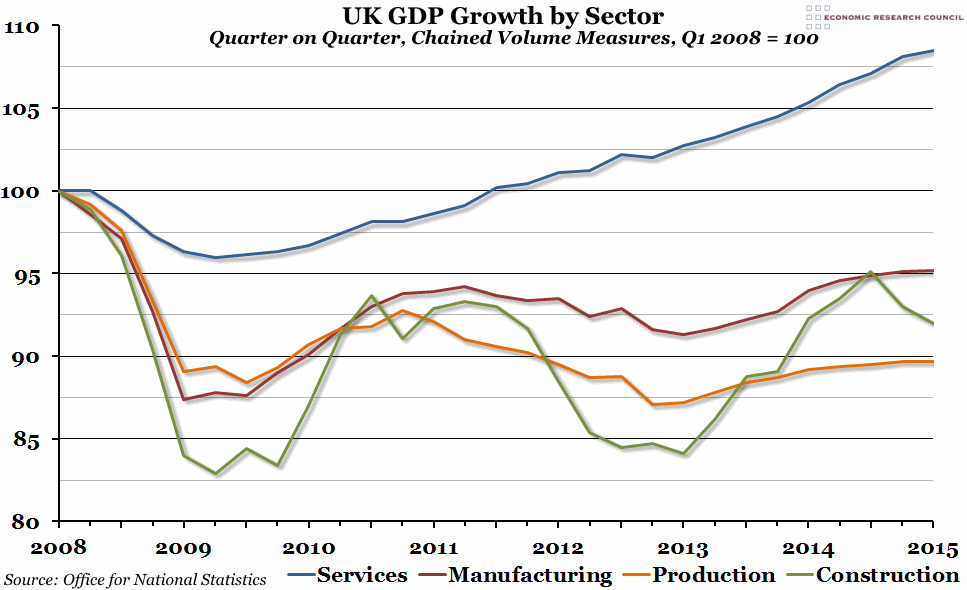
We are very conscious that the headwinds have not gone away: much of Europe and some other parts of the world continue to struggle for sustained growth; fiscal consolidation in the UK (and elsewhere) is likely to continue for a while to come; and the financial sector still needs some rebuilding. Indeed, the official production and construction data released earlier this month were rather disappointing, reminding us that strong growth from here on is by no means guaranteed.

http://www.bankofengland.co.uk/publications/Pages/news/2014/028.aspx

Fisher goes on to explain that unemployment, and the composition of employment, are key metrics in their thought process. The whole speech is also a fascinating insight into the MPCs approach and their ideas on forward guidance.

BoE Governor – Mark Carney addressed the CBI at Davos on 24th January: he discussed the UK economy and the need to reach “escape velocity”: –

After the Great Moderation and the Great Recession, there are several reasons why it will be years before any superlatives are attached to this recovery.

First, for all the talk of austerity and deleveraging, the aggregate debt burdens of advanced economies have actually increased; with their total non-financial sector debt rising by 25% relative to GDP since 2007. Balance sheet repair in the public and private sectors will exert a persistent drag on major economies for some time.

Second, the need to rebalance demand from deficit to surplus countries endures. Given the adjustment pressures on the former, without progress on rebalancing, robust and sustainable global growth will remain an aspiration.

Third, confidence, while improved, remains subdued. Recognising that the end isn’t nigh is far from marking the normalisation of business and consumer sentiment. Given past shocks and modest prospects, business investment in particular remains hesitant across the advanced world. On balance, corporations remain more focused on reducing operating expenditures than increasing capital expenditures.

… Nevertheless, it appears that the recovery will need to be sustained for a period before productivity gains can resume in earnest. The latest data show that more than a quarter of a million jobs were created in a three-month period – the biggest increase since records began in 1971. As a result, unemployment seems to be falling at a pace that will reach our 7% threshold materially earlier than we had expected.

Crucially, unemployment remains above the level that is likely to be consistent with maintaining inflation at the target in the medium term. It is not just that nearly three quarters of a million more people are out of work than before the crisis; another three quarters of a million more people are involuntarily working part time.

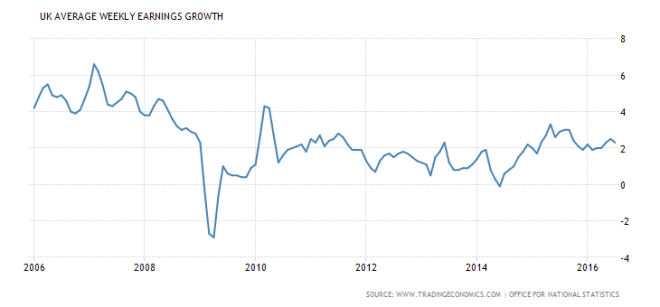
The effect of this slack in the labour market is evident in wage inflation, which is at around 1% so that, even with weak productivity, unit labour cost growth remains below 2%.

http://www.bankofengland.co.uk/publications/Pages/speeches/2014/705.aspx

All of these comments concerning lack of productivity growth, elevated levels of unemployment, growth of part-time employment, lack of capital expenditure and international headwinds from the Eurozone, suggest that interest rates will stay low and the BoE will risk above target inflation to insure the economic recovery broadens and deepens. In this environment I see Gilts remaining in a relatively narrow range, even if inflation ticks higher once more.

Politics

On 29th January, Mark Carney spoke in Edinburgh on The economics of currency unions. The full speech is here: –

http://www.bankofengland.co.uk/publications/Documents/speeches/2014/speech706.pdf

He attempted to be deliberately non-political – to judge by the press comment afterwards he failed – but it is a timely reminder that Scotland will vote on whether they remain in the Union on 18th September. The uncertainty surrounding the possible break-up of the Union and one what economic terms is another factor which will temper a broader based recovery.

Other political clouds on the horizon include the European Parliament elections (22nd to 25th May) where nationalist parties are expected to gain significant ground.
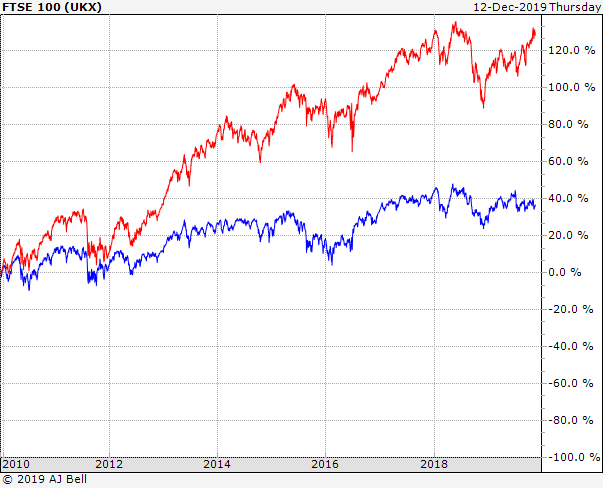
Equities

The FTSE100 has performed strongly since the beginning of 2013, in line with other developed country stock markets. The large dose of QE delivered by the BoE has underpinned this trend, but, now that the economy has regained some upward momentum, many commentators are becoming doubtful about the prospects for UK stocks – after all, lower interest rates are one of the most powerful drivers of equity market performance.

Firstly, I believe UK-centric stock momentum is increasing, but a number of external factors will be supportive of the UK equity market: –

  1. China has announced a rebalancing of their economy towards domestic consumption, even if this is at the expense of headline GDP growth. This makes inward foreign investment into China less attractive – I expect capital to flow back to UK and USA.
  2. Japan is attempting to deliver economic growth through what PM Abe has dubbed the “Three Arrows” policy, this has already seen a significant decline in the JPY and a new “quasi-carry trade” is being driven but expectation of relative government spending. The US has begun to taper (another $10bln just this week) and the UK might follow suit at some point this year, but Japan will continue with QE.
  3. Emerging markets have already started to react to the changed policy of the Federal Reserve: India, beginning last year, Argentina, South Africa and Turkey, have seen their currencies depreciate and respond with higher interest rates since the start of the year. Emerging market bonds have, needless the say, fallen sharply, prompting international investors to liquidate some of their investments. The reversal of more than a decade of Capital flows to emerging markets will support developed country currencies, especially those, like the UK, with Capital account surpluses.

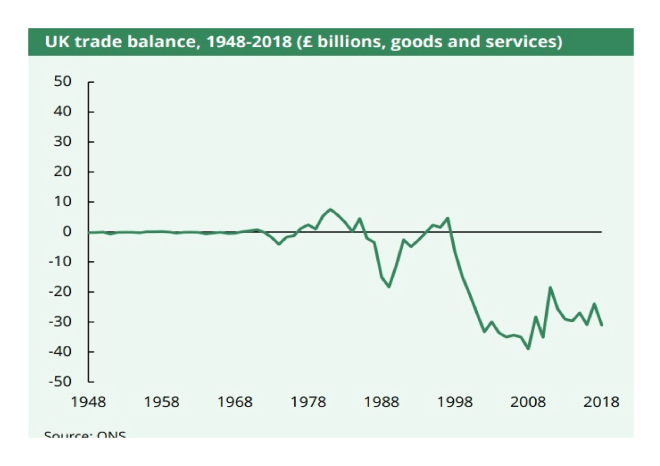
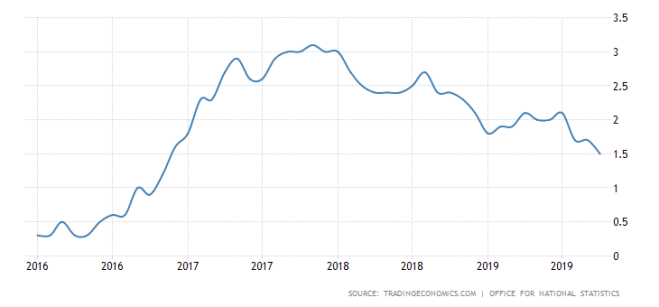
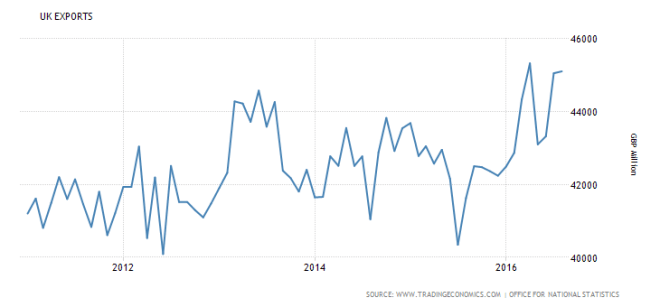
Secondly, UK Exports have remained resilient despite the strengthening of sterling.

UK Exports - 10 yr - source tradingeconomics and ONS

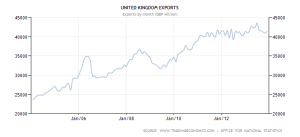
Source – tradingeconomics.com

I have some caveats concerning UK equities however; banking and financial services firms are still under pressure due to regulatory change – a new report from United Nations Conference on Trade and Development (UNCAD) shows the UK falling to second place behind the USA; down more than 20% from its peak only seven years ago. The European Commission has just announced plans to stop all proprietary trading by Banks by 2017 – whilst this is likely to be challenged by UK, France and Germany it will lead to the postponement of any expansion plans in this area.  Another sector which is under pressure is mining or commodity firms which are still suffering from the downturn in prices in 2013 – this tallies with my short-term concerns about emerging markets.

UK House Prices

A number of commentators have suggested that the recent strength of the UK economy has been largely driven by increased debt, especially mortgages. Government schemes such as “funding for lending” actively encouraged UK banks to lend more aggressively despite their balance sheet constraints.

MPC member David Mills, in a speech to the Dallas Federal Reserve, discussed housing last November:-

That problem with using monetary policy to stabilise the housing market would be acute if housing markets were overheating when the wider economy was not and consumer price inflation was low even though house price inflation was high.

…High leverage is at the heart of problems in housing market. Monetary policy and macro prudential policy can influence leverage. But more fundamentally, use of outside equity might be a way of permanently bringing down reliance upon debt financing.

http://www.bankofengland.co.uk/publications/Pages/news/2013/132.aspx

In other words the BoE is unlikely to be concerned about house price inflation and will use macroprudential measures rather than interest rates to stem its rise should it occur in isolation. This is clearly good for property but, in anticipation of the “Macroprudential Stick” other asset classes, such as equities, may benefit by association.

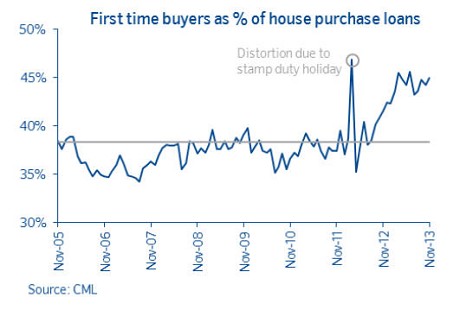
The housing market is finally recovering from the bottom up as the following chart makes clear: –

First Time Buyers as percentage of home loans - source Council for Mortgage Lenders

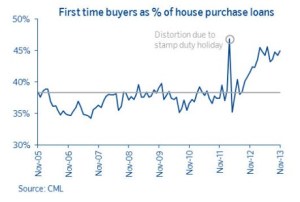
Source – Council for Mortgage Lenders

First time buyers have returned, perhaps because banks are more amenable about loan to value ratios but also because real house prices are well off their highs: –

 Real House Prices since 1975 - source Nationwide Building Society

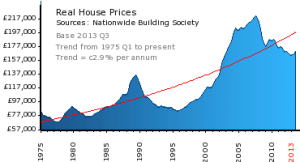
Real House Prices since 1975 – source Nationwide Building Society

House price momentum appears to have turned higher once more – this chart, from MarketOracle.co.uk, uses data to November 2013:-

UK house prices and annual momentumn-Dec-2013 - source Market Oracle.com and Halifax

Source – MarketOracle.co.uk and Halifax

The December 2013 report from the Land Registry, published on 29th January, shows continued improvement: –

http://www.landregistry.gov.uk/__data/assets/pdf_file/0020/71192/HPIReport20140122.pdf

Independent forecasts for UK property are strongly positive, here is a recent sampling:-

CBRE 17% Rise by 2018 Commercial property consultants

OBR 20% Rise by end of 2018

Knight Frank24% rise by end of 2018 – Retail property specialists

Savills25% rise by end of 2018 – Retail property specialists

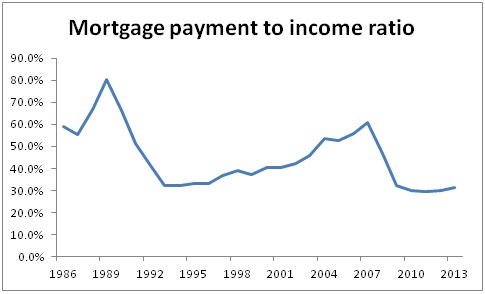
Why so strong? Because interest rates are low and therefore housing is relatively affordable. Here is one of my favourite measures of housing affordability from Moneystepper.com:-

UK mortgage to income ratio - source moneystepper.com

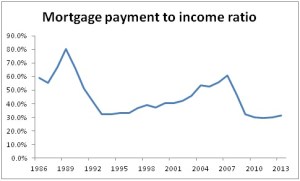
UK Mortgage payment to income ratio – source Moneystepper.com

The author uses the Nationwide House Price Index, the BoE base rate plus 2% and the ONS after-tax income data.

For a more detailed investigation of the UK property market here is their post from November 2013, it’s the second of three articles:-

http://moneystepper.com/financial-planning/housing-bubble-uk-2/

Why Tantalus to Sisyphus?

Almost everything I’ve written so far has been positive for the UK economy and neutral or positive for UK markets. After unprecedented actions by the BoE, the “Tantalus Phase” appears to be over; growth that was just out of reach is now within our grasp, however, ahead of us lies the “Sisyphus Phase” where we have to pay the piper.

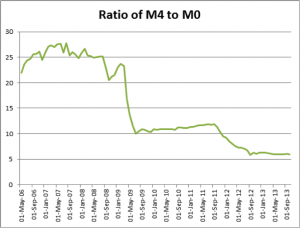
To begin with I want to look at money supply growth. Here is the Ratio of M4 to M0 from BoE data: –

Ratio M4 to M0 - source Bank of England

Ratio of M4 to M0 – source Bank of England – John Phelan

An excellent article by John Phelan written for the Cobden Centre analyses this development in more detail: –

http://www.cobdencentre.org/2014/01/britains-inflationary-outlook

Since March 2009 Britain’s monetary base, also known as narrow money or M0, has increased by 321%. We can see that the majority of this is in the form of increased bank reserves, up 642% since March 2009.

This is just what we’d expect to see following the Bank of England’s Quantitative Easing, where the Bank creates new money and uses it to purchase bonds from banks – that new money becomes bank reserves. Those banks have sat on that money (not using it as a basis for new credit creation and feeding into M4) which is why, while narrow (M0) money has exploded, broad (M4) money has barely budged, increasing by just 7.4% since March 2009.

This relative restraint in M4 growth explains the relative restraint in inflation. There is no great mystery as to why banks which have just seen their assets tank and ravage their balance sheets should want to hold more reserves. The key question is what happens next.

A paper published in December 2013 by European Commission – The flow of credit in the UK economy and the availability of financing to the corporate sector – looks in more detail at the problem of the transmission of credit:-

http://ec.europa.eu/economy_finance/publications/economic_paper/2013/pdf/ecp509_en.pdf

They conclude on an optimistic note: –

The flow of credit in the UK economy may be close to turning a corner in connection with recent improvements in the macroeconomic outturns and outlook, and as banks finish adapting to a new regulatory environment. Improving access to finance for firms and SMEs is set to remain a crucial element for driving the desirable rebalancing of the UK economy, fomenting investment and fostering the reallocation of resources to the most productive sectors of the economy throughout the on-going recovery.

The BoE – Corporate Credit Conditions Survey – Q4 2013 – released earlier this month, also suggests this process is starting to happen:-

Overall credit availability to the corporate sector was reported to have increased significantly in 2013 Q4; lenders have now reported an increase in availability for five consecutive quarters. Lenders cited market share objectives, competition from capital markets and an improvement in the economic outlook as factors that had contributed significantly to the increase in availability. All these factors were expected to contribute significantly to availability in 2014 Q1.

http://www.bankofengland.co.uk/publications/Documents/other/monetary/ccs/creditconditionssurvey140108.pdf

Against this back-drop of improving conditions, however, it is important to realise that the combination of UK public and private sector debt is the second largest of any developed country on the planet relative to GDP – only Japan carries a greater burden. Academic research has shown that when the ratio of debt to GDP exceeds 260% to 275% this tends to act as a drag on economic growth.

The chart below is from 2012 but the situation has not improved.

 Total Debt to GDP ratios - source DailyMail

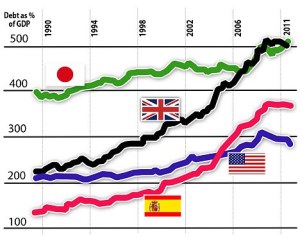
Total Debt to GDP – source DailyMail – January 2012

UK Household debt is now at a record £1.43trln, although, it has fallen from 167% of income to 140% since 2008.

At some point in the future we will have a “reckoning” – probably when broad-based inflation begins to rise once more. Interest rates will rise dramatically to control credit growth. What the catalyst will be is difficult to say – a breakup of the Eurozone could lead to a collapse of GBP, the next major leg of a commodity super-cycle turbo-charged by the collapse of the Saudi regime – it’s best not to speculate, but, perhaps the longer term factor most likely to re-ignite the inflationary potential of the “great debasement” is demographic.

As the “Baby-boomers” finish retiring and downsizing the next leg of the demographic cycle will begin, with increased spending and consumption. When these “new-boomers” eclipse the “old-boomers” inflation will regain its power to decimate the value of money whilst at the same time asset prices will collapse under a deluge of foreclosures and debt default. The Sisyphian task will be to reduce the debt against the rising tide of servicing costs. But when will the next “Baby Boom” arrive?

Here is a fascinating chart from the ONS:-

UK Baby boom - source ONS

UK Baby boom – source Office of National Statistics

According to ONS data, UK population growth to mid-2011 was the highest in 40 years. They predict that, should this trend continue, the UK will have the largest population of any country in Europe by 2050. Recent CML data shows the average age of first time house buyers to be 29/30 years. I therefore anticipate a “mini-baby boom” effect kicking in between 2015 and 2020, followed by a 10 year decline. From 2030 this pattern will reverse; by 2040 the next significant inflation wave will be in full swing.

This weekCharles Goodhart, speaking at the LSE predicted that “The Next Crisis” – which was the title of his speech – will occur around 2025/2026. Here’s the podcast, he starts his argument around 10 minutes in and make the case for 17 year cycles. Hence 2025/26 will see the next UK crisis which, he believes, will be more severe than the recent downturn due to a greater concentration on lending to the property sector, exacerbated by the regulatory curtailment of investment banking activity in favour of more traditional bank lending: –

http://www.lse.ac.uk/newsAndMedia/videoAndAudio/channels/publicLecturesAndEvents/player.aspx?id=2219

My expectation is that during the remainder of this decade demographic forces will be somewhat supportive of inflation but attempts to deleverage UK debt after 2020 will have more deflationary consequences.

Conclusion

Sterling looks well placed to move back into its pre-crisis range. Gilts are caught between inflationary and deflationary forces and should remain range-bound. UK Equities are likely to benefit from inward capital flows and UK property looks better than ever – barring a significant change in UK planning laws, this is my preferred UK asset class for 2014, and probably beyond.