Macro Letter – No 63 – 14-10-2016
Which parts of the UK economy and which stocks will be the winners from Brexit?
- Sterling has fallen to its lowest since 1985 on fears of a “Hard Brexit”
- UK stocks, led by the FTSE100, have rallied sharply
- Sectors such as IT and Pharmaceuticals will benefit long-term
- Even construction and financial services present investment opportunities
If you are in the habit of reading the mainstream financial press you will see headlines such as:-
The Times – Leak of gloomy Brexit forecast pushes pound to 31-year low – 12th October
The Economist – The pound and the fury – Brexit is making Britons poorer, and meaner – 11th October
Over the last three months, this has been typical of almost all financial media commentary. Sterling, meanwhile, has fallen, on a trade weighted basis, to a low not seen since the effective exchange rate index was recalibrated in 1990. At 73.79 it has even breached its close of December 2008 (73.855):-

Source: Bank of England
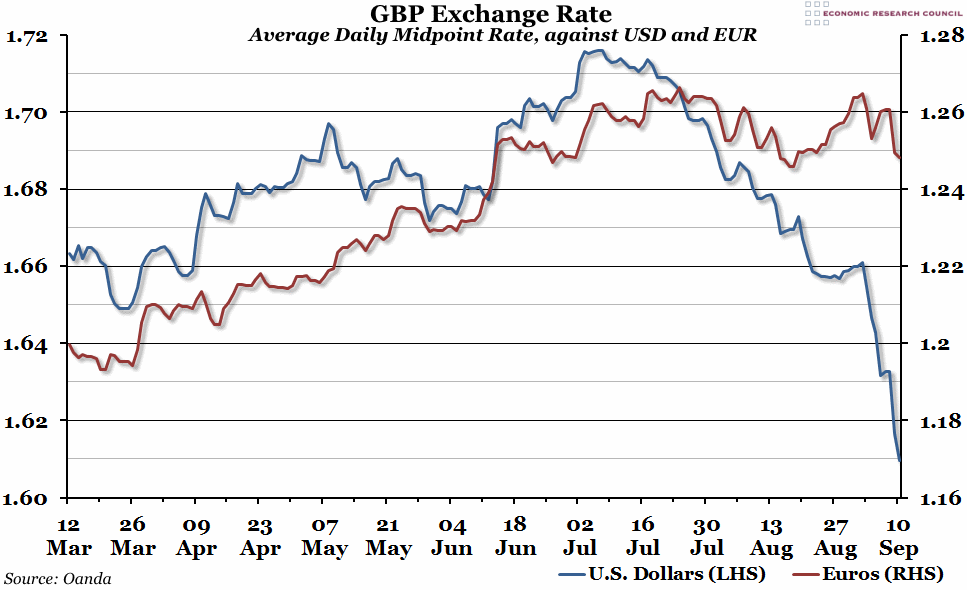
The recent weakness in Sterling has been linked to the publication of parts of draft cabinet committee papers, suggesting UK revenues could drop by £66bln. From a technical perspective the “Flash Crash” in Cable (GBPUSD) last week has exacerbated the situation, creating the need for the currency to retest the low of 1.18 during normal market hours – the market reached 1.2086 on 11th – more downside is likely:-
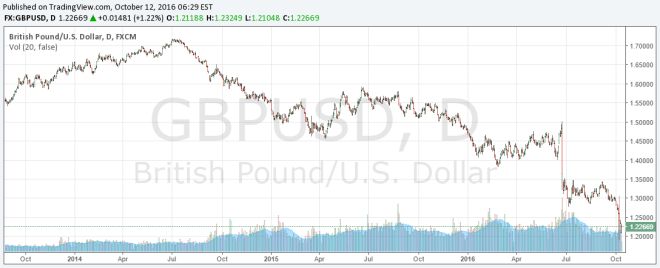
Source: DailyFX.com
As the two charts above reveal, Sterling has weakened by 16% versus the US$ and by 18.5% on a trade-weighted basis.
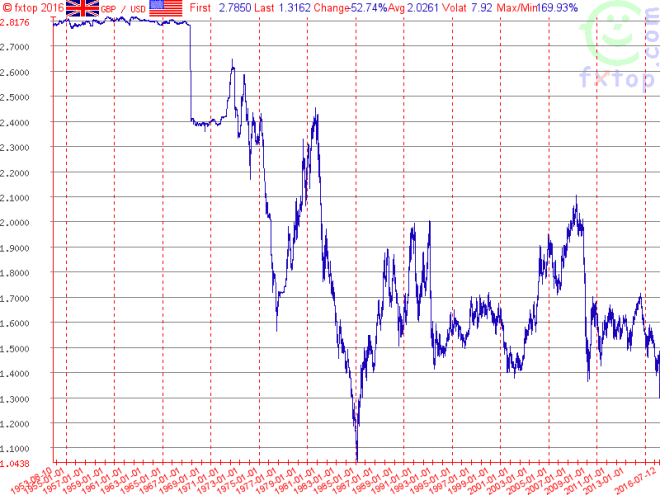
Here is the chart of GBPUSD since 1953. It reinforces my expectation, from a technical perspective, that we will see further downside:-
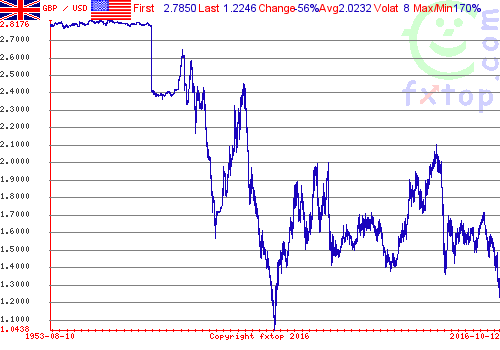
Source: fxtop.com
Given the seismic impact of a “Hard Brexit” on the UK economy, it would not be surprising to see a return to the February 1985 low of 1.0440.
I am not alone in my expectation of further weakness, Ashoka Mody – who organised the EU-IMF bailout of Ireland – told the Telegraph this week that Sterling was between 20% and 25% overvalued going into the Brexit vote.
Trade
The EU is the UK’s largest trading partner, accounting for 44% of goods and services exports in 2015 – though this was a decline the on previous year. Of greater concern to the neighbours, is the 53% of UK imports which emanate from the EU. In theory Sterling weakness should benefit UK exports; the impact has been minimal, so far:-
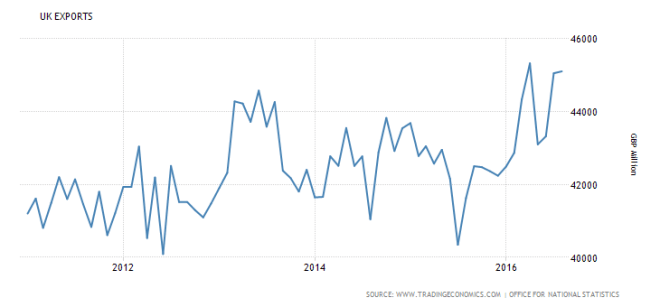
Source: Tradingeconomics.com, ONS
Similarly, imports should be falling – they are not:-
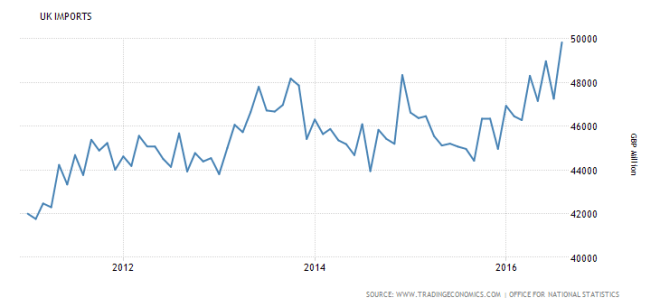
Source: Trading Economics, ONS
I discussed the prospects for UK growth and the effect of Sterling weakness on the balance of trade in Macro Letter – No 59 – 15-07-2016 – Uncharted British waters – the risk to growth, the opportunity to reform – quoting in turn from John Ashcroft – The Saturday Economist – The great devaluation myth:-
There was no improvement in trade as a result of the exit from the ERM and the subsequent devaluation of 1992, despite allusions of policy makers to the contrary.
…1 Exporters Price to Market…and price in Currency…there is limited pass through effect for major exporters
2 Exporters and importers adopt a balanced portfolio approach via synthetic or natural hedging to offset the currency risks over the long term
3 Traders adopt a medium term view on currency trends better to take the margin boost or hit in the short term….rather than price out the currency move
4 Price Elasticities for imports are lower than for exports…The Marshall Lerner conditions are not satisfied…The price elasticities are too limited to offset the “lost revenue” effect
5 Imports of food, beverages, commodities, energy, oil and semi manufactures are relatively inelastic with regard to price. The price co-efficients are much weaker and almost inelastic with regard to imports
6 Imports form a significant part of exports, either as raw materials, components or semi manufactures. Devaluation increases the costs of exports as a result of devaluation
7 There is limited substitution effect or potential domestic supply side boost
8 Demand co-efficients are dominant
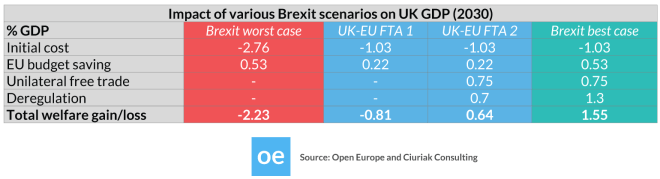
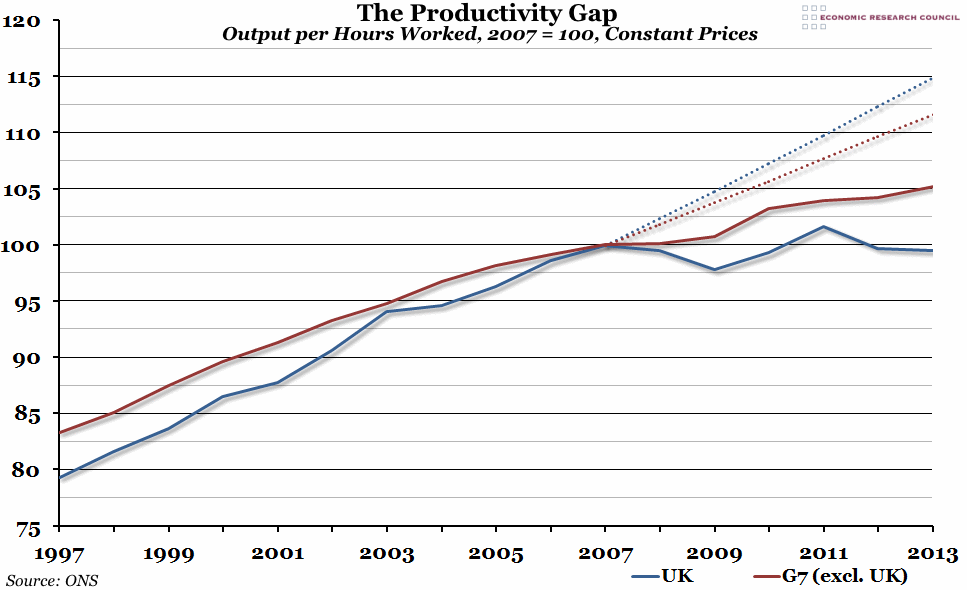
If Sterling weakness will not improve the UK terms of trade, what will happen to growth? Again, in Macro Letter 59 I quote, Open Europe’s worst case scenario – that UK economic growth will be 2.2% less, on an annual basis, than its current trend, by 2030. Trend GDP growth between 1956 and 2015 averaged 2.46%. Is the media gloom justified and…
Are there any winners?
I concluded my July article saying:-
Companies with foreign earnings will be broadly immune to the vicissitudes of the UK economy, but domestic firms will underperform until there is more clarity about the future of our relationship with Europe and the rest of the world. The UK began trade talks with India last week and South Korea has expressed interest in similar discussions. Many other nations will follow, hoping, no doubt, that a deal with the UK can be agreed swiftly – unlike those with the EU or, indeed, the US. The future could be bright but markets will wait to see the light.
The UK stock market has already jumped the gun. The chart below shows the strong upward momentum of the FTSE100, dragging the, less international, FTSE250 in its wake; yet UK property has been hit hard by expectations of a slowdown in foreign demand:-

Source: Daily Telegraph
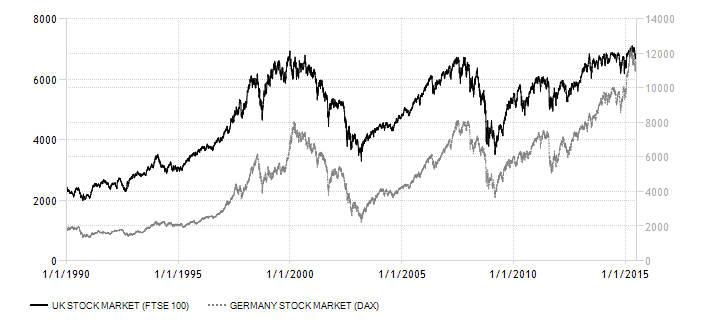
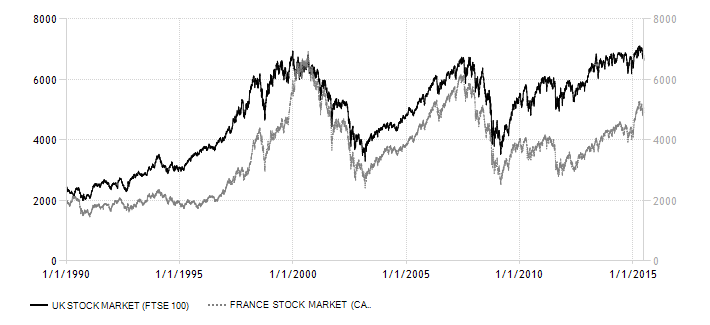
The obvious winners in the short term are companies with non-Sterling earnings – the constituents of the FTSE100 have an estimated 77% of overseas revenues – 47 of them pay their dividends in US$. The FTSE250 is not far behind, its members have 50% of foreign revenues. This is not dissimilar to the French CAC40 and German DAX. The table below lists the top and bottom ten FTSE350 companies by Sterling revenues:-
| 10 FTSE 350 companies with lowest sterling revenues | |
| Company | Sterling revenues |
| Vedanta Resources (VED) | 0% |
| Hikma Pharmaceuticals (HIK) | 0.20% |
| BHP Billiton (BLT) | 0.30% |
| Antofagasta (ANT) | 0.40% |
| Mondi (MNDI) | 0.40% |
| Tate & Lyle (TATE) | 0.60% |
| Rio Tinto (RIO) | 0.70% |
| British American Tobacco (BATS) | 1% |
| Laird (LRD) | 1.60% |
| Victrex (VCT) | 1.80% |
| 10 FTSE 350 companies with highest sterling revenues | |
| Company | Sterling revenues |
| Saga (SAGAG) | 69.80% |
| Capita (CPI) | 70.40% |
| Wm Morrison (MRW) | 70.60% |
| Booker Group (BOK) | 70.80% |
| Intu Properties (INTU) | 71.60% |
| Home Retail Group (HOME) | 72.10% |
| OneSavings Bank (OSBO) | 72.50% |
| Standard Life (SL) | 88.90% |
| Grainger (GRI) | 96.30% |
Source: S&P Global Market Intelligence
Some of these companies are not exactly household names. Below is a table of the top 30 stocks in the FTSE100 by market capitalisation as at 28th September. The table also shows the year to date performance by stock as at 12th October:-
| Company | Ticker | Sector | Market cap-£mln (28-09) | YTD (12-10) | >50% Non-£ revenue | % of non-£ revenue |
| Royal Dutch Shell | RDSA | Oil and gas | 149,100 | 16.33% | Yes | 85%? |
| HSBC | HSBA | Banking | 113,455 | 15.97% | Yes | |
| British American Tobacco | BATS | Tobacco | 92,162 | 28.58% | Yes | 99% |
| BP | BP | Oil and gas | 81,196 | 25.99% | Yes | 85%? |
| GlaxoSmithKline | GSK | Pharmaceuticals | 80,629 | 32.02% | Yes | 91% |
| AstraZeneca | AZN | Pharmaceuticals | 64,771 | 18.72% | Yes | 93% |
| Vodafone Group | VOD | Telecomms | 59,259 | 6.10% | Yes | |
| Diageo | DGE | Beverages | 55,931 | 20.41% | Yes | |
| Reckitt Benckiser | RB | Consumer goods | 50,446 | 20.66% | Yes | |
| Unilever | ULVR | Consumer goods | 46,917 | 32.18% | Yes | 85%? |
| Shire plc | SHP | Pharmaceuticals | 45,899 | 16.56% | Yes | 96% |
| National Grid plc | NG | Energy | 41,223 | 15.14% | Yes | |
| Lloyds Banking Group | LLOY | Banking | 39,634 | -29.62% | ||
| BT Group | BT.A | Telecomms | 38,996 | -15.03% | ||
| Imperial Brands | IMB | Tobacco | 37,677 | 13.35% | Yes | |
| Prudential plc | PRU | Finance | 35,544 | -3.61% | Yes | 60% |
| Rio Tinto Group | RIO | Mining | 34,715 | 6.72% | Yes | 99% |
| Glencore | GLEN | Mining | 30,135 | 94.96% | Yes | |
| Barclays | BARC | Banking | 28,089 | -34.34% | Yes | |
| Compass Group | CPG | Food | 24,528 | 37.40% | Yes | |
| WPP plc | WPP | Media | 23,330 | 16.44% | Yes | 87% |
| BHP Billiton | BLT | Mining | 23,169 | 5.18% | Yes | 97% |
| CRH plc | CRH | Building materials | 21,314 | 50.45% | Yes | |
| Royal Bank of Scotland Group | RBS | Banking | 20,799 | -46.12% | ||
| Associated British Foods | ABF | Food | 20,481 | -27.11% | ||
| Standard Chartered | STAN | Banking | 20,403 | -9.76% | Yes | |
| Aviva | AV. | Insurance | 17,925 | -3.27% | Yes | 60% |
| BAE Systems | BA. | Military | 16,698 | 16.87% | Yes | |
| RELX Group | REL | Publishing | 15,842 | 27.83% | Yes | 85%? |
| SSE plc | SSE | Energy | 15,548 | -1.75% |
Source: Stockchallenge.co.uk, Financial Times
The table indicates where non-Sterling revenues exceed 50% and, where I have been able to glean current data, the most recent percentage of international revenues. These 30 names represent 70% of the total market capitalisation of the FTSE100 Index. The positive impact of the fall in Sterling on the performance of the majority of these stocks is unequivocal.
On a sectoral basis this is a continuation of the price action evident in the week following the Brexit vote. The chart below was published by the FT on 29th June:-
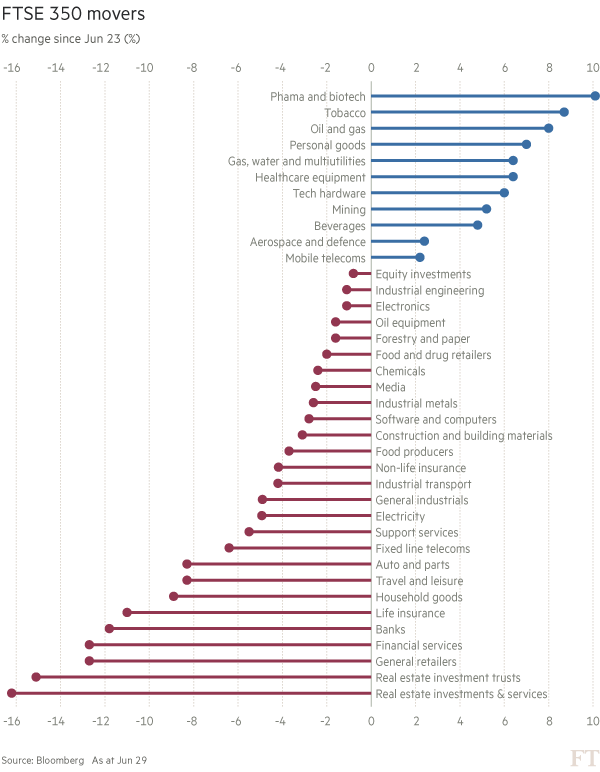
Source: Bloomberg, FT
The underperforming sectors are not difficult to explain. Banks and Insurance companies, despite having international revenues, have been hurt by concerns about the loss of access to EU markets after Brexit. Real Estate remains nervous about a collapse in international demand, now the UK is no longer the gateway to Europe. Meanwhile, the retail and household sectors are likely to suffer as UK economic growth slows, consumer spending declines, inflation – driven by higher import prices – squeezes corporate profit margins and the Bank of England is forced to respond to higher consumer prices with monetary tightening.
Yet, looking at the table below, the dividend cover of the consumer sector is robust and the data we have seen since Brexit – retails sales +6.2% in July and 6.3% in August, combined with the rebound in consumer confidence – suggests that the consumer is what might be deemed serene:-
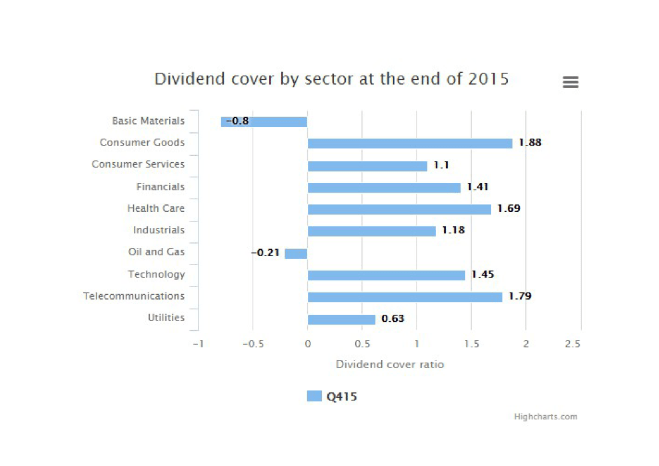
Source: Daily Telegraph, Highcharts
Other UK economic indicators also seem to be rebounding. Manufacturing PMI was 55.4 in September –its highest level since the middle of 2014. Services PMI, at 52.6, is still expanding and Construction PMI, at 52.3, has returned to growth. Rumours of the death of the consumer may be grossly exaggerated. Even consumer credit, which dipped in July, rebounded in August.
The “Sterling Effect” on stock valuation has more to deliver in the near-term, but once the currency stabilises this one-off benefit will diminish.
Who will the longer term winners be?
It is difficult to assess the long run impact of a “Hard Brexit” without reviewing the WTO – Most Favoured Nation – Tariff schedule for the EU. The trade weighted average tariff for 2013 was 3.2%, but on agricultural products it was a much higher 22.3% whilst it was only 2.3% on Non-Agricultural products:-
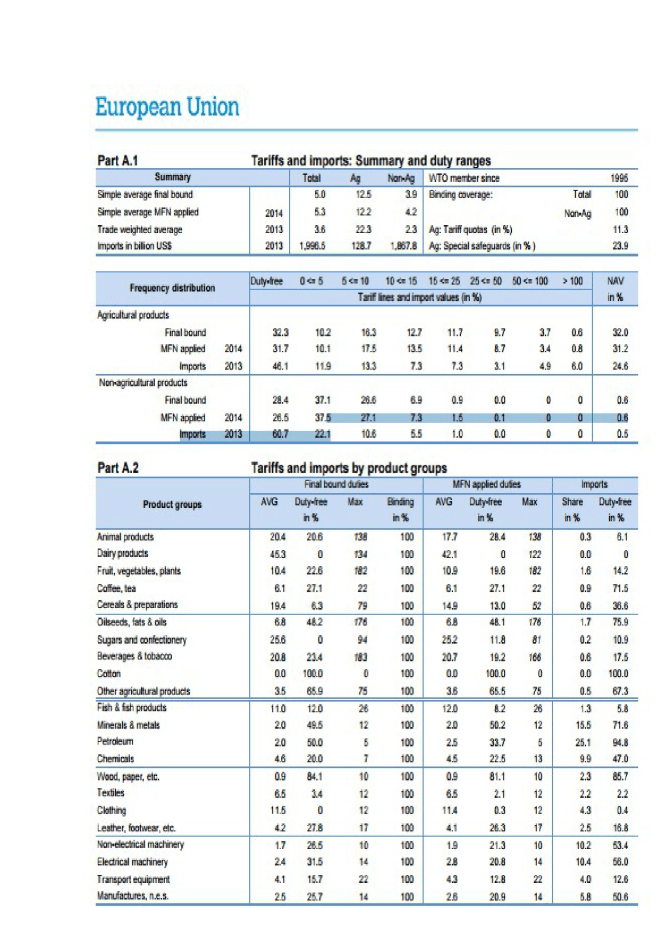
Source: WTO
A “Hard Brexit” will probably entail a reversion to Most Favoured Nation terms with the EU under WTO rules.
The 18.5% decline in the Sterling Effective Exchange Rate means the cost to the UK of exporting, even agricultural products – excepting dairy – has been priced in. No wonder economists are busy revising their 2016/2017 growth forecasts higher – until Brexit actually happens, UK exports to the EU, and the majority of our other trading partners, will remain incredibly competitive.
Developing beyond this theme, a recent speech – The economic outlook – by Michael Saunders, a Bank of England MPC Member, reminded the Institute of Directors in Manchester:-
…we should not lose sight of the UK economy’s considerable supply-side advantages, with relatively flexible labour and product markets, openness to foreign investment, low-ish tax rates, strength in knowledge-intensive services and hi-tech manufacturing…
And the winners are…
This by no means an exhaustive list – some sectors are an obvious response to the decline in the currency, others are rather less certain.
Tourism – with the UK suddenly an inexpensive destination for tourists from around the world. In 2015, 7.3mln tourists visited the UK, of which 4.6mln were from the EU. Tourism Alliance estimates the UK tourist industry was worth £126.9bln in 2013. The chart below shows the volatile but upward sloping evolution of tourism revenues:-

Source: Trading Economics, ONS
Here is an edited table of the Leisure and Travel constituents of the FTSE350, it excludes bookmakers, travel agents and airlines:-
| Ticker | Company |
| CCL | Carnival |
| CINE | Cineworld Group |
| CPG | Compass Group |
| DOM | Domino’s Pizza Group |
| FGP | FirstGroup |
| GNK | Greene King |
| GOG | Go-Ahead Group |
| GVC | GVC Holdings |
| IHG | InterContinental Hotels Group |
| JDW | Wetherspoon (J.D.) |
| MAB | Mitchells & Butlers |
| MARS | Marston’s |
| MERL | Merlin Entertainments |
| MLC | Millennium & Copthorne Hotels |
| NEX | National Express Group |
| RNK | Rank Group |
| RTN | Restaurant Group |
| SGC | Stagecoach Group |
| WTB | Whitbread |
Source: Shareprices.com
There should also be a positive impact on construction, as many operators, particularly within the unlisted sector, upgrade their facilities to capture the increased demand.
Not all the omens are positive; many of the jobs created by tourism are temporary and seasonal, the impact of a “Hard Brexit” is likely to lead to an increase in average earnings – good for employees, though not necessary for employers:-
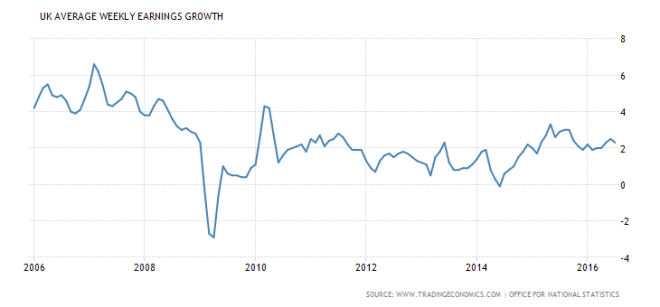
Source: Trading Economics, ONS
The trend in wage growth has been steady for several years, but as inflation picks up and UK immigration declines, wages will rise.
Value Added Industries such as IT, Technology, Pharmaceuticals – these are growth industries in which the UK has a comparative advantage. Typically their growth is delivered through productivity enhancing innovation. That they will also benefit, from a structurally lower exchange rate, is an added bonus.
Property and Construction should recover strongly – according to the Nationwide, UK house prices increased again in September. Only in central London, where stamp duty increases on higher value properties has undermined sentiment, have prices eased.
The UK has a shortage of residential property. Whether interest rates remain low or not, this situation will not change until there is genuine planning reform. The three largest housebuilders Barratt Developments (BDEV) Taylor Wimpey (TW) and Persimmon (PSN) are all trading with P/E ratios below 10 times. The only real concern is the difficulty these companies may experience in securing skilled manual labour – Barrett Developments source between 30% and 40% of their current workforce from mainland Europe.
There are other companies in the construction sector such as Balfour Beatty (BBY) Carillion (CLLN) and Kier Group (KIE) which will benefit from increased public investment in infrastructure projects. Monetary policy is nearing the end of its effectiveness – although the central banks still have plenty of stocks they could buy. The next step is to pass the gauntlet back to their respective governments’. I believe fiscal stimulus on a substantial scale will be the next phase.
Banking and Financial Services may seem like the last place to look for performance. The regulators have been tightening the noose since 2008 – as the current crisis at Deutsche Bank highlights, this trend has yet to run its course. However, challenger banks and shadow banking institutions, including hedge funds, are beginning to fill the void. In the days before the financialisation of the economy, banking was the servant of industry. The real-economy still needs banking and credit facilities. The oldest of the Peer to Peer lenders (unlisted) Zopa, announced their first securitisation this summer. After a decade of development their business it is finally coming of age.
The CMA – Making the Banks Work Harder For You – August 9th is certainly supportive for the digital disruptors of traditional banking. Government support is no guarantee of success but it’s easier to have them on your side.
You may argue that the success of companies such as Zopa are based on technological advantages but the recent history of banking has been about harnessing technology to increase trading volumes and reduce the costs of financial transactions. Growth in the profitability of financial services is integrally tied to advances in technology.
A final argument for Banks is the FTSE350 Banks Index:-

Source: Bigcharts.com
The high in 2007 was 11,263, the low in March 2009, 2,782 – a 75% decline. The index nearly doubled in in the next six months, reaching 5,224 in September of the same year. This June the index failed to break to a new low after the Brexit vote. A base is forming – the banking sector may not have seen the last of fines and regulation but I believe the downside is limited.