Macro Letter – No 139 – 18-06-2021
Commodities, Supply-chains and Structural Changes in Demand
- Talk of a new commodity super-cycle may be premature
- Once GDP growth returns to trend, commodity demand will moderate
- Fiscal and monetary relief are key to maintaining growth and demand
- Structural changes in energy demand will prove more persistent
As the spectre of inflation begins to haunt economists, many market commentators have started to focus on commodity prices in an attempt to predict the likely direction of the general price level for goods and services. This indexing of the most heterogeneous asset class has always struck me as destined to disappoint. Commodity prices change in response to, often, small variation in supply or demand and the price of some commodities varies enormously from one geographic location to another. Occasionally the majority of commodities rise in tandem but more frequently they dance to their own peculiar tunes.
Commodity analysts tend to focus on Energy and Industrial Metals foremost; Agricultural Commodities, which are more diverse by nature are often left as a footnote. Occasionally, however, a demand-side event occurs which causes nearly all sectors to rise. The Covid-19 event was just such a shock, disrupting global supply-chains and consumer demand patterns simultaneously.
The chart below shows the CRB Index since 1995: –
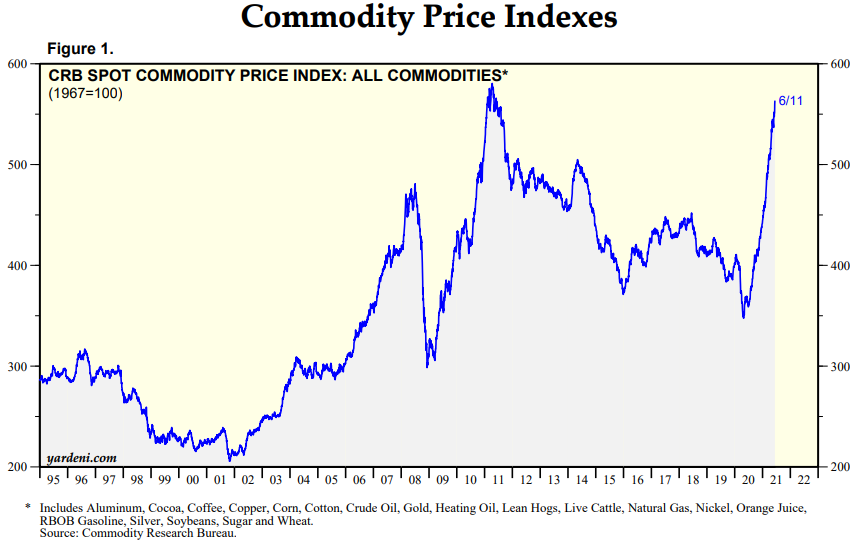
Source: CRB, Yardeni
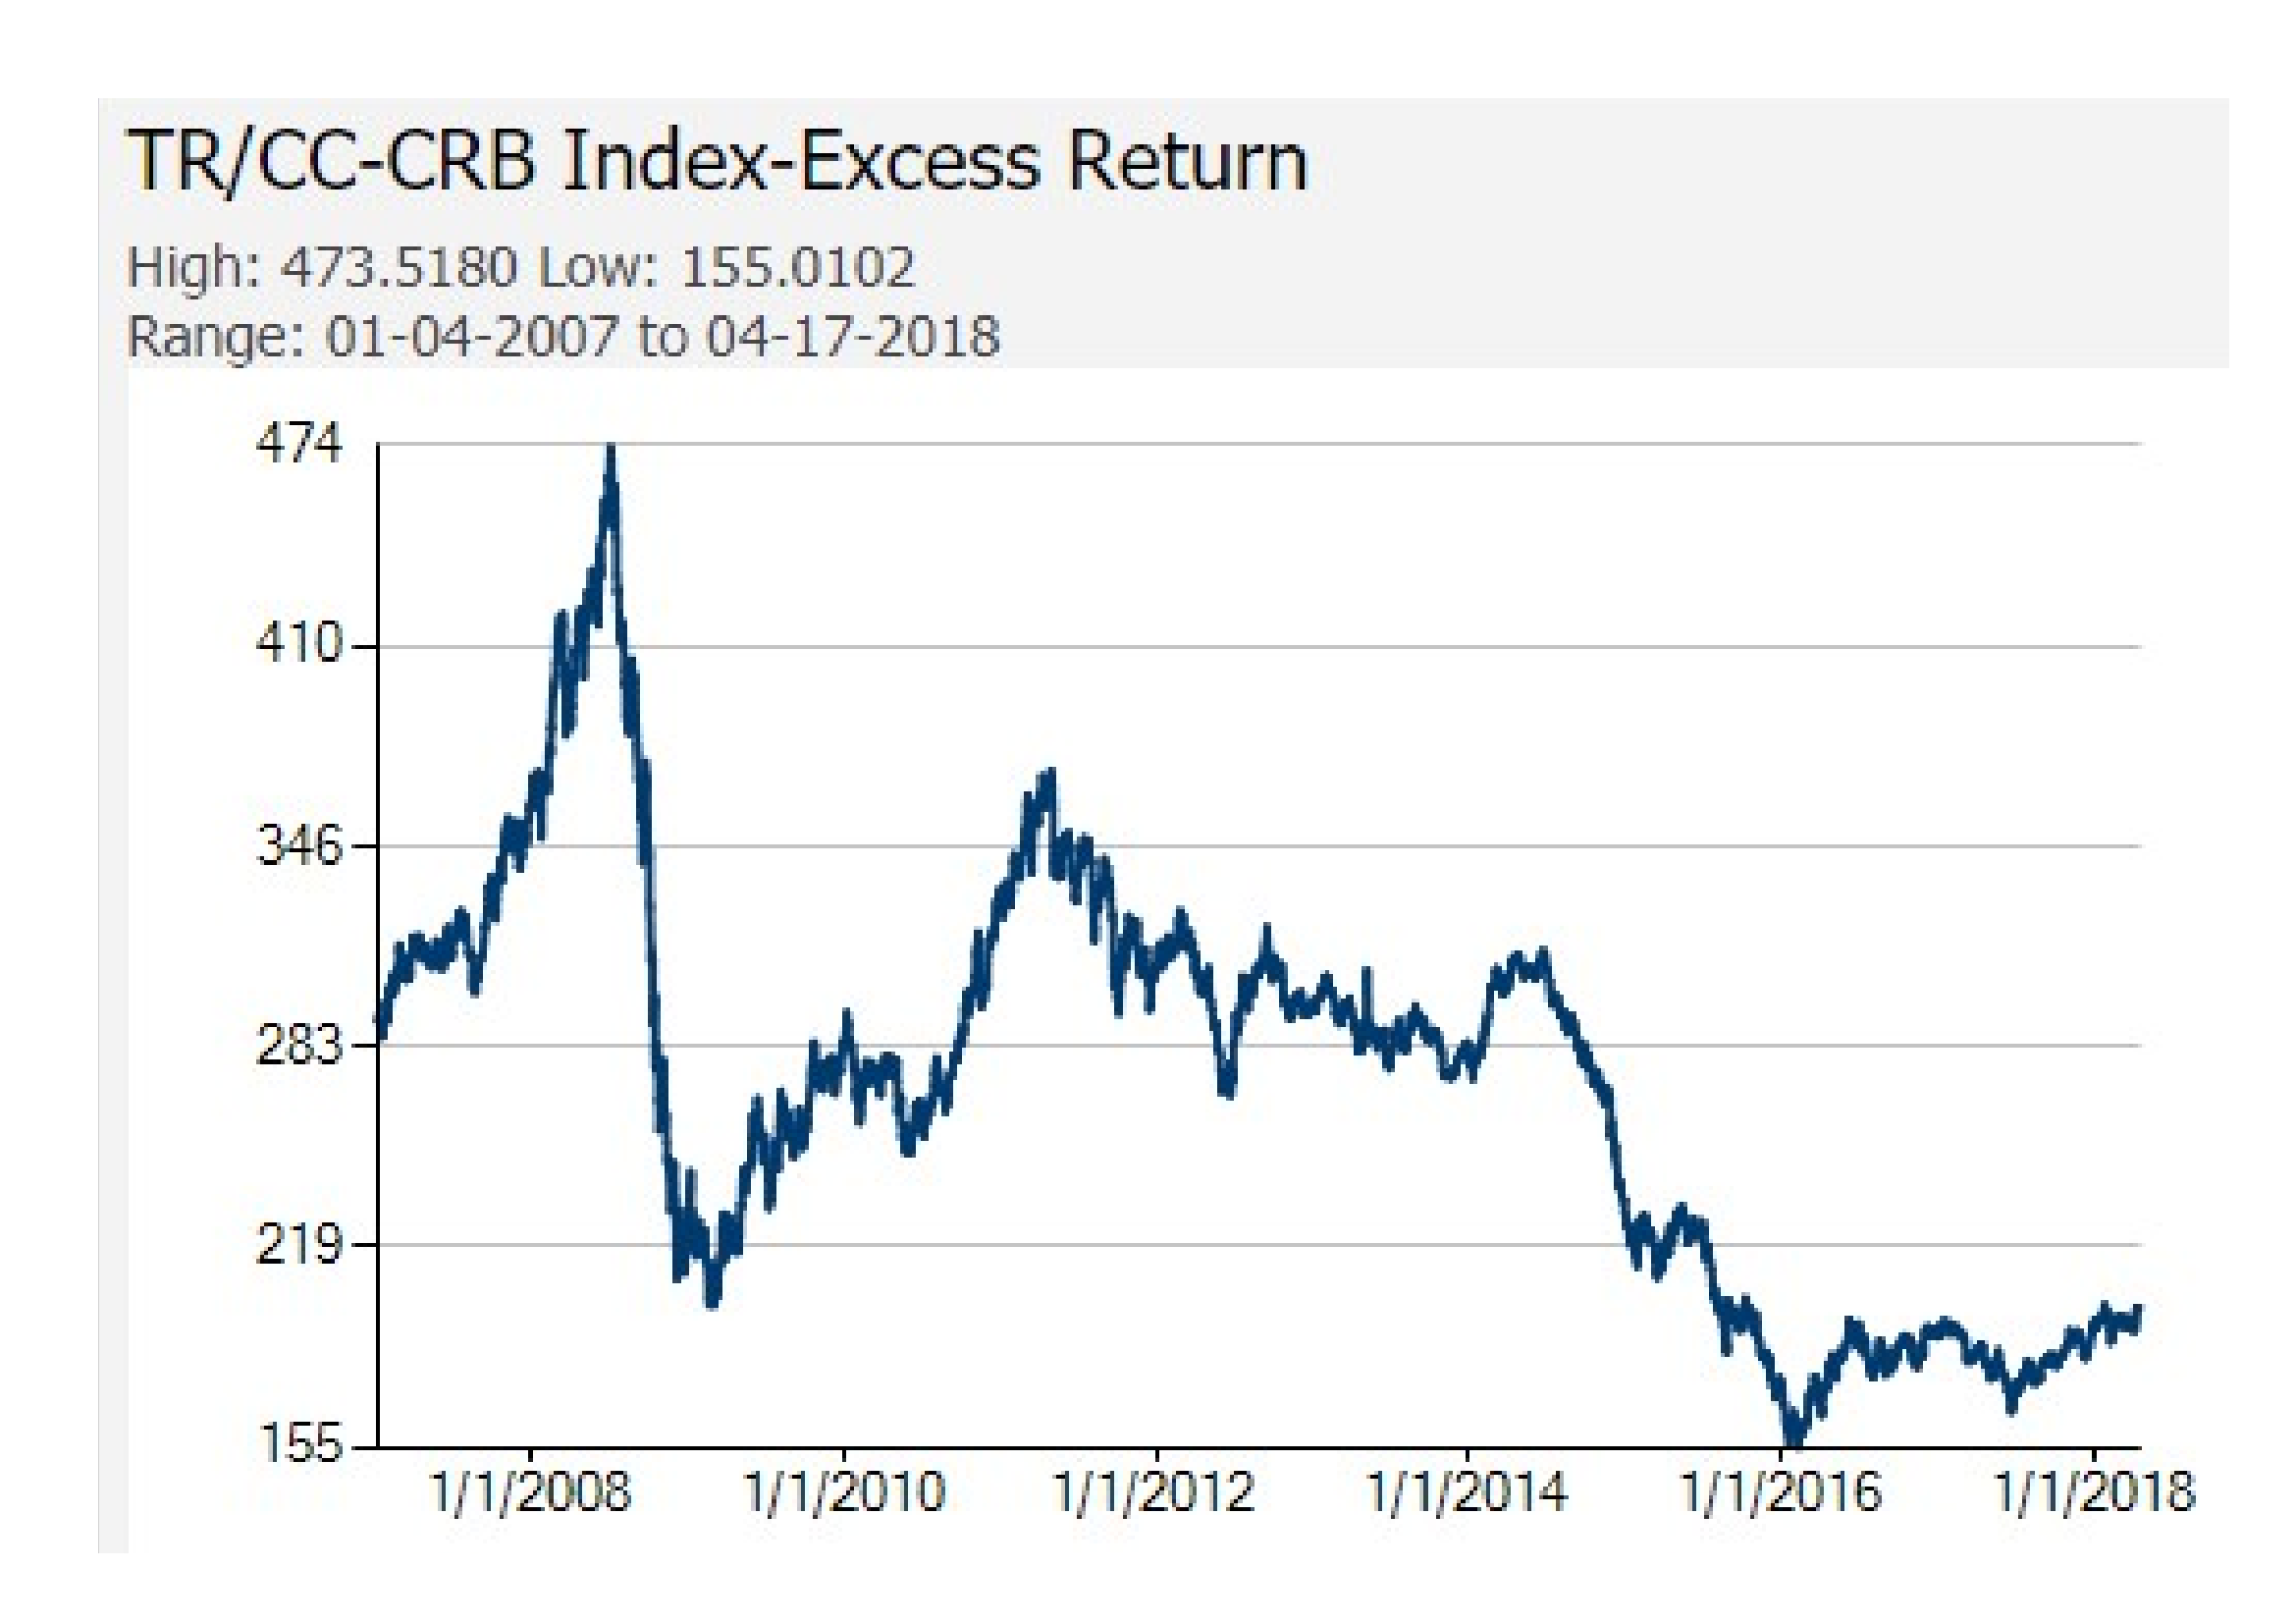
This chart looks very different to the energy heavy GSCI Index, which is weighted on the basis of liquidity and by the respective world production quantities of its underlying components: –

Source: S&P GSCI, Trading Economics
The small rebound on the chart above is not that insignificant, however, it equates to a 55% rise since the lows on 2020. The fact that prices collapsed, as the pandemic broke, and subsequently soared, as vaccines allowed economies to reopen, is hardly surprising. Economic cycles wield a powerful influence over commodity prices; short-term, inelastic, supply, confronted by an unexpected jump in demand, invariably precipitates sharp price increases.
The lockdown which followed the initial outbreak of the virus, led to an abrupt change in consumer demand; hotels and travel were out, remote working was in. Whilst house prices were already supported by a sharp lowering of interest rates and debt forbearance measures, the price of lumber, for home improvements and property extensions, exploded: –
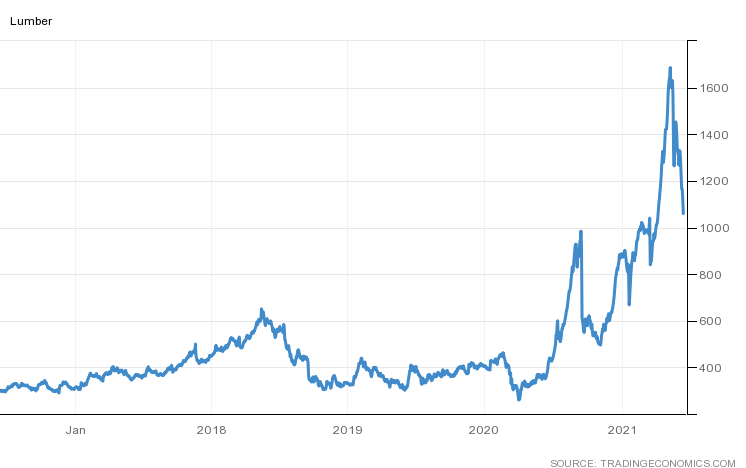
Source: Trading Economics
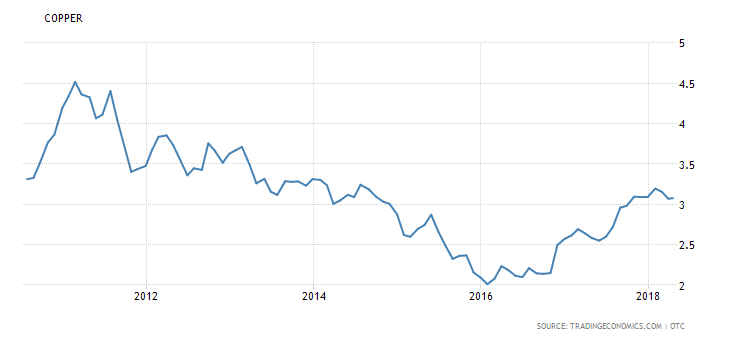
Similar patterns were evident in Steel and Copper, but also due to shortages and bottlenecks in the semiconductor supply-chain, which led a slowing of automobile production, in turn prompting a rise in the price of both for new and used cars.
The recent resurgence in commodity prices has encouraged suggestions that a new commodity super-cycle is underway, however, these are relatively rare events. The most recent cycle is generally thought to have begun with the rise of Chinese demand in the late 1990’s and ended abruptly with the financial crisis in 2008/2009. Since the crisis Chinese growth has moderated, although the rise of India may see another wave of rapid industrialisation at some point. The chart below, however, portrays a different narrative, suggesting that the 2008 peak was merely a corrective wave from the 1980 peak. The new super-cycle has just begun, it will peak some-time around 2045: –
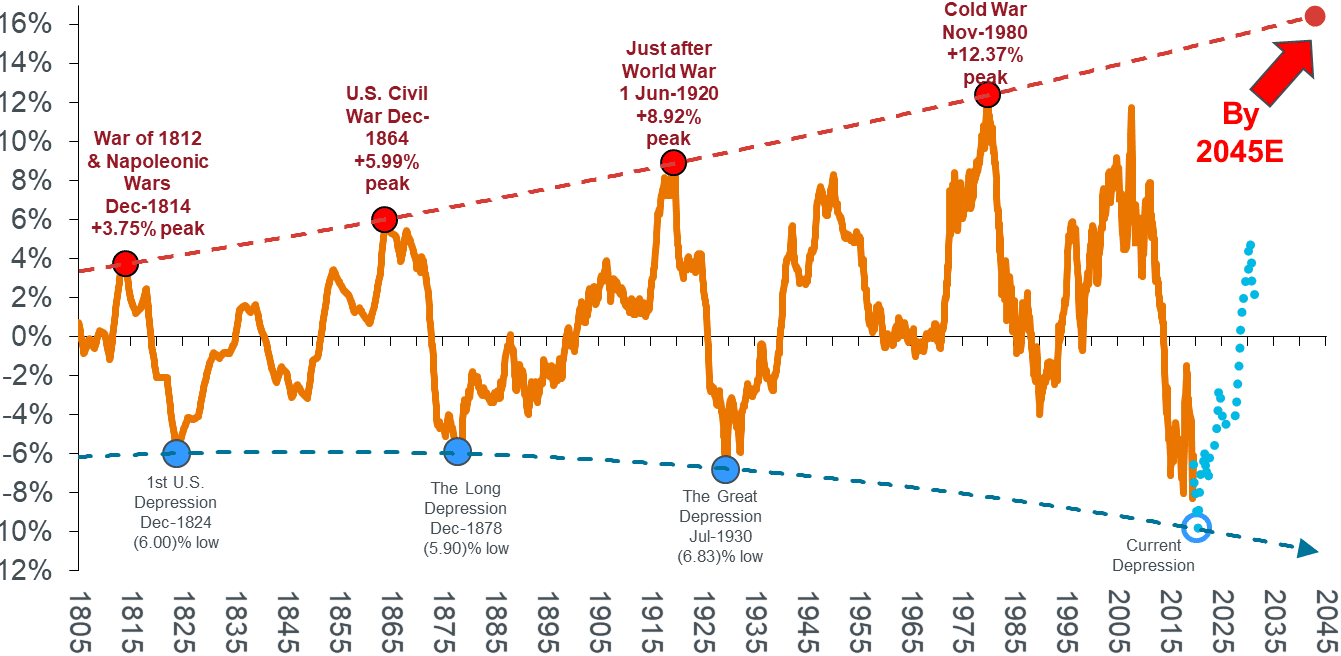
Source: Janus Henderson, Stifel Report June 2020. Note: Shown as 10yr rolling compound growth rate with polynomial trend at tops and bottoms. Blue dotted line illustrates a forecast estimation. Warren & Pearson Commodity Index (1795-1912), WPI Commodities (1913-1925), equal-weighted (1/3rd ea.) PPI Energy, PPI Farm Products and PPI Metals (Ferrous and Non-Ferrous) ex-precious metals (1926-1956), Refinitiv Equal Weight (CCI) Index (1956-1994), and Refinitiv Core Commodity CRB Index (1994 to present).
Another short-term factor, which has exacerbated the rise in the price of key commodities over the past year, is the ongoing trade tensions between the US and China. Tariff increases have increased costs for importers and wholesalers, meanwhile the effect of the Great Financial Crisis has been evident for the past decade in the shortening of global supply-chains. Covid accelerated this de-globalisation, forcing many firms to seek out new sources of supply. The long-run effect of these adjustments will be stronger, deeper supply-chains, but the short-run cost must be paid for by the importer, the producer or the consumer.
A part of the new commodity super-cycle argument is based on more structural factors. The reduction of carbon emissions will entail the use of vast amounts of metals. Electrification calls for copper; silver will be needed for photovoltaic panels; electric vehicles require aluminium, nickel, graphite, cobalt and lithium, together with numerous rare-earth metals – of which China is fast becoming the monopoly supplier.
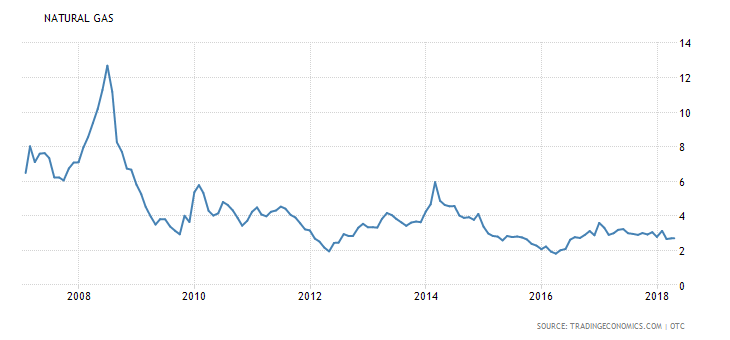
The last great structural shift in energy was from coal to oil. Colonel Drake’s discovery in Pennsylvania in 1859 and the Spindletop find in Texas in 1901 set the stage for the new oil economy, yet it took until 1919 for gasoline sales to exceed those of kerosene.
Although coal-gas was used for most of the 19th century and the first US natural gas pipeline was built in 1891, prior to the 1920s, the vast majority of natural gas produced as a by-product of oil extraction was simply flared away. Superior welding techniques during the interwar years marked a boom in natural gas adoption, but major pipelines were still under construction as late as the 1960’s.
The time-line from Colonel Drake striking pay-dirt in 1859 to mass natural gas adoption took more than a century. Technology and innovation move at a much faster pace today, yet the infrastructural investment needed to transform from carbon to renewable energy will take decades rather than years.
Meanwhile, there remain shorter-term reasons to doubt the arrival of a new commodity super-cycle so precipitously upon the last. Chinese GDP growth has fallen sharply from the double-digit rates of the last decade. Its working age population is shrinking, added to which the People’s Bank of China seem reluctant to allow credit expansion on the scale of previous cycles. Rebalancing towards domestic consumption continues to be official policy.
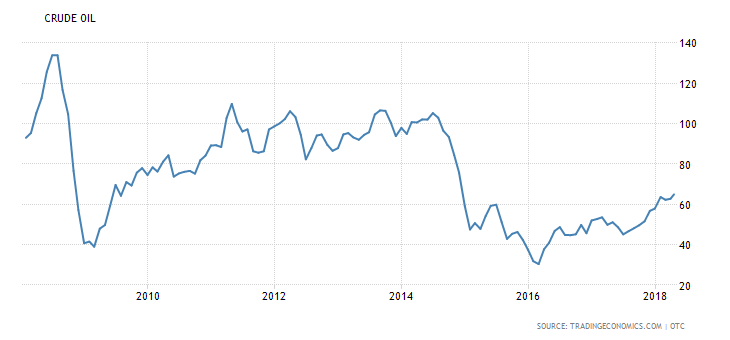
There is near-term evidence of energy supply constraints but over the longer-run oil and gas production, especially from the likes of the US frackers, can raise output rapidly in response to increases in the price of Crude. The chart below shows the fluctuations in the Baker Hughes US Oil Rig count over the past decade, no shortage of capacity is apparent here: –

Source: Baker Hughes, Trading Economics
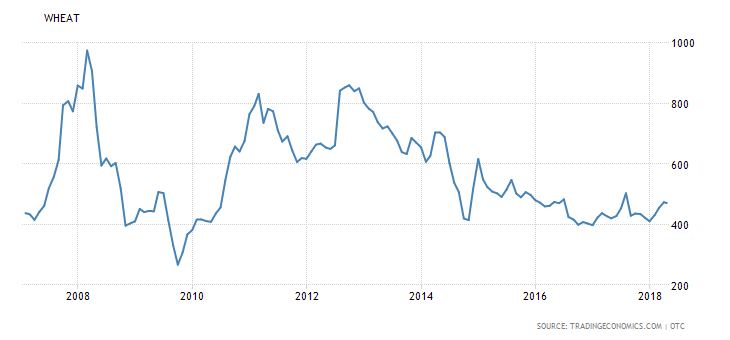
Agricultural commodities tend to operate on even shorter supply cycles. If supply constraints send Wheat prices higher, farmers respond by switching away from Corn. Seasonal adjustments can be rapid.
The GSCI may have hit its lowest since the 1980’s last April and prices may have doubled since then, but it is still more than 75% below its June 2008 peak. Further upside may be seen as the global economy makes up for a year of lost economic growth, but as economic growth returns to normality demand for energy is likely to moderate just as fresh supply comes on stream.
The spending plans of the US administration may maintain demand in the US but China seems determined to nip its domestic credit bubble in the bud. In broad terms these factors counter-balance one another. According to the Federal Reserve, US GDP is forecast to range between 5% and 7.3% in 2021, falling to 2.5% to 4.4% in 2022 and 1.7% to 2.6% in 2023, meanwhile, according to the OECD, Chinese growth will moderate from 8.5% in 2021 to 5.8% in 2022.
Conclusion and Investment Opportunities
Back in January Goldman Sachs predicted a new commodity super-cycle. They see rising wages leading to faster, commodity price positive, home formation and more synchronised social policies, akin to those of 1960s ‘War on Poverty’ campaign. In other respects they believe this cycle has stronger parallels to the 1970s than the 2000s. Goldman expect industrial capex to run at 2000 levels whilst social rebuilding generates a 1970s style consumer boom.
S&P present some of these arguments in a useful infographic: –
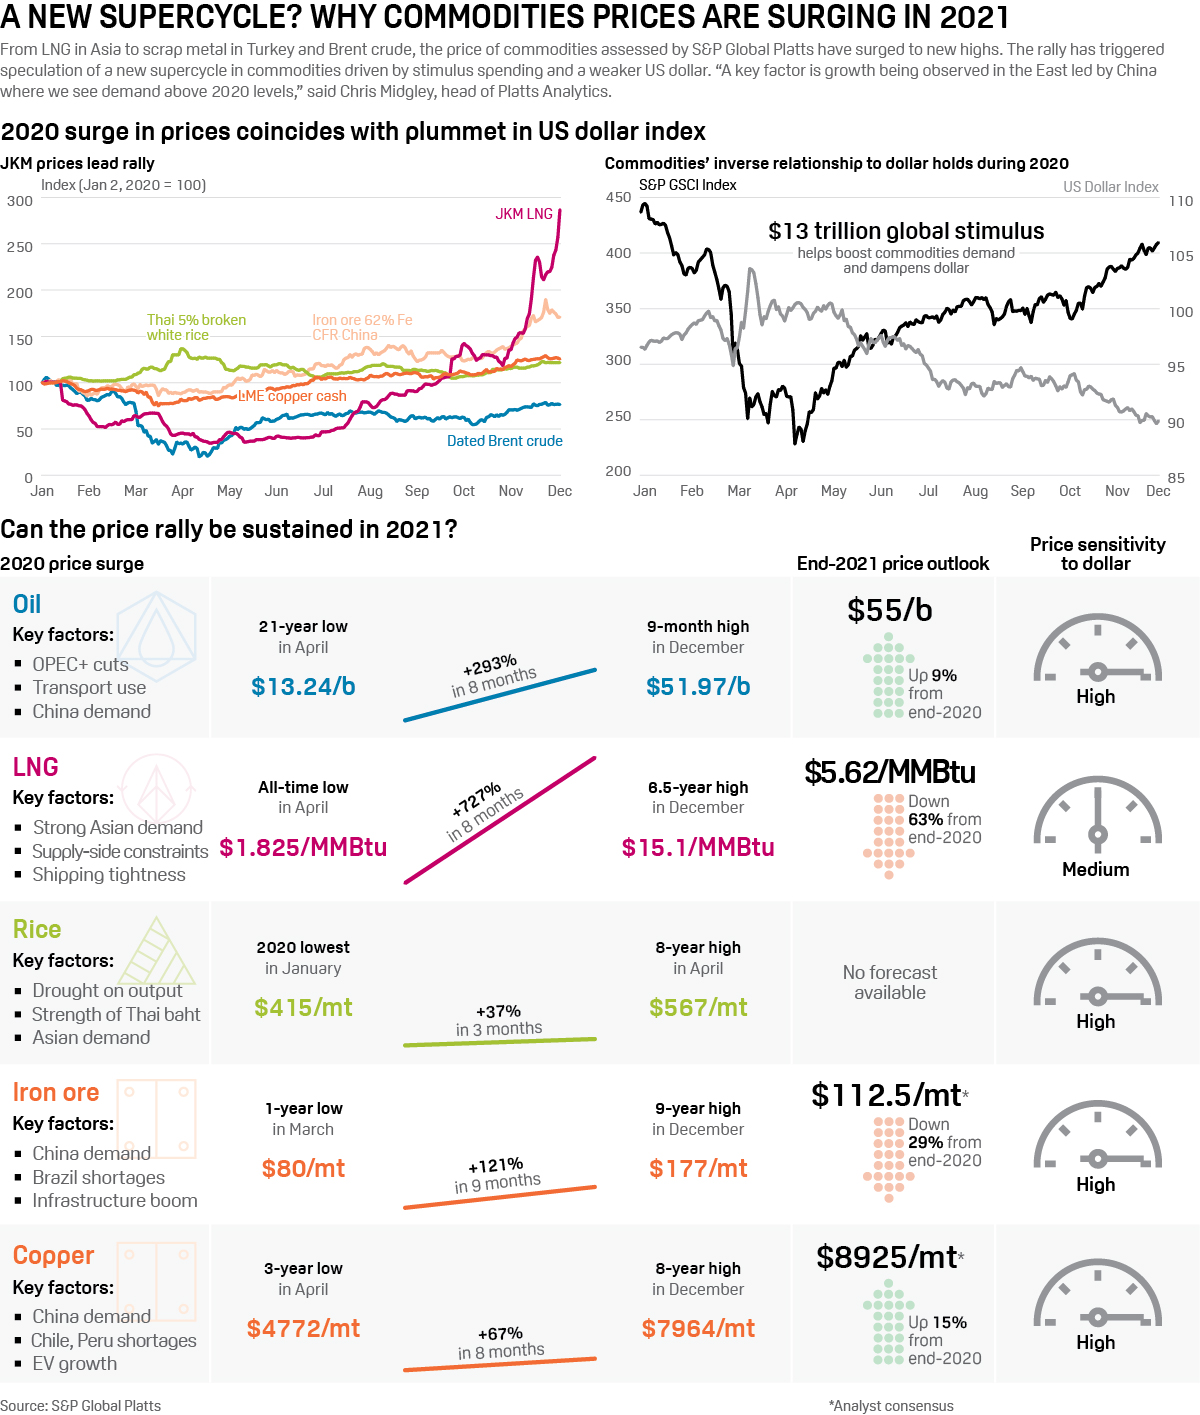
Source: S&P Global
US unemployment has fallen from 11.1% to 5.8% during the last 12 months, even in the harder hit Euro Area it has declined from 8.7% to 8%, whilst Chinese data has followed a similar trajectory, falling from 6.1% to 5% since February 2020. Nonetheless, much of the global economy remains in some form of lockdown, with economic activity fuelled by fiscal spending. It remains difficult to envisage the conditions for a near-term sustainable economic boom. Remove global monetary and fiscal relief and commodity demand will evaporate.
As a general rule, in commodity and financial markets, what goes up price must eventually come back down. The price of US Stud Lumber (chart above) is well off its highs. Governments and their central bankers can attempt to remove the punch-bowl, but the markets are unlikely to take it well.