Brexit, Grexit and the rise and fall and rise again of the Euro

400dpiLogo

Macro Letter – No 54 – 06-05-2016

Brexit, Grexit and the rise and fall and rise again of the Euro

  • Should the UK leave the EU, Euro volatility will follow
  • If the UK remains, the Euro experiment might still be scuppered
  • The problems of the EU periphery are not solved by the UK remaining

Whilst the majority of articles between now and the 23rd June will focus on whether the UK will leave or remain in the EU and what this might mean, I want to consider the impact Brexit is likely to have on the long-run fortunes of the Euro.

Since December 2008 the EURGBP has fallen from 0.979 to a low of 0.694 in July 2015. Since the end of last year concern, about the outcome of a UK referendum on whether to remain or leave the EU, has seen the EUR strengthen to 0.810 – just over a 38.2% retracement. The UK economy has already begun to show signs of economic slowdown due to uncertainty. A vote to leave is likely to have a negative impact on the GBP, initially, if for no other reason than the continuation of uncertainty; neither the government nor the opposition has presented a road map for exit should the electorate decide to leave. In the event of a UK departure I could envisage a move back to 0.865 or even 0.971:-

EURGBP 10 yr

Source: fxtop.com

I believe the impact on the UK economy of Brexit would therefore be a substantial weakening of the GBP, a rise in UK inflation and an initial slowing of economic growth. Our exports would rise and our imports would decline, improving our trade balance. Those European countries for whom the UK is their largest export market would suffer.

The cost of the UK leaving the EU would not stop there. The UK is the second largest member of the union. In terms of the economic and political strength of the EU, Britain’s inclusion is significant. By leaving the Schengen Agreement area we would impose higher costs on the remaining members, potentially hastening its interruption or demise. The ECIPE Five Freedom Project – The Cost of Non-Schengen for the Single Market published this week, provides an alarming vision of what that cost to EU growth might be:-

If Schengen would be suspended for the two-year period or even in full, trade and economic growth in the EU could be severely damaged. The Schengen Agreement is not just a symbol of European integration, it creates real economic value by facilitating cross-border exchange. Obviously, the Schengen Agreement promotes the free movement of people, but that is not all. It also boosts the flow of goods, services and capital across borders.

…In 2015 intra-EU trade in goods made up for approximately 60% of the EU’s overall trade.

…The Bertelsmann Stiftung estimated the impact of reintroduced border controls on the EU’s gross domestic product (GDP). Border checks which stop and control trucks cause time delays which increase transport costs and lead to higher product prices. According to their results these higher product prices can cause a yearly reduction in GDP growth of 0.04 percentage points compared to intra-EU trade with open borders. Furthermore, the study argues that the time delays at the border would make just-in-time production and decentralized production more difficult for European firms. As a result, production costs for intra-European value chains would increase and the price competitiveness of European producers would decrease. This could affect location and investment decisions by foreign firms.

A recent Ifo study finds that for EU member states the removal of border controls leads to an increase of 3.8% in goods trade or a cost saving equivalent to a tariff reduction of 0.7 percentage points for every internal border which a good needs to cross. As a result, countries which are at the periphery of the Schengen Area benefit more from the Agreement because their costs savings are greater if goods have to cross several borders until they reach their markets.

Such an integral pillar of EU membership as the Schengen Agreement may not be suspended, but concerns about the indebtedness of some of the more profligate peripheral countries is likely to return to the fore by the summer. As reported earlier this week by Reuters – Greek bank stocks could rise 90 percent on bailout cash deal: Morgan Stanley:-

…upgraded Greek banks to “overweight” saying current valuations did not reflect the compression in bond yield spreads that would follow a deal with Athens’ lenders and took an overly pessimistic view on the banks’ return on equity targets.

The Economist – The threat of Grexit never really went away sees it rather differently: –

Greece badly needs the next dollop of the €86 billion ($99 billion) bail-out creditors promised it last summer, in exchange for promises of austerity and reform. But it will not get the money until the creditors complete a review of its progress, which has been dragging on since November. The government has scraped together enough cash (by raiding independent public agencies) to pay salaries and pensions in May, perhaps even in June. But by July 20th, when a bond worth more than €2 billion matures, the country once again faces default and perhaps a forced exit from the euro zone. The threat of Grexit is not exactly back; it never really went away.

Meanwhile the creation of the “Atlas Fund” which will purchase non-performing loans of Italian banks which are in distress, appears to have averted the, potentially fatal, run on the Italian banking system which was developing earlier this year. Bruegel – Italy’s Atlas bank bailout fund: the shareholder of last resort takes up the story:-

Italy’s new bank fund Atlas might be what is needed in the short run, but in the longer term the fund will increase systemic risk. What ultimately matters is how this initiative will affect the quality of bank governance, a key issue for the future resilience of the system.

The Atlas fund has a heavy task, although probably not as heavy as that of its mythological namesake. In the short run, it might be what most commentators have described: an imperfect but needed second-best way to avoid bail-in and resolution, matching repeated calls from the Bank of Italy for a revision of the Bank Recovery and Resolution Directive (BRRD) framework after Italy negotiated and approved it.

However, by acting as a bank shareholder of last resort the fund increases systemic risk in the longer term, weakening the stronger banks and involving a publicly controlled institution whose main source of funding is postal savings into a rather risky venture.

While it’s unclear whether the aim is to keep foreign capital out of the Italian banking system, what ultimately matters is how this initiative will affect (or avoid affecting) the quality of bank governance, a key issue for the future resilience of the system. Regardless of whether we think that keeping weak banks alive at all costs is a good idea, the idea of such a shareholder of last resort appears at odds with the aim of making progress towards a solid European Banking Union.

Conclusion

The implications of a UK exit from the EU would, initially, lead to a strengthening EURGBP, although not necessarily EURUSD. This will be followed by a period of increased uncertainty about the survival of the Eurozone (EZ) during which the EUR will decline against its main trading partners. The chart below shows the Euro effective Exchange rate over the last 15 years:-

real_effective_exchange_rate_reer_monthly_index_base_year_100

Source: Bluenomics, Eurostat

Once the first country leaves the EZ, sentiment will change once more. Investors will realise that the departure of the periphery strengthens the prospects of the currency union for those countries which remain; the EUR will begin to look less like a Drachma and more like a Deutschemark. The 2009 highs on the chart above will be within reach and a long-term trajectory similar to, though less steep than, the path of the CHF could become the norm.

For those who thrive on market volatility, over the next few years, opportunities to trade the EUR will be golden.

US growth – has the windfall of cheap oil arrived or is there a spectre at the feast?

400dpiLogo

Macro Letter – No 53 – 22-04-2016

US growth – has the windfall of cheap oil arrived or is there a spectre at the feast?

  • Oil prices have been below $60/bbl since late 2014
  • The benefit of cheaper oil is being felt across the US
  • Without lower oil prices US growth would be significantly lower
  • Increasing levels of debt are stifling the benefits of lower prices

In this letter I want to revisit a topic I last discussed back in June 2015 – Can the boon of cheap energy eclipse the collapse of energy investment? In this article I wrote:-

The impact of the oil price collapse is still feeding through the US economy but, since the most vulnerable states have learnt the lessons of the 1980’s and diversified away from an excessive reliance of on the energy sector, the short-run downturn will be muted whilst the long-run benefits of new technology will be transformative. US oil production at $10/barrel would have sounded ludicrous less than five years ago: today it seems almost plausible.

This week the San Francisco Fed picked up the theme in their FRBSF Economic Letter – The Elusive Boost from Cheap Oil:-

The plunge in oil prices since the middle of 2014 has not translated into a dramatic boost for consumer spending, which has continued to grow moderately. This has been particularly surprising since the sharp drop should free up income for households to use toward other purchases. Lessons from an empirical model of learning suggest that the weak response may reflect that consumers initially viewed cheaper oil as a temporary condition. If oil prices remain low, consumer perceptions could change, which would boost spending.

Given the perceived wisdom of the majority of central banks – that deflation is evil and must be punished – the lack of consumer spending is a perfect example of the validity of the Fed’s inflation targeting policy; except that, as this article suggests, deflations effect on spending is transitory. I could go on to discuss the danger of inflation targeting, arguing that the policy is at odds with millennia of data showing that technology is deflationary, enabling the consumer to pay less and get more. But I’ll save this for another day.

The FRBSF paper looks at the WTI spot and futures price. They suggest that market participants gradually revise their price assumptions in response to new information, concluding:-

The steep decline in oil prices since June 2014 did not translate into a strong boost to consumer spending. While other factors like weak foreign growth and strong dollar appreciation have contributed to this weaker-than-expected response, part of the muted boost from cheaper oil appears to stem from the fact that consumers expected this decline to be temporary. Because of this, households saved rather than spent the gains from lower prices at the pump. However, continued low oil prices could change consumer perceptions, leading them to increase spending as they learn about this greater degree of persistence.

In a related article the Kansas City Fed – Macro Bulletin – The Drag of Energy and Manufacturing on Productivity Growth observes that the changing industry mix away from energy and manufacturing, towards the production of services, has subtracted 0.75% from productivity growth. They attribute this to the strength of the US$ and a decline in manufacturing and mining.

…even if the industry mix stabilizes, the relative rise in services and relative declines in manufacturing and mining are likely to have a persistent negative effect on productivity growth going forward.

The service and finance sector of the economy has a lower economic multiplier than the manufacturing sector, a trend which has been accelerating since 1980. A by-product of the growth in the financial sector has been a massive increase in debt relative to GDP. By some estimates it now requires $3.30 of debt to create $1 of GDP growth. A reduction of $35trln would be needed to get debt to GDP back to 150% – a level considered to be structurally sustainable.

Meanwhile, US corporate profits remain a concern as this chart from PFS group indicates:-

corporate-profits-peak

Source: PFS Group, Bloomberg

The chart below from Peter Tenebrarum – Acting Man looks at whole economy profits – it is perhaps more alarming still:-

saupload_4-whole-economy-profits

Source: Acting Man

With energy input costs falling, the beneficiaries should be non-energy corporates or consumers. Yet wholesale inventories are rising, total business sales seem to have lost momentum and, whilst TMS-2 Money Supply growth remains solid at 8%, it is principally due to commercial and industrial lending.

US oil production has fallen below 9mln bpd versus a peak of 9.6mln. Rig count last week was 351 down three from the previous week but down 383 from the same time last year. Meanwhile the failure of Saudi Arabia to curtail production, limits the potential for the oil market to rally.

From a global perspective, cheap fuel appears to be cushioning the US from economic headwinds in other parts of the world. Employment outside mining and manufacturing is steady, and wages are finally starting to rise. However, the overhang of debt and muted level of house price appreciation has dampened the animal spirits of the US consumer:-

US-house-prices-_Federal_Housing_Finance_Agency

Source: Global Property Guide, Federal Housing Finance Agency

According to the Dallas Fed – Increased Credit Availability, Rising Asset Prices Help Boost Consumer Spendingthe consumer is beginning to emerge:-

A combination of much less household debt, revived access to consumer credit and recovering asset prices have bolstered U.S. consumer spending. This trend will likely continue despite an estimated 50 percent reduction since the mid-2000s of the housing wealth effect— an important amplifier during the boom years.

…Since the Great Recession, the ratio of household debt-to-income has fallen back to about 107 percent, a more sustainable—albeit relatively high—level.

…The wealth-to-income ratio rose from about 530 percent in fourth quarter 2003 to 650 percent in mid-2007 as equity and house prices surged. Not surprisingly, consumer spending also jumped.

The conventional estimate of the wealth effect—the impact of higher household wealth on aggregate consumption—is 3 percent, or $3 in additional spending every year for each $100 increase in wealth.

…Recent research suggests that the spendability, or wealth effect, of liquid financial assets—almost $9 for every $100—is far greater than the effect for illiquid financial assets, which explains why falling equity prices do not generate larger cutbacks in aggregate consumer spending. Other things equal, higher mortgage and consumer debt significantly depress consumer spending.

…The estimated housing wealth effect varies over time and captures the ability of consumers to tap into their housing wealth. It rose steadily from about 1.3 percent in the early 1990s to a peak of about 3.5 percent in the mid- 2000s. It has since halved, to about the same level as that of the mid-1990s. During the subprime and housing booms, rising house prices and housing wealth effects propagated and amplified expansion of consumption and GDP.

During the bust, this mechanism went into reverse. High levels of mortgage debt, falling house prices and a reduced ability to tap housing equity generated greater savings and reduced consumer spending. Fortunately, house prices have recovered, deleveraging has slowed or stopped, and consumer spending is strong, even though the housing wealth effect is only half as large as it was in the mid-2000s.

Countering the positive spin placed on the consumer credit data by the Dallas Fed is a recent interview with  Odysseas Papadimitriou, CEO of CardHub by Financial Sense – Credit Card Debt Levels Reaching Unsustainable Levels:-

In 2015, we accumulated almost $71 billion in new credit card debt. And for the first time since the Great Recession, we broke the $900 billion level in total credit card debt so we are back on track in getting to $1 trillion.

total-consumer-credit-outstanding

Source: Bloomberg, Financial Sense

Another factor which has been holding back the US economy has been the change in the nature of employment. Full-time jobs have been replaced by lower paying part-time roles and the participation rate has been in decline. This may also be changing, but is likely to be limited, as the Kansas City Fed – Flowing into Employment: Implications for the Participation Rate reports:-

After a long stretch of declines, the labor force participation rate has risen in recent months, driven in part by an increase in the share of prime-age people flowing into employment from outside the labor force. So far, this flow has remained largely confined to those with higher educational attainment, suggesting further increases in labor force participation rate could be relatively limited.

…Overall, the scenarios show that while more prime-age people could enter the labor force in the coming years, the cyclical improvement in the overall participation rate may be limited to the extent only those with higher educational attainment flow into employment. In addition, the potential increase in the participation rate could be constrained by other factors such as an increase in the share of prime-age population that reports they are either retired or disabled and a limited pool of people saying they want a job, even if they have not looked recently. Thus, while higher NE flow indicates the prime-age participation rate could increase further, it will likely remain lower than its pre-recession rate.

Conclusion

At the 2015 EIA conference Adrian Cooper of Oxford Economics gave a presentation – The Macroeconomic Impact of Lower Oil Prices – in which he estimated that a $30pb decline in the oil price would add 0.9% to US GDP between 2015 and 2017. If this estimate is correct, lower oil is responsible for more than a quarter of the current US GDP growth. It has softened the decline from 2.9% to 2% seen over the last year.

I would argue that the windfall of lower oil prices has already arrived, it has shown up in the deterioration of the trade balance, the increase in wages versus consumer prices and the nascent rebound in the participation rate. That the impact has not been more dramatic is due to the headwinds on excessive debt and the strength of the US$ TWI – it rose from 103 in September 2014 to a high of 125 in January 2016. After the G20 meeting Shanghai it has retreated to 120.

According to the March 2015 BIS – Oil and debt report, total debt in the Oil and Gas sector increased from $1trln in 2006 to $2.5trln by 2015. The chart below looks at the sectoral breakdown of US Capex up to the end of 2013:-

US CAPEX by sector

Source: Business Insider, Compustat, Goldman Sachs

With 37% allocated to Energy and Materials by 2013 it is likely that the fall in oil prices will act as a drag on a large part of the stock market. Energy and Materials may represent less than 10% of the total but they impact substantially in the financial sector (15.75%).

Notwithstanding the fact that corporate defaults are at the highest level for seven years, financial institutions and their central bank masters will prefer to reschedule. This will act as a drag on new lending and on the profitability of the banking sector.

The table below from McGraw Hill shows the year to date performance of the S&P Spider and the sectoral ETFs. This year Financials are taking the strain whilst Energy has been the top performer – over one year, however, Energy is still the nemesis of the index.

Sector SPDR Fund % Change YTD % Change 1 year
S&P 500 Index 2.86% 0.10%
Consumer Discretionary (XLY) 2.23% 5.05%
Consumer Staples (XLP) 4.16% 6.83%
Energy (XLE) 10.20% -19.16%
Financial Services (XLFS) -2.49% 0.00%
Financials (XLF) -1.22% -2.85%
Health Care (XLV) -1.01% -3.31%
Industrials (XLI) 6.41% -0.07%
Materials (XLB) 8.45% -5.78%
Real Estate (XLRE) 1.98% 0.00%
Technology (XLK) 3.60% 5.19%
Utilities (XLU) 10.74% 7.08%

Source: McGraw Hill

The benefit of lower oil and gas prices will continue, but, until debt levels are reduced, anaemic GDP growth is likely to remain the pattern for the foreseeable future. In Hoisington Investment Management – Economic Review – Q1 2016 – Lacy Hunt makes the following observation:-

The Federal Reserve, the European Central Bank, the Bank of Japan and the People’s Bank of China have been unable to gain traction with their monetary policies…. Excluding off balance sheet liabilities, at year-end the ratio of total public and private debt relative to GDP stood at 350%, 370%, 457% and 615%, for China, the United States, the Eurocurrency zone, and Japan, respectively…

The windfall of cheap oil has arrived, but cheap oil has been eclipsed by the beguiling spectre of cheap debt.

Quantitative to qualitative – is unelected nationalisation next?

400dpiLogo

Macro Letter – No 52 – 08-04-2016

Quantitative to qualitative – is unelected nationalisation next?

  • Negative interest rates are reducing the velocity of circulation
  • Qualitative easing is on the rise
  • Liquidity in government bond markets continues to decline
  • A lack of liquidity in equity markets will be next

Last year, in a paper entitled The Stock Market Crash Really Did Cause the Great Recession – Roger Farmer of UCLA argued that the collapse in the stock market was the cause of the Great Recession:-

In November of 2008 the Federal Reserve more than doubled the monetary base from eight hundred billion dollars in October to more than two trillion dollars in December: And over the course of 2009 the Fed purchased eight hundred billion dollars worth of mortgage backed securities. According to the animal spirits explanation of the recession (Farmer, 2010a, 2012a,b, 2013a), these Federal Reserve interventions in the asset markets were a significant factor in engineering the stock market recovery.

The animal spirits theory provides a causal chain that connects movements in the stock market with subsequent changes in the unemployment rate. If this theory is correct, the path of unemployment depicted in Figure 8 is an accurate forecast of what would have occurred in the absence of Federal Reserve intervention. These results support the claim, in the title of this paper, that the stock market crash of 2008 really did cause the Great Recession.

Central banks (CBs) around the globe appear to concur with his view. Their response to the Great Recession has been the provision of abundant liquidity – via quantitative easing – at ever lower rates of interest. They appear to believe that the recovery has been muted due to the inadequate quantity of accommodation and, as rates drift below zero, its targeting.

The Federal Reserve (Fed) was the first to recognise this problem, buying mortgages as well as Treasuries, perhaps guided by the US Treasury’s implementation of TARP in October 2008. The Fed was fortunate in being unencumbered by the political grid-lock which faced the European Central Bank (ECB). They acted, aggressively and rapidly, hoping to avoid the policy mistakes of the Bank of Japan (BoJ). The US has managed to put the great recession behind it. But at what cost? Only time will tell.

Other major CBs were not so decisive or lucky. In the immediate aftermath of the sub-prime crisis the Swiss Franc (CHF) rose – a typical “safe-haven” reaction. The SNB hung on grimly as the CHF appreciated, especially against the EUR, but eventually succumbed to “the peg” in September 2011 after the Eurozone (EZ) suffered its first summer of discontent. It was almost a year later before ECB President Draghi uttered his famous “Whatever it takes” speech on 26th July 2012.

Since 2012 government bond yields in the EZ, Switzerland, Japan and the UK have fallen further. In the US yields recovered until the end of 2013 but have fallen once more as international institutions seek yield wherever they can.

By 2013 CBs had begun to buy assets other than government bonds as a monetary exercise, in the hope of simulating economic growth. Even common stock became a target, since they were faced with the same dilemma as other investors – the need for yield.

In late April 2013 Bloomberg – Central Banks Load Up on Equities observed:-

Central banks, guardians of the world’s $11 trillion in foreign-exchange reserves, are buying stocks in record amounts as falling bond yields push even risk-averse investors toward equities.

In a survey of 60 central bankers…23 percent said they own shares or plan to buy them. The Bank of Japan, holder of the second-biggest reserves, said April 4 it will more than double investments in equity exchange-traded funds to 3.5 trillion yen ($35.2 billion) by 2014. The Bank of Israel bought stocks for the first time last year while the Swiss National Bank and the Czech National Bank have boosted their holdings to at least 10 percent of reserves.

…The SNB allocated 82 percent of its 438 billion Swiss francs ($463 billion) in reserves to government bonds in the fourth quarter, according to data on its website. Of those securities, 78 percent had the top, AAA credit grade and 17 percent were rated AA.

…The survey of 60 central bankers, overseeing a combined $6.7 trillion, found that low bond returns had prompted almost half to take on more risk. Fourteen said they had already invested in equities or would do so within five years.

…Even so, 70 percent of the central bankers in the survey indicated that equities are “beyond the pale.”

the SNB has allocated about 12 percent of assets to passive funds tracking equity indexes. The Bank of Israel has spent about 3 percent of its $77 billion reserves on U.S. stocks.

…the BOJ announced plans to put more of its $1.2 trillion of reserves into exchange-traded funds this month as it doubled its stimulus program to help reflate the economy. The Bank of Korea began buying Chinese shares last year, increasing its equity investments to about $18.6 billion, or 5.7 percent of the total, up from 5.4 percent in 2011. China’s foreign-exchange regulator said in January it has sought “innovative use” of its $3.4 trillion in assets, the world’s biggest reserves, without specifying a strategy for investing in shares.

Reserves have increased at a slower pace since 2012, but the top 50 countries still accounted for $11.4trln, according to the latest CIA Factbook estimates. The real growth has been in emerging and developing countries – according to IMF data, since 2000, in the wake of the Asian crisis, their reserves grew from $700bln to above $8trln.

By June 2014 the Financial Times – Beware central banks’ share-buying sprees was sounding the alarm:-

An eye-catching report this week said that “a cluster of central banking investors has become major players on world equity markets”. An important driver was revenues foregone on bond portfolios.

Put together by the Official Monetary and Financial Institutions Forum, which brings together secretive and normally conservative central bankers, the report’s conclusions have authority. Some equity buying was in central banks’ capacity as, in effect, sovereign wealth fund managers. China’s State Administration of Foreign Exchange, which has $3.9tn under management, has become the world’s largest public sector holder of equities.

The boundary, however, with monetary policy making is not always clear. According to the Omfif report, China’s central bank itself “has been buying minority equity stakes in important European companies”.

…Central bank purchases of shares are not new. The Dutch central bank has invested in equities for decades. The benchmark for its €1.4bn portfolio is the MSCI global developed markets index.

The Italian, Swiss and Danish central banks also own equities. Across Europe, central banks face pressures from cash-strapped governments to boost income. As presumably cautious and wise investors, they have also been put in charge of managing sovereign wealth funds – Norway’s, for instance.

…the Hong Kong Monetary Authority launched a large-scale stock market intervention in 1998, splashing out about $15bn – and ended up making a profit. Since the Asian financial crisis of that year, official reserves have expanded massively – far beyond what might be needed in future financial crises or justified by trade flows.

The article goes on to state that CB transparency is needed and that it should be made clear whether the actions are monetary policy or investment activity. Equities are generally more volatile than bonds – losses could lead to political backlash, or worse still, undermine the prudent reputation of the CB itself.

Here is an example of just such an event, from July last year, as described by Zero Hedge – The Swiss National Bank Is Long $94 Billion In Stocks, Reports Record Loss Equal To 7% Of Swiss GDP:-

…17%, or CHF91 ($94 billion) of the foreign currency investments and CHF bond investments assets held on the SNB’s balance sheet are foreign stocks…

In other words, the SNB holds 15% of Switzerland’s GDP in equities!

Zero Hedge goes on to remonstrate against the lack of transparency of other CBs equity investment balances – in particular the Fed.

The ECB, perhaps due to its multitude of masters, appears reluctant to follow the lead of the SNB. In March 2015 it achieved some success by announcing that it would buy Belgian, French, Italian and Spanish bonds, under its QE plan, in addition to those of, higher rated, Finland, Germany, Luxembourg and the Netherlands. EZ Yield compression followed with Italy and Spain benefitting most.

The leading exponent of this “new monetary alchemy” is the BoJ. In an October 2015 report from Bloomberg – Owning Half of Japan’s ETF Market Might Not Be Enough for Kuroda the author states:-

With 3 trillion yen ($25 billion) a year in existing firepower, the BOJ has accumulated an ETF stash that accounted for 52 percent of the entire market at the end of September, figures from Tokyo’s stock exchange show.

…Japan’s central bank began buying ETFs in 2010 to spur more trading and promote “more risk-taking activity in the overall economy.” Governor Haruhiko Kuroda expanded the program in April 2013 and again last October.

BoJ ETF holdings - October 2015 - Bloomberg

Source: Bloomberg, TSE

More ETFs can be created to redress the balance, or the BoJ may embark on the purchase of individual stocks. They announced a small increase in ETF purchases in December, focused on physical and human capital firms – also advising that shares they bought from distressed financial institutions in 2002 will be sold (very gradually) at the rate of JPY 300bln per annum over the next decade. At the end of January the BoJ decided to adopt negative interest rate policy (NIRP) rather than expand ETF and bond purchases – this saw the Nikkei hit its lowest level since October 2014 whilst the JYP shed more than 8% against the US$. I anticipate that they will soon increase their purchases of ETFs or stocks once more. The NIRP decision was half-hearted and BoJ concerns, about corporates and individuals resorting to cash stashed in safes, may prove well founded – So it begins…Negative Interest rates Trickle Down in Japan – Mises.org discusses this matter in greater detail.

In early March the ECB acted with intent, CNBC – ECB pulls out all the stops, cuts rates and expands QE takes up the story:-

…the ECB announced on Thursday that it had cut its main refinancing rate to 0.0 percent and its deposit rate to minus-0.4 percent.

“While very low or even negative inflation rates are unavoidable over the next few months as a result of movement in oil prices, it is crucial to avoid second-round effects,” Draghi said in his regular media conference after the ECB statement.

The bank also extended its monthly asset purchases to 80 billion euros ($87 billion), to take effect in April.

…the ECB will add corporate bonds to the assets it can buy — specifically, investment grade euro-denominated bonds issued by non-bank corporations. These purchases will start towards end of the first half of 2016.

…the bank will launch a new series of four targeted longer-term refinancing operations (TLTROs) with maturities of four years, starting in June.

The Communique from the G20 meeting in Shanghai alluded to the need for increased international cooperation, but it appears that a sub-rosa agreement may have been reached to insure the Chinese did not devalue the RMB – in return for a cessation of monetary tightening by the Fed.

In an unusually transparent move, a report appeared on March 31st on Reuters – China forex regulator buys $4.2 bln in stocks via new platform:-

Buttonwood Investment Platform Ltd, 100 percent owned by the State Administration of Foreign Exchange (SAFE), and Buttonwood’s two fully-owned subsidiaries, have bought shares in a total of 13 listed companies, the newspaper reported, citing top 10 shareholder lists in the companies latest earnings reports.

Shanghai Securities News said the investments are part of SAFE’s strategy to diversify investment channels for the country’s massive foreign exchange reserves.

Recent earnings filings show Buttonwood is among the top 10 shareholders of Bank of China, Bank of Communications , Shanghai Pudong Development Bank , Everbright Securities and Industrial and Commercial Bank of China.

Conclusions and investment opportunities

The major CBs are beginning to embrace the idea of providing capital to corporates via bond or stock purchases. With next to no yield available from government bonds, corporate securities appear attractive, especially when one has the ability to expand ones balance sheet, seemingly, without limit.

The CBs are unlikely to buy when the market is strong but will provide liquidity in distressed markets. Once they have purchased securities the “free-float” will be almost permanently reduced. The lack of, what might be termed, “trading liquidity”, which has been evident in government bond markets, is likely to spill over into those corporate bonds and ETFs where the CBs hold a significant percentage. In the UK, under our takeover code, a 30% holding in a stock would obligate the holder to make an offer for the company – the 52% of outstanding ETFs held by the BoJ already seems excessive.

The ECB has plenty of government, agency and corporate bonds to purchase, before it moves on to provide permanent equity capital. The BoE and the Fed are subject to less deflationary forces; they will be the last guests to arrive at the “closet nationalisation” party. The party, nonetheless, is getting underway. Larger companies will benefit to a much greater extent than smaller listed or unlisted corporations because the CBs want to appear to be “indiscriminate” buyers of stock.

As the pool of available bonds and stocks starts to dry up, trading liquidity will decline – markets will become more erratic and volatile. Of greater concern in economic terms, malinvestment will increase; interest rates no longer provide signals about the value of projects.

For stocks, higher earning multiples are achievable due to the rising demand for equities from desperate investors with no viable “yield” alternative. CBs are unelected stewards on whom elected governments rely with increasing ease. For notionally independent CBs to purchase common stock is de facto nationalisation. The economic cost of an artificially inflated stock market is difficult to measure in conventional terms, but its promotion of wealth inequality through the sustaining of asset bubbles will do further damage to the fabric of society.

How do we square the decline in trade with the rebound in industrial commodities?

400dpiLogo

Macro Letter – No 51 – 11-3-2016

How do we square the decline in trade with the rebound in industrial commodities?

  • Global Manufacturing and Service PMI are in sharp decline
  • Chinese Iron Ore rallied 19% on Monday alone
  • Chinese GDP and trade data points to a continued decline
  • The EIA forecast US oil production to be 8.7mln bpd in 2016 vs 9.4mln last year

The price of Iron Ore, Aluminium and other industrial metals has rallied sharply over the last few weeks – WTI now seems to have followed suit. Most commentators regard this as a short covering rally. World trade continues to slow as the chart of Manufacturing and Services PMI below reveals:-

JP Morgan - services-vs-manufacturing-pmi

Source: Bloomberg, JP Morgan

Chinese February trade data adds to the picture of a slowdown. Exports declined 25.4% YoY, while imports fell 13.8%. Analysts had forecast a 12.5% drop exports, and 10.0% in imports. The trade surplus fell to $32.59bln – against expectations of $50.15bln. This exceptionally sharp decline may be the result of the date of the Chinese New Year but the trend is disquieting.

At last weekends National People’s Congress the 2016 GDP growth forecast was revised downwards to 6.5 – 7%. This followed the release of Q4 2015 GDP at 6.8% and the PBoC’s decision to cut the reserve requirement ratio by 0.5% in order to insure ample liquidity – for large banks the ratio is now 17%.

These charts from the Wall Street Journal put things in a global perspective:-

World_Trade_and_GDP_-_WSJ_World_Bank

Source: WSJ, WTO

Further evidence comes from this week’s Monday briefing from Deloitte – Carry on Consuming:-

Manufacturing activity is shrinking in the US and China, the world’s two largest economies. Output is still rising in the euro area, but at the slowest pace in a year. Britain’s manufacturing sector is back in recession.

Part of the problem is lacklustre global demand for manufactured products, particularly in emerging market economies. This has contributed to a slowdown in trade, one of the pre-crisis drivers of global growth. The value of global goods exports last year fell by 13.8% in dollar terms, the first contraction since 2009.

…And yet for me the big conclusion from last week’s meeting in Beijing was that, despite the storm clouds, the world economy should keep growing this year. None of my colleagues, in the US, China, India, Europe, Japan or Australia, anticipate a sharp slowdown in GDP growth in their region this year. All expect consumer spending, the dominant element in GDP everywhere, to hold up.

The performance of many emerging markets has been particularly dire of late, as so many, in order to balance government budgets and meet debt servicing obligations, are reliant on a high price for their commodities.

In an LSE Lecture, given at the beginning of February, Jaime Caruana – General Manager of the BIS – Credit, commodities and currencies – made a number of observations about commodity prices, emerging market debt and the rise of the US$:-

The global economy now finds itself at the centre of three major economic developments. The first is disappointing growth and downward revisions of projections, especially in emerging economies; the second is the large shifts in exchange rates, again especially for emerging market currencies against the US dollar; and the third is the sharp fall in commodity prices, hitting a number of commodity-exporting countries particularly hard, but at the same time providing a positive dividend to other economies.

…Total debt in the global economy, including public debt, has increased significantly since the crisis (end of 2007). True, private debt has been reduced in some countries, namely Ireland, Spain, the United Kingdom, the United States and others. However, public debt has increased significantly in advanced economies, and private debt has increased in emerging economies and some advanced economies less affected by the 2008 financial crisis.

BIS-EM-vs-DM-private-debt-to-GDP

Source: BIS, IMF, World Bank

…Increased leverage would be less of a concern if debt is used to finance productive and profitable investments. However, the profitability of EME non-financial companies has fallen. Traditionally, EME firms have been more profitable than their advanced economy peers, but this is no longer the case…

BIS-EM-corp-leverage-and-ROE

Source: BIS, Datastream, S&P, Capital IQ

…Based on the most recent reading for the third quarter of 2015, global liquidity conditions may have begun to tighten for emerging economies. A key yardstick is the US dollar-denominated debt of non-bank borrowers outside the United States. It stood at $9.8 trillion in September 2015, unchanged from the previous reading in June, and the dollar borrowing by non-banks in the emerging economies stood at $3.3 trillion, again unchanged from June (Graph 3). This is the first time since 2009 that the latter has stopped increasing.

BIS - US Debt outside US

Source: BIS

One important aspect of this additional borrowing in dollars is the strong association between the strength of the dollar and dollar-denominated borrowing by EME borrowers.

…As a rule of thumb, a 1% depreciation of the US dollar is associated with a 0.6 percentage point increase in the quarterly growth rate of US dollar-denominated cross-border lending outside the United States.

…Unlike in previous EME crises in the 1980s and 1990s that had the attributes of a sharp “sudden stop” in lending to EME sovereigns or a run on the banking system, the borrowing in dollars in recent years has been undertaken by private sector non-bank borrowers – mainly non-financial firms. Even if a firm operates in a country whose central bank holds large foreign exchange reserves, there is the question of how the dollars are transferred from the central bank to the firm itself. Unless there is some mechanism that transfers resources from the foreign exchange reserves to the firms themselves, the firms with dollar debts will need to curtail operations and reduce leverage, leading to a direct hit on overall economic growth.

Commodity Rebound

Mr Caruana’s concerns seem at odds with the sudden upturn in a number of industrial commodities, commodity related equities and resource-centric currencies. The rebound started with Aluminium and spread to Copper:-

LME_Aluminum_5yr_-_Kitco (1)

Source: Kitco

LME_Copper_5yr_-_Kitco

Source: Kitco

Collapsing warehouse stocks tell a part of the story:-

LME_Aluminium_stocks-5yr_-_Kitco

Source: Kitco

LME_Copper_stocks_5yr_-_Kitco

Source: Kitco

The move has been even more pronounced in Zinc:-

LME_Zinc_5yr_-_Kitco (2)

Source: Kitco

A similar pattern has begun to occur in Iron Ore, which bottomed at the end of December; I regret, the five year Swap Futures chart below doesn’t capture the dramatic rise from $52 to $62 seen in the spot price on Monday:-

China 62 percent Iron Ore Swap 5yr - Barchart

Source: Barchart.com

This move occurred in the face of data from the World Steel Association – January 2016 crude steel production showing a 7.1% decline globally.

Energy prices have remained subdued, with crude oil making fresh lows in February, but even here the sentiment may have changed:-

WTI 5yr - Barchart

Source: Barchart.com

Although Coal and Natural Gas have yet to catch a significant bid:-

Coal 5yr - Trading Economics, ICE

Source: Trading Economics, ICE

Nat Gas 5yr - Barchart

Source: Barchart.com


A nascent rally is also evident amongst the precious metals complex, here are Palladium and Platinum for good measure:-

Paladium 5yr - Barchart

Source: Barchart.com

Platinum 5yr - Barchart

Source: Barchart.com

As to whether the real economy is beginning to recover I would not put too much weight on the recent rebound in the Baltic Dry Index, it tends to be, at best, lagging indicator:-

BDI 5yr - Stockcharts

Source: Stockcharts.com

The inelastic nature of prices in many commodity markets and the shipping sector in particular, make it extremely dangerous to imply that a small “flight of swallows makes a summer”.

Conclusion and investment opportunities

Whilst have I written about specific aspects of commodity markets, it has been some while since I last focused on commodities in a general sense. In February of last year I wrote – Where is the oil price heading in 2015? In which I looked at the oil futures contango – despite a decline of almost a third in the spot price of WTI (from $45 to $30 per bbl) the contango has not increased as shown by a comparison of the one year futures spreads (March 15-16 vs March 16-17):-

WTI March 16-17 vs March 15-16 CME

Source: CME, SpreadCharts.com

Producer pain also shows up in US energy production data. Crude oil rig count peaked at 1,609 rigs in October 2014 reaching a low of 439 in February. The Kansas City Federal Reserve – The Reallocation of Energy-Sector Workers after Oil Price Booms and Busts is a timely research response to the 140,000 mining jobs lost during 2015.

Oil production peaked at 9.6mln bpd in April 2015 and is estimated to be down by more than 400,000 bpd. The EIA – Short-Term Energy Outlook forecasts production will decrease to 8.7mln bpd in 2016 and to 8.2mln bpd in 2017.

In December 2014 in How the collapse in energy prices will affect US Growth and Inflation and what that means for stocks I wrote: –

The decline in the oil price, if it holds, should have a long-term benign effect on US growth and inflation. In the shorter term, however, the rebalancing of the economy away from the energy sector may take its toll, not just on the energy sector, but also on financial services – both the banks, which have lent the energy companies money, and the investors, who have purchased energy related debt. This will breed contagion with other speculative investment markets – lower quality bonds, small cap growth stocks and leveraged derivative investments of many colours.

Looking even farther back to my second Macro Letter in December 2013 – Commodity super-cycles in a fiat currency world I concluded:-

Looking ahead to 2014 I can see little reason, thus far, to be broadly long commodities – as mentioned at the beginning I encourage all investors to view each market on its own particular merits. However, just like 2013, I am waiting for bearish sentiment to turn. To misquote St Augustine’s teenage prayer “Give me commodities Lord, but not yet!”

With anaemic growth and slowing global trade, I believe the current rebound in commodity prices will be relatively short-lived. Chart patterns suggest room for further upside in the next couple of months, possibly aided by seasonal factors, but, with a mounting burden of debt hanging over the global economy – especially those parts which are expected to deliver stronger structural growth – I do not anticipate the beginning of the next commodity upturn for a while.

Will Nigeria be forced to devalue the naira?

Will Nigeria be forced to devalue the naira?

400dpiLogo

Macro Letter – No 50 – 26-02-2016

Will Nigeria be forced to devalue the naira?

  • The Nigerian government met the World Bank to discuss its deficit – loan pending
  • The Bank of Nigeria cut rates in November – bond prices suggest further cuts are imminent
  • Foreign Exchange controls tightened further in December
  • President Buhari states he won’t “kill the naira”

I last wrote about Nigeria back in early June – Nigeria and South Africa – what are their prospects for growth and investment? My favoured investment was long Nigerian bonds – then trading around 13.7%. They rose above 16% as naira exchange controls tightened. Here is a chart showing what happened next:-

nigeria-government-bond-yield

Source: Trading Economics, Central Bank of Nigeria

The catalyst for lower yields was an unexpected interest rate cut by the Central Bank of Nigeria. This is how it was reported by Reuters back on 25th November:-

Nigeria’s central bank cut benchmark interest rate to 11 percent from 13 percent on Tuesday, its first reduction in the cost of borrowing in more than six years.

…The stock market, which has the second-biggest weighting after Kuwait on the MSCI frontier market index , erased seven days of losses to climb to 27,662 points following the rate cut. The index has fallen 20.4 percent so far this year.

“On the back of the reduction in policy rates … investors are reconsidering investment in the equities market to earn higher return,” said Ayodeji Ebo, head of research at Afrinvest. “We anticipate further moderation in bond yields.”

He expected stocks in the industrial sector such as Dangote Cement and Lafarge Africa to gain from the liquidity surge as infrastructure projects boom. Ebo said the rate cut may hurt bank earnings as consumer firms reel from dollar shortages.

Yield on the most liquid 5-year bond fell 264 basis points to a five-year low of 7 percent while the benchmark 20-year bond closed 150 basis points down at 10.8 percent on Wednesday, traders said.

Bond yields had traded above 11 percent across maturities prior to Tuesday’s rate decision, with the 2034 bond trading at 12.30 percent.

The central bank has been injecting cash into the banking system since October in a bid to help the economy. Banking system credit stood at 290 billion naira ($1.5 bln) as of Wednesday, keeping overnight rates as low as 0.5 percent .

…The rate cut also weakened the naira on the unofficial market, which fell 0.8 percent to 242 to the dollar. The currency is pegged at 197 naira on the official market.

Non-deliverable currency forwards, a derivative product used to hedge against future exchange rate moves, indicated markets expected the naira’s exchange rate at 235.56 to the dollar in 12 months’ time – the strongest level in five months – and compared to 245.25 at Tuesday’s close

“Our economists still believe a devaluation will happen in a couple of quarters but I think they have had opportunities,” said Luis Costa, head of CEEMEA debt and FX strategy at Citi.

Here is a chart showing the naira spot and three month forward rate – a good surrogate for the differential between the official and black market rate:-

Naira spot vs forwards

Source: Bloomberg

December saw a further tightening of exchange controls, the FT – Capital controls curtail spending of Nigeria’s jet set elaborates:-

Nigeria’s central bank introduced currency controls last spring as the naira came under pressure after the collapse in the price of oil, the country’s main export and the lifeblood of its economy.

As well as in effect banning imports of goods from rice to steel pipes to protect dwindling foreign exchange reserves, the central bank has also enforced spending limits on foreign currency-denominated Nigerian bank cards, much to the chagrin of Nigeria’s well-heeled travellers. These are needed, it says, to curb black market activity such as “arbitraging”: when a customer turns a quick profit by withdrawing foreign exchange from an overseas ATM to sell on the black market back home.

Another less publicised aim of the controls, according to one senior official, is to limit the flight of billions of dollars suspected to have been fraudulently obtained and then hoarded in cash by business people and officials under the former government of Goodluck Jonathan.

Last month, the central bank extended the policy by banning the use of naira-denominated debit cards altogether for overseas transactions or withdrawals. The central bank has said it will not lift the restrictions until foreign reserves, which have fallen to $29bn from $34.5bn a year ago, are restored.

There is speculation among economists about the true level of foreign exchange reserves – suffice to say $29bln is regarded as an overestimate.

The January Central Bank of Nigeria Communiqué looked back to the rate cut in November but left rates unchanged, here are some of the highlights:-

Output

…Domestic output growth in 2015 remained moderate. According to the National Bureau of Statistics (NBS), real GDP grew by 2.84 per cent in the third quarter of 2015, almost half a percentage point higher than the 2.35 per cent recorded in the second quarter. However, third quarter expansion remained substantially below the 3.96 and 6.23 per cent in the first quarter of 2015 and corresponding period of 2014, respectively. The major impetus to growth continued to come from the non-oil sector which grew by 3.05 per cent compared with the growth of 3.46 per cent posted in the preceding quarter. The major drivers of expansion in the non-oil sector were Services, Agriculture and Trade.

…The economy is expected to continue on its growth path in the first quarter 2016, albeit less robust than in the corresponding period of 2015. This expectation is predicated on the current low global oil price trend which is projected to hold low over the medium-to long term, and with attendant implications for government revenue and foreign exchange earnings. Other downside risks to growth in 2016 include: capital flow reversal, high lending rates, sluggish credit to private sector and bearish trends in the equities market.

Prices

…Core inflation declined for the third consecutive month to 8.70 per cent in November and December from 8.74 per cent in October 2015, while food inflation inched up to 10.32 per cent from 10.13 and 10.2 per cent over the same period.

Monetary, Credit and Financial Markets Developments

Broad money supply (M2) rose by 5.90 per cent in December 2015, over the level at end-December 2014, although below the growth benchmark of 15.24 per cent for 2015. Net domestic credit (NDC) grew by 12.13 per cent in the same period, but remained below the provisional benchmark of 29.30 per cent for 2015. Growth in aggregate credit reflected mainly growth in credit to the Federal Government by 151.56 per cent in December 2015 compared with 145.74 per cent in the corresponding period of 2014. The renewed increase in credit to government may be partly attributable to increased government borrowing to implement the 2015 supplementary budget.

Committee’s Considerations

The Committee observed that the last episode of low oil prices in 2005 lasted for a maximum period of 8 months. However, the current episode of lower oil prices is projected to remain over a very long period.

At the end of January, President Buhari stated that he would not “kill the naira” – this prompted some commentators to question the independence of the central bank. It also suggests that foreign exchange controls will remain in place, despite pressure from the IMF for their removal.

Conclusion and Investment Opportunities

Whilst foreign exchange controls remain in place it is difficult to access the Nigerian markets: stubbornly high inflation remains a concern which these controls will only exacerbate – see chart below:-

nigeria-inflation-cpi

Source: Trading Economics, Nigerian Statistics Bureau

In this, high inflation, environment, it is difficult to envisage much further upside for government bonds. If you have been long I would take profit before the currency comes under renewed pressure. On 21st January Nigeria’s finance minister Kemi Adeosun announced that the government would borrow $5bln from international agencies to plug the shortfall in tax receipts, she has since then been in talks with the AfDB and the World Bank – after all, oil represents 95% of exports and more than two thirds of government revenue.

Stocks have fallen by more than 45% since their July 2014 highs, but further devaluation looks likely. The non-oil sector will outperform in the current environment but should the central bank “throw in the towel” it will be the energy sector which benefits in the short-term. According to Knoema, Nigerian oil production offshore is around $30/bbl whilst the smaller on-shore production is nearer $15/bbl. Other estimates suggest that only 16% of Nigerian oil reserves are worth exploiting at prices below $40/bbl. A 20% to 40% decline in the naira will reduce the break-even immediately. I remain side-lined until the valuation of the naira has been resolved.

As for the naira – a prolonged period of low oil prices will see the three month forward rate return towards NGNUSD 250 – a break towards 280 could represent a capitulation point. I believe this offers value, being 40% above the official rate. Will it happen? Yes, I think so.

Why did Japanese NIRP cause such surprise in the currency market and is it more dangerous?

400dpiLogo

Macro Letter – No 49 – 12-02-2016

Why did Japanese NIRP cause such surprise in the currency market and is it more dangerous?

  • The Bank of Japan announcement of NIRP sent shock waves through currency markets
  • The Yen has strengthened on capital repatriation since the BoJ move
  • JGB 10 year yields turned negative this week
  • Longer-term the Yen will weaken

At the end of January the Bank of Japan (BoJ) shocked the financial markets by announcing that they would allow Japanese interest rates to become negative for the first time. USDJYP reacted with an abrupt rise from 118 to 121 which was completely reversed a global stock markets declined USDJYP is currently at 112.06 (11-02-2016). The three year chart below shows the extent of the move:-

USDJPY_-_3yr

Source: Big Charts

Here is an extract from the BOJ Announcement:-

The Introduction of “Quantitative and Qualitative Monetary Easing (QQE) with a Negative Interest Rate” 

The Bank will apply a negative interest rate of minus 0.1 percent to current accounts that financial institutions hold at the Bank. It will cut the interest rate further into negative territory if judged as necessary.

The Bank will introduce a multiple-tier system which some central banks in Europe (e.g. the Swiss National Bank) have put in place. Specifically, it will adopt a three-tier system in which the outstanding balance of each financial institution’s current account at the Bank will be divided into three tiers, to each of which a positive interest rate, a zero interest rate, or a negative interest rate will be applied, respectively.

“QQE with a Negative Interest Rate” is designed to enable the Bank to pursue additional monetary easing in terms of three dimensions, combining a negative interest rate with quantity and quality.

The Bank will lower the short end of the yield curve and will exert further downward pressure on interest rates across the entire yield curve through a combination of a negative interest rate and large-scale purchases of JGBs.

The Bank will achieve the price stability target of 2 percent at the earliest possible time by making full use of possible measures in terms of the three dimensions.

In answer to the title question, part of the surprise was due to BoJ Governor Kuroda-san’s volte face. Prior to his departure for Davos, he had ruled out the adoption of negative interest rate policy (NIRP) upon his return the BoJ announced the NIRP “out of the blue”.

I was also surprised, not that the BoJ had adopted NIRP, but that it had taken so long for them to “fall on their sword”. After all, they have been struggling with deflation and low bond yields for more than a decade and embarked on QQE ahead of their collaborators at the ECB, SNB, Riksbank and Danmarks Bank. The Economist – Negative Creep – makes some important observations:-

Almost a quarter of the world’s GDP now comes from countries with negative rates.

Not so long ago it was widely thought that, if interest rates went below zero, banks and their depositors would simply switch to cash, which pays no interest but doesn’t charge any either. Yet deposits in Europe, where rates have been negative for well over a year, have been stable. For commercial banks, a small interest charge on electronic deposits has proved to be bearable compared with the costs of safely storing stacks of cash—and not yet onerous enough to try to pass on to individual depositors.

That has resulted in an unavoidable squeeze on profits of banks, particularly in the euro area, where an interest rate of -0.3% applies to almost all commercial-bank reserves. (As in Switzerland and Denmark, Japan’s central bank has shielded banks from the full effect by setting up a system of tiered interest rates, in which the negative rate applies only to new reserves.) If interest rates go deeper into negative territory, profit margins will be squeezed harder—even in places where central banks have tried to protect banks. And if banks are not profitable, they are less able to add to the capital buffers that let them operate safely.

Perhaps the answer lies in the transient influence NIRP had on the value of the JPY. The Yen had risen quite sharply amid repatriation of risk assets during the first weeks of January, the BoJ announcement stemmed the tide briefly, until the flood resumed. The move beyond Qualitative easing – which provides “permanent” capital but does not make its presence felt to the same extent – should have caused the Yen to recommence its secular decline. With the liquidation of asset flows dominating the foreign exchanges the BoJ’s action was like a straw in the wind. Negative rates may be instantly recognizable whilst the purchase of common stock is masked by the daily ebb and flow of the stock market, but when investors are exiting “pursued by Bear” central bankers need to act with greater resolution – in time I expect the BoJ will adopt a more negative stance.

In the longer run NIRP will reduce the attractiveness of the Yen, which brings me to a second question – is NIRP is more or less damaging, to the economy, than the QQE which has gone before? I am assuming here, that QQE, like all the forms of quantitative easing to emanate from the coffers of the major central banks, is inherently damaging to the economy because these policies artificially lower the rate of interest, leading to malinvestment. This destroys long run demand by reducing the return on savings – especially important in a country where the population is rapidly aging. More pensioners with less income from their savings, more workers with inadequate pension provisions due to low interest rates and more defined benefit pension funds at risk of default due to insufficient funding of their liabilities. An added twist to this sorry situation is the propensity for unprofitable businesses to continue to operate, inexorably dragging down productivity. These are just a few of the unintended consequences of engineering interest rates below their natural level.

Investment Opportunities

In the past I have been bullish for the Nikkei on a currency hedged basis. The five year chart below shows the relative performance versus the Eurostoxx 50 over the last five years:-

Nikkei 225 vs Eurostoxx 50 - 5yr

Source: Yahoo Finance

Long Nikkei 225 hedged may still prove a positive strategy, although the up-trend appears to have failed in the near term, but I believe, in the long run, under the BoJ – “QQE with NIRP” regime, the best trade will be to short the Yen. Again, the near term the trend is unfavourable – repatriating capital flows may be the driving force – when the capital flows subside, the “Emperor” will be seen to have “less than zero” clothes. The Yen should run into resistance around 110 and again at 105 – keep your powder dry.

10yr JGBs yields nudged into negative territory this week, whilst the 40yr maturity has backed up from 1.12% to 1.23% over the past seven sessions. That may not seem much of a return, but longer dated maturities are likely to offer increasingly attractive carry potential as market participants attempt to establish the “limit of NIRP”. JGB futures offer a reasonably clean way of participating in any upside whilst hedging the majority of your currency exposure in either direction. You may be late to the trade, however, as the eight year, monthly yield chart below reveals:-

japan-government-bond-yield 2008-2016 Monthly

Source: Trading Economics

Central Banks – Ah Aaaaahhh! – Saviours of the Universe?

400dpiLogo

Macro Letter – No 48 – 29-01-2016

Central Banks – Ah Aaaaahhh! – Saviours of the Universe?

Flash-Gordon-flash-gordon-23432257-1014-1600

Copryright: Universal Pictures

  • Freight rates have fallen below 2008 levels
  • With the oil price below $30 many US producers are unprofitable
  • The Fed has tightened but global QE gathers pace
  • Chinese stimulus is fighting domestic strong headwinds

Just in case you’re not familiar with it here is a You Tube video of the famous Queen song. It is seven years since the Great Financial Crisis; major stock markets are still relatively close to their highs and major government bond yields remain near historic lows. If another crisis is about to engulf the developed world, do the central banks (CBs) have the means to avert catastrophe once again? Here are some of the factors which may help us to reach a conclusion.

Freight Rates

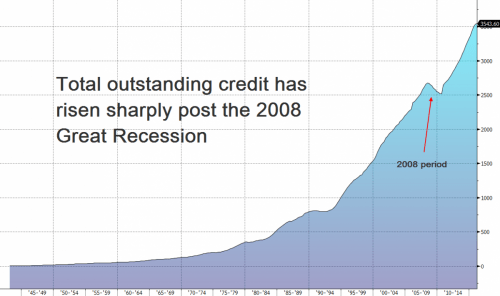
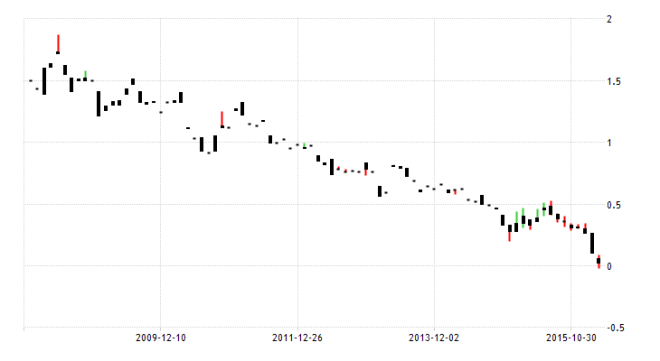
Last week I was asked to comment of the prospects for commodity prices, especially energy. Setting aside the geo-politics of oil production, I looked at the Baltic Dry Index (BDI) which has been plumbing fresh depths this year – 337 (28/1/16) down from August 2015 highs of 1200. Back in May 2008 it touched 11,440 – only to plummet to 715 by November of the same year. How helpful is the BDI at predicting the direction of the economy? Not very – as this 2009 article from Business Insider – Shipping Rates Are Lousy For Predicting The Economy – points out. Nonetheless, the weakness in freight rates is indicative of an inherent lack of demand for goods. The chart below is from an article published by Zero Hedge at the beginning of January – they quote research from Deutsche Bank.

BDI_-_1985_-_2016 (4)

Source: Zerohedge

A “Perfect Storm Is Coming” Deutsche Warns As Baltic Dry Falls To New Record Low:

…a “perfect storm” is brewing in the dry bulk industry, as year-end improvements in rates failed to materialize, which indicates a looming surge in bankruptcies.

The improvement in dry bulk rates we expected into year-end has not materialized.

…we believe a number of dry bulk companies are contemplating asset sales to raise liquidity, lower daily cash burn, and reduce capital commitments. The glut of “for sale” tonnage has negative implications for asset and equity values. More critically, it can easily lead to breaches in loan-to-value covenants at many dry bulk companies, shortening the cash runway and likely necessitating additional dilutive actions.

Dry bulk companies generally have enough cash for the next 1yr or so, but most are not well positioned for another leg down in asset values.

China

The slowing and rebalancing of the Chinese economy may be having a significant impact on global trade flows. Here is a recent article on the subject from Mauldin Economics – China’s Year of the Monkees:-

China isn’t the only reason markets got off to a terrible start this month, but it is definitely a big factor (at least psychologically). Between impractical circuit breakers, weaker economic data, stronger capital controls, and renewed currency confusion, China has investors everywhere scratching their heads.

When we focused on China back in August (see “When China Stopped Acting Chinese”), my best sources said the Chinese economy was on a much better footing than its stock market, which was in utter chaos. While the manufacturing sector was clearly in a slump, the services sector was pulling more than its fair share of the GDP load. Those same sources have new data now, which leads them to quite different conclusions.

…Now, it may well be the case that China’s economy is faltering, but its GDP data is not the best evidence.

…To whom can we turn for reliable data? My go-to source is Leland Miller and company at the China Beige Book.

…China Beige Book started collecting data in 2010. For the entire time since then, the Chinese economy has been in what Leland calls “stable deceleration.” Slowing down, but in an orderly way that has generally avoided anything resembling crisis. 

…China Beige Book noticed in mid-2014 that Chinese businesses had changed their behavior. Instead of responding to slower growth by doubling down and building more capacity, they did the rational thing (at least from a Western point of view): they curbed capital investment and hoarded cash. With Beijing still injecting cash that businesses refused to spend, the liquidity that flowed into Chinese stocks produced the massive rally that peaked in mid-2015. It also allowed money to begin to flow offshore in larger amounts. I mean really massively larger amounts.

Dealing with a Different China

China Beige Book’s fourth-quarter report revealed a rude interruption to the positive “stable deceleration” trend. Their observers in cities all over that vast country reported weakness in every sector of the economy. Capital expenditures dropped sharply; there were signs of price deflation and labor market weakness; and both manufacturing and service activity slowed markedly.

That last point deserves some comment. China experts everywhere tell us the country is transitioning from manufacturing for export to supplying consumer-driven services. So if both manufacturing and service activity are slowing, is that transition still happening?

The answer might be “yes” if manufacturing were decelerating faster than services. For this purpose, relative growth is what counts. Unfortunately, manufacturing is slowing while service activity is not picking up all the slack. That’s not the combination we want to see.

Something else China Beige Book noticed last quarter: both business and consumer loan volume did not grow in response to lower interest rates. That’s an important change, and probably not a good one. It means monetary stimulus from Beijing can’t save the day this time. Leland thinks fiscal stimulus isn’t likely to help, either. Like other governments and their central banks, China is running out of economic ammunition.

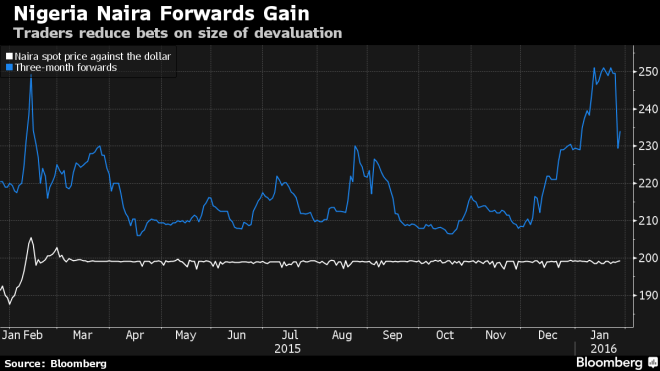
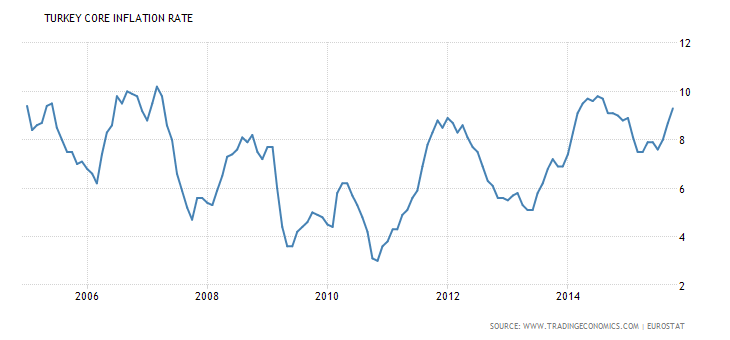
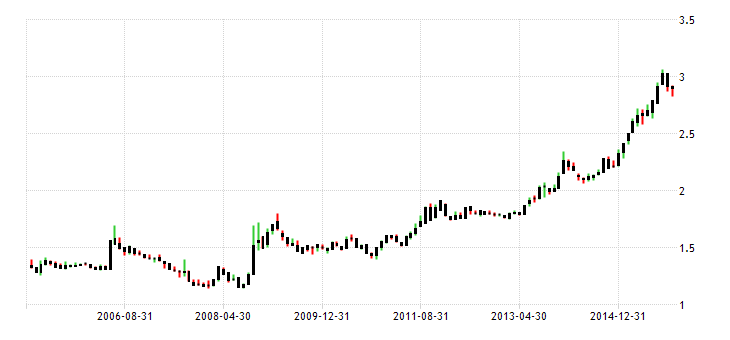
Mauldin goes on to discuss the devaluation of the RMB – which I also discussed in my last letter – Is the ascension of the RMB to the SDR basket more than merely symbolic? The RMB has been closely pegged to the US$ since 1978 though with more latitude since 2005, this has meant a steady appreciation in its currency relative to many of its emerging market trading partners. Now, as China begins to move towards full convertibility, the RMB will begin to float more freely. Here is a five year chart of the Indian Rupee and the CNY vs the US$:-

INR vs RMB - Yahoo

Source: Yahoo finance

The Chinese currency could sink significantly should their government deem it necessary, however, expectations of a collapse of growth in China may be premature as this article from the Peterson Institute – The Price of Oil, China, and Stock Market Herding – indicates:-

A collapse of growth in China would indeed be a world changing event. But there is just no evidence of such a collapse. At most there is suggestive evidence of a mild slowdown, and even that is far from certain. The mechanical effects of such a mild decrease on the US economy should, by all accounts, and all the models we have, be limited. Trade channels are limited (US exports to China represent less than 2 percent of GDP), and so are financial linkages. The main effect of a slowdown in China would be through lower commodity prices, which should help rather than hurt the United States.

Peterson go on to suggest:-

Maybe we should not believe the market commentaries. Maybe it was neither oil nor China. Maybe what we are seeing is a delayed reaction to the slowdown in the world economy, a slowdown that has now gone on for a few years. While there has been no significant news in the last two weeks, maybe markets are only realizing that growth in emerging markets will be lower for a long time, that growth in advanced economies will be unexciting. Maybe…

I think the explanation is largely elsewhere. I believe that to a large extent, herding is at play. If other investors sell, it must be because they know something you do not know. Thus, you should sell, and you do, and so down go stock prices. Why now? Perhaps because we have entered a period of higher uncertainty. The world economy, at the start of 2016, is a genuinely confusing place. Political uncertainty at home and geopolitical uncertainty abroad are both high. The Fed has entered a new regime. The ability of the Chinese government to control its economy is in question. In that environment, in the stock market just as in the presidential election campaign, it is easier for the bears to win the argument, for stock markets to fall, and, on the political front, for fearmongers to gain popularity.

They are honest enough to admit that economics won’t provide the answers.

Energy Prices

The June 2015 BP – Statistical Review of World Energy – made the following comments:-

Global primary energy consumption increased by just 0.9% in 2014, a marked deceleration over 2013 (+2.0%) and well below the 10-year average of 2.1%. Growth in 2014 slowed for every fuel other than nuclear power, which was also the only fuel to grow at an above-average rate. Growth was significantly below the 10-year average for Asia Pacific, Europe & Eurasia, and South & Central America. Oil remained the world’s leading fuel, with 32.6% of global energy consumption, but lost market share for the fifteenth consecutive year.

Although emerging economies continued to dominate the growth in global energy consumption, growth in these countries (+2.4%) was well below its 10-year average of 4.2%. China (+2.6%) and India (+7.1%) recorded the largest national increments to global energy consumption. OECD consumption fell by 0.9%, which was a larger fall than the recent historical average. A second consecutive year of robust US growth (+1.2%) was more than offset by declines in energy consumption in the EU (-3.9%) and Japan (-3.0%). The fall in EU energy consumption was the second-largest percentage decline on record (exceeded only in the aftermath of the financial crisis in 2009).

The FT – The world energy outlook in five charts – looked at five charts from the IEA World Energy Outlook – November 2015:-

Demand_Growth_in_Asia

Source: IEA

With 315m of its population expected to live in urban areas by 2040, and its manufacturing base expanding, India is forecast to account for quarter of global energy demand growth by 2040, up from about 6 per cent currently.

India_moving_to_centre

Source: IEA

Oil demand in India is expected to increase by more than in any other country to about 10m barrels per day (bpd). The country is also forecast to become the world’s largest coal importer in five years. But India is also expected to rely on solar and wind power to have a 40 per cent share of non-fossil fuel capacity by 2030.

A_new_chapter_in_Chinas_growth_story

Source: IEA

China’s total energy demand is set to nearly double that of the US by 2040. But a structural shift in the Asian country away from investment-led growth to domestic-demand based economy will “mean that 85 per cent less energy is required to generate each unit of future economic growth than was the case in the past 25 years.”
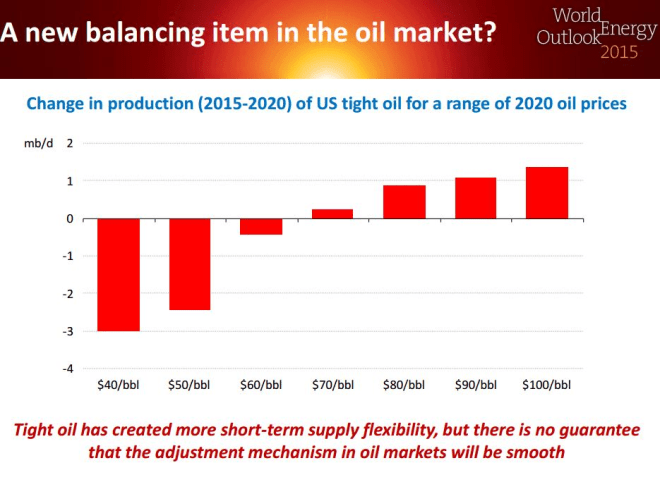
A_new_balancing_item_in_the_oil_market

Source: IEA

US shale oil production is expected to “stumble” in the short term, but rise as oil price recovers. However the IEA does not expect crude oil to reach $80 a barrel until 2020, under its “central scenario”. The chart shows that if prices out to 2020 remain under $60 per barrel, production will decline sharply.
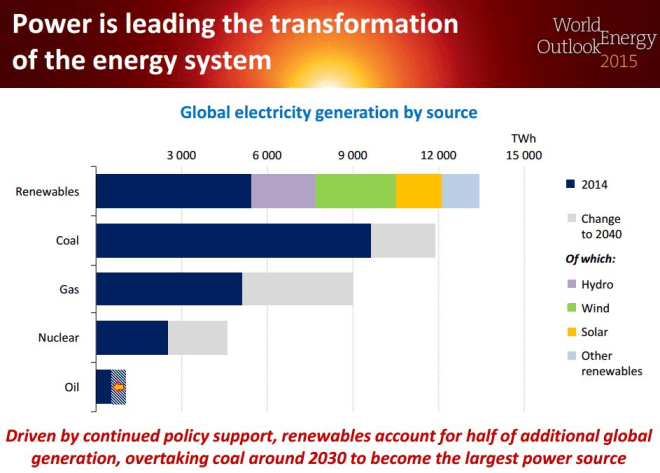
Power_is_leading_the_transformation

Source: IEA

Renewables are set to overtake coal to become the largest source of power by 2030. The share of coal in the production of electricity will fall from 41 per cent to 30 per cent by 2040, while renewables will account for more than half the increase in electricity generation by then.

The cost of solar energy continues to fall and is now set to “eclipse” natural gas, as this article from Seeking Alpha by Siddharth Dalal – Falling Solar Costs: End Of Natural Gas Is Near? Explains:-

A gas turbine power plant uses 11,371 Btu/kWh. The current price utilities are paying per Btu of natural gas are $3.23/1000 cubic feet. 1000 cubic feet of natural gas have 1,020,000 BTUs. So $3.23 for 90kWh. That translates to 3.59c/kWh in fuel costs alone.

A combined cycle power plant uses 7667 Btu/kWh, which translates to 2.42c/kWh.

Adding in operating and maintenance costs, we get 4.11c/kWh for gas turbines and 3.3c/kWh for combined cycle power plants. This still doesn’t include any construction costs.

…The average solar PPA is likely to go under 4c/kWh next year. Note that this is the total cost that the utility pays and includes all costs.

And the trend puts total solar PPA costs under gas turbine fuel costs and competitive with combined cycle plant total operating costs next year.

At this point it becomes a no brainer for a utility to buy cheap solar PPAs compared to building their own gas power plants.

The only problem here is that gas plants are dispatchable, while solar is not. This is a problem that is easily solved by batteries. So utilities would be better served by spending capex on batteries as opposed to any kind of gas plant, especially anything for peak generation.

The influence of the oil price, whilst diminishing, still dominates. In the near term the importance of the oil price on financial market prices will relate to the breakeven cost of production for companies involved in oil exploration. Oil companies have shelved more than $400bln of planned investment since 2014. The FT – US junk-rated energy debt hits two-decade lowtakes up the story:-

US-High Yield - Thompson Reuters

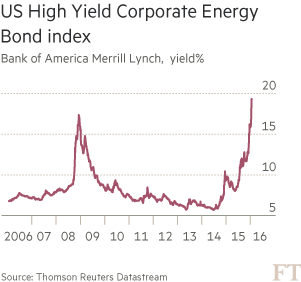
Source: Thomson Reuters Datastream, FT

The average high-yield energy bond has slid to just 56 cents on the dollar, below levels touched during the financial crisis in 2008-09, as investors brace for a wave of bankruptcies.

…The US shale revolution which sent the country’s oil production soaring from 2009 to 2015 was led by small and midsized companies that typically borrowed to finance their growth. They sold $241bn worth of bonds during 2007-15 and many are now struggling under the debts they took on.

Very few US shale oil developments can be profitable with crude at about $30 a barrel, industry executives and advisers say. Production costs in shale have fallen as much as 40 per cent, but that has not been enough to keep pace with the decline in oil prices.

…On Friday, Moody’s placed 120 oil and gas companies on review for downgrade, including 69 in the US.

…The yield on the Bank of America Merrill Lynch US energy high-yield index has climbed to the highest level since the index was created, rising to 19.3 per cent last week, surpassing the 17 per cent peak hit in late 2008.

More than half of junk-rated energy groups in the US have fallen into distress territory, where bond yields rise more than 1,000 basis points above their benchmark Treasury counterpart, according to S&P.

All other things equal, the price of oil is unlikely to rally much from these levels, but, outside the US, geo-political risks exist which may create an upward bias. Many Middle Eastern countries have made assumptions about the oil price in their estimates of tax receipts. Saudi Arabia has responded to lower revenues by radical cuts in public spending and privatisations – including a proposed IPO for Saudi Aramco. As The Guardian – Saudi Aramco privatisation plans shock oil sector – explains, it will certainly be difficult to value – market capitalisation estimates range from $1trln to $10trln.

Outright energy company bankruptcies are likely to be relatively subdued, unless interest rates rise dramatically – these companies locked in extremely attractive borrowing rates and their bankers will prefer to renegotiate payment schedules rather than write off the loans completely. New issuance, however, will be a rare phenomenon.

Technology

“We don’t want technology simply because it’s dazzling. We want it, create it and support it because it improves people’s lives.”

These words were uttered by Canadian Prime Minister, Justin Trudeau, at Davos last week. The commodity markets have been dealing with technology since the rise of Sumer. The Manhattan Institutes – SHALE 2.0 Technology and the Coming Big-Data Revolution in America’s Shale Oil Fields highlights some examples which go a long way to explaining the downward trajectory in oil prices over the last 18 months – emphasis is mine:-

John Shaw, chair of Harvard’s Earth and Planetary Sciences Department, recently observed: “It’s fair to say we’re not at the end of this [shale] era, we’re at the very beginning.” He is precisely correct. In recent years, the technology deployed in America’s shale fields has advanced more rapidly than in any other segment of the energy industry. Shale 2.0 promises to ultimately yield break-even costs of $5–$20 per barrel—in the same range as Saudi Arabia’s vaunted low-cost fields.

…Compared with 1986—the last time the world was oversupplied with oil—there are now 2 billion more people living on earth, the world economy is $30 trillion bigger, and 30 million more barrels of oil are consumed daily. The current 33 billion-barrel annual global appetite for crude will undoubtedly rise in coming decades. Considering that fluctuations in supply of 1–2 MMbd can swing global oil prices, the infusion of 4 MMbd from U.S. shale did to petroleum prices precisely what would be expected in cyclical markets with huge underlying productive capacity.

Shipbuilding has also benefitted from technological advances in a variety of areas, not just fuel efficiency. This article (please excuse the author’s English) from Marine Insight – 7 Technologies That Can Change The Future of Shipbuilding – highlights several, I’ve chosen five:-

3-D Printing Technology:…Recently, NSWC Carderock made a fabricated model of the hospital ship USNS Comfort (T-AH 20) using its 3-D printer, first uploading CAD drawings of ship model in it. Further developments in this process can lead the industry to use this technique to build complex geometries of ship like bulbous bow easily. The prospect of using 3-D printers to seek quick replacement of ship’s part for repairing purpose is also being investigated. The Economist claims use this technology to be the “Third Industrial Revolution“.

Shipbuilding Robotics: Recent trends suggest that the shipbuilding industry is recognizing robotics as a driver of efficiency along with a method to prevent workers from doing dangerous tasks such as welding. The shortage of skilled labour is also one of the reasons to look upon robotics. Robots can carry out welding, blasting, painting, heavy lifting and other tasks in shipyards.

LNG Fueled engines

…In the LNG engines, CO2 emission is reduced by 20-25% as compared to diesel engines, NOX emissions are cut by almost 92%, while SOX and particulates emissions are almost completely eliminated.

…Besides being an environmental friendly fuel, LNG is also cheaper than diesel, which helps the ship to save significant amount of money over time.

…Solar & Wind Powered Ships:

…The world’s largest solar powered ship named ‘Turanor’ is a 100 metric ton catamaran which motored around the world without using any fuel and is currently being used as a research vessel. Though exclusive solar or wind powered ships look commercially and practically not viable today, they can’t be ruled out of future use with more technical advancements.

Recently, many technologies have come which support the big ships to reduce fuel consumption by utilizing solar panels or rigid sails. A device named Energy Sail (patent pending) has been developed by Eco Marine Power will help the ships to extract power from wind and sun so as to reduce fuel costs and emission of greenhouse gases. It is exclusively designed for shipping and can be fitted to wide variety of vessels from oil carrier to patrol ships.

Buckypaper: Buckypaper is a thin sheet made up of carbon nanotubes (CNT). Each CNT is 50,000 thinner than human air. Comparing with the conventional shipbuilding material (i.e. steel), buckypaper is 1/10th the weight of steel but potentially 500 times stronger in strength  and 2 times harder than diamond when its sheets are compiled to form a composite. The vessel built from this lighter material would require less fuel, hence increasing energy efficiency. It is corrosion resistant and flame retardant which could prevent fire on ships. A research has already been initiated for the use of buckypaper as a construction material of a future aeroplane. So, a similar trend can’t be ruled out in case of shipbuilding.

Shipping has always been a cyclical business, driven by global demand for freight on the one hand and improvements in technology on the other. The cost of production continues to fall, old inventory rapidly becomes uncompetitive and obsolete. The other factor effecting the cycle is the cost of finance; this is true also of energy exploration and development. Which brings us to the actions of the CBs.

The central role of the central banks

Had $100 per barrel oil encouraged a rise in consumer price inflation in the major economies, it might have been appropriate for their CBs to raise interest rates, however, high levels of debt kept inflation subdued. The “unintended consequences” or, perhaps we should say “collateral damage” of allowing interest rates to remain unrealistically low, is overinvestment. The BIS – Self-oriented monetary policy, global financial markets and excess volatility of international capital flows – looks at the effect developed country CB policy – specifically the Federal Reserve – has had on emerging markets:-

A major policy question arising from these events is whether US monetary policy imparts a global ‘externality’ through spillover effects on world capital flows, credit growth and asset prices. Many policy makers in emerging markets (e.g. Rajan, 2014) have argued that the US Federal Reserve should adjust its monetary policy decisions to take account of the excess sensitivity of international capital flows to US policy. This criticism questions the view that a ‘self-oriented’ monetary policy based on inflation targeting principles represents an efficient mechanism for the world monetary system (e.g. Obstfeld and Rogoff, 2002), without the need for any cross-country coordination of policies.

…Our results indicate that the simple prescriptions about the benefits of flexible exchange rates and inflation targeting are very unlikely to hold in a global financial environment dominated by the currency and policy of a large financial centre, such as the current situation with the US dollar and US monetary policy. Our preliminary analysis does suggest however that an optimal monetary policy can substantially improve the workings of the international system, even in the absence of direct intervention in capital markets through macro-prudential policies or capital controls. Moreover, under the specific assumptions maintained in this paper, this outcome can still be consistent with national independence in policy, or in other words, a system of ‘self-oriented’ monetary policy making.

Whether CBs should consider the international implications of their actions is not a new subject, but this Cobden Centre article by Alisdair Macleod – Why the Fed Will Never Succeed – suggests that the Fed should be mandated to accept a broader role:-

That the Fed thinks it is only responsible to the American people for its actions when they affect all nations is an abrogation of its duty as issuer of the reserve currency to the rest of the world, and it is therefore not surprising that the new kids on the block, such as China, Russia and their Asian friends, are laying plans to gain independence from the dollar-dominated system. The absence of comment from other central banks in the advanced nations on this important subject should also worry us, because they appear to be acting as mute supporters for the Fed’s group-think.

This is the context in which we need to clarify the effects of the Fed’s monetary policy. The fundamental question is actually far broader than whether or not the Fed should be raising rates: rather, should the Fed be managing interest rates at all? Before we can answer this question, we have to understand the relationship between credit and the business cycle.

There are two types of economic activity, one that correctly anticipates consumer demand and is successful, and one that fails to do so. In free markets the failures are closed down quickly, and the scarce economic resources tied up in them are redeployed towards more successful activities. A sound-money economy quickly eliminates business errors, so this self-cleansing action ensures there is no build-up of malinvestments and the associated debt that goes with it.

When there is stimulus from monetary inflation, it is inevitable that the strict discipline of genuine profitability that should guide all commercial enterprises takes a back seat. Easy money and interest rates lowered to stimulate demand distort perceptions of risk, over-values financial assets, and encourages businesses to take on projects that are not genuinely profitable. Furthermore, the owners of failing businesses find it possible to run up more debts, rather than face commercial reality. The result is a growing accumulation of malinvestments whose liquidation is deferred into the future.

Macleod goes on to discuss the Cantillon effect, at what point we are in the Credit Cycle and why the Fed decided to raise rates now:-

We must put ourselves in the Fed’s shoes to try to understand why it has raised rates. It has seen the official unemployment rate decline for a prolonged period, and more recently energy and commodity prices have fallen sharply. Assuming it believes government unemployment figures, as well as the GDP and its deflator, the Fed is likely to think the economy has at least stabilised and is fundamentally healthy. That being the case, it will take the view the business cycle has turned. Note, business cycle, not credit-driven business cycle: the Fed doesn’t accept monetary policy is responsible for cyclical phenomena. Therefore, demand for energy and commodities is expected to increase on a one or two-year view, so inflation can be expected to pick up towards the 2% target, particularly when the falls in commodity and energy prices drop out of the back-end of the inflation numbers. Note again, inflation is thought to be a demand-for-goods phenomenon, not a monetary phenomenon, though according to the Fed, monetary policy can be used to stimulate or control it.

Unfortunately, the evidence from multiple surveys is that after nine years since the Lehman crisis the state of the economy remains suppressed while debt has continued to increase, so this cycle is not in the normal pattern. It is clear from the evidence that the American economy, in common with the European and Japanese, is overburdened by the accumulation of malinvestments and associated debt. Furthermore, nine years of wealth attrition through monetary inflation (as described above) has reduced the purchasing power of the average consumer’s earnings significantly in real terms. So instead of a phase of sustainable growth, it is likely America has arrived at a point where the economy can no longer bear the depredations of further “monetary stimulus”. It is also increasingly clear that a relatively small rise in the general interest rate level will bring on the next crisis.

So what will the Fed – and, for that matter, other major CBs – do? I look back to the crisis of 2008/2009 – one of the unique aspects of this period was the coordinated action of the big five: the Fed, ECB, BoJ, BoE and SNB. In 1987 the Fed was the “saviour of the universe”. Their actions became so transparent in the years that followed, that the phase “Greenspan Put” was coined to describe the way the Fed saved stock market investors and corporate creditors. CEPR – Deleveraging? What deleveraging? which I have quoted from in previous letters, is an excellent introduction to the unintended consequences of CB largesse.

Since 2009 economic growth has remained sluggish; this has occurred despite historically low interest rates – it’s not unreasonable to surmise that the massive overhang of debt, globally, is weighing on both demand pull inflation and economic growth. Stock buy-backs have been rife and the long inverted relationship between dividend yields and government bond yields has reversed. Paying higher dividends may be consistent with diversifying a company’s investor base but buying back stock suggests a lack of imagination by the “C” Suite. Or perhaps these executives are uncomfortable investing when interest rates are artificially low.

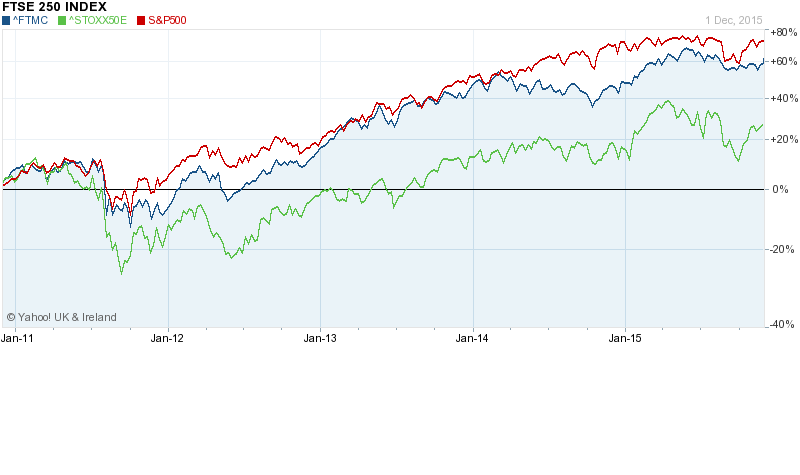
I believe the vast majority of the rise in stock markets since 2009 has been the result of CB policy, therefore the Fed rate increase is highly significant. The actions of the other CBs – and here I would include the PBoC alongside the big five – is also of significant importance. Whilst the Fed has tightened the ECB and the PBoC continue to ease. The Fed appears determined to raise rates again, but the other CBs are likely to neutralise the overall effect. Currency markets will take the majority of the strain, as they have been for the last couple of years.

A collapse in equity markets will puncture confidence and this will undermine growth prospects globally. Whilst some of the malinvestments of the last seven years will be unwound, I expect CBs to provide further support. The BoJ is currently the only CB with an overt policy of “qualitative easing” – by which I mean the purchasing of common stock – I fully expect the other CBs to follow to adopt a similar approach. For some radical ideas on this subject this paper by Professor Roger Farmer – Qualitative Easing: How it Works and Why it Matters – which was presented at the St Louis Federal Reserve conference in 2012 – makes interesting reading.

Investment opportunities

In comparison to Europe– especially Germany – the US economy is relatively immune to the weakness of China. This is already being reflected in both the currency and stocks markets. The trend is likely to continue. In the emerging market arena Brazil still looks sickly and the plummeting price of oil isn’t helping, meanwhile India should be a beneficiary of cheaper oil. Some High yield non-energy bonds are likely to be “tarred” (pardon the pun) with the energy brush. Meanwhile, from an international perspective the US$ remains robust even as the US$ Index approaches resistance at 100.
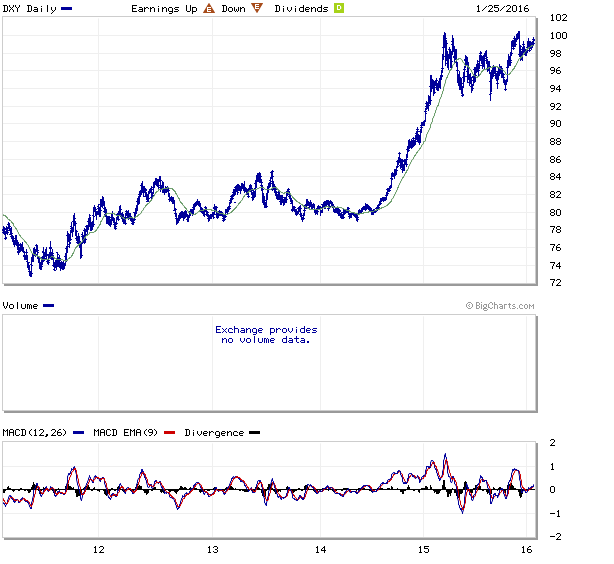
US_Index_-_5_yr_Marketwatch

Source: Marketwatch

Is the ascension of the RMB to the SDR basket more than merely symbolic?

400dpiLogo

Macro Letter – Supplemental – No 2 – 11-12-2015

Is the ascension of the RMB to the SDR basket more than merely symbolic?

  • Chinese rebalancing towards domestic consumption changes the balance of trade
  • China’s largest trading partner remains the EU, making a US$ peg sub-optimal
  • SDR currencies offer the best liquidity for intervention or speculation
  • International investment will be dramatically enhanced by full convertibility

I’ve changed my view of the importance of the RMBs inclusion in the SDR. Initially I thought this a purely symbolic action but, having discussed the issue with several economists and ex-Central Bankers (including one from the PBoC) I believe this a logical move towards free convertibility of the RMB.

For many years the RMB has been pegged to the US$. During the early part of this century it rose relative to its neighbours. This was not such a great imposition on the economy since annual GDP growth was still in double figures.

After the great financial recession of 2008 things changed. New economic policies focused on increasing domestic consumption. At the same time the Chinese economy began to slow dramatically as a result of over-investment, especially in primary industries, meanwhile, the benefits of cheap labour, which had driven China’s mercantilist expansion during the past 25 years, showed signs of fatigue.

After 2008, the US embarked on aggressive quantitative easing which eventually began to foster new domestic employment opportunities – in turn leading to a recovery of the fortunes of the US$. Earlier this year the PBoC devalued the RMB albeit to a small degree.

If you were the PBoC what would you do?

China is rebalancing towards domestic consumption at a pace which would be almost inconceivable in any other country. The implications of this shift include an increase in imports and a structural adjustment in the momentum of the trade surplus. China is moving on from simply being the world’s manufacturer to become a trading nation. A freely convertible currency would reduce frictions in trade and encourage foreign direct investment. The downside to this regime change is the volatility of the exchange rate.

At $3.5trln the PBoC has the largest foreign reserves of any Central Bank. This has primarily been a function of their peg against the US$, although they have actively sought to diversify in to EUR and even the “barbarous relic” gold. During the last 18 months the bank has drawn down on some of those reserves (they peaked at $3.9trln in May 2014) as it managed a devaluation versus the US$ which has fallen from RMBUSD 6.05 in January 2014 to RMBUSD 6.49 today (8-12-2015).

Has the benefit of the US$ peg now run its course? During the period of strong – export led – growth, China was under significant international political pressure to allow the RMB to rise against the US$. The perception is that they resisted international interference, but over the last 20 years the RMB has risen by around 30%. Nonetheless, market commentators immediately seized on the devaluation – especially since August – as a sign that the Chinese were engineering an export led recovery at the expense of the US. This 2013 paper from the Bundesbank – China‘s role in global inflation dynamics suggests there may be some substance to these concerns:-

The overall share of international inflation explained by Chinese shocks is notable (about 5 percent on average over all countries but not more than 13 percent in each region). This suggests that monetary policy makers should take macroeconomic developments in China into account when stabilizing domestic inflation rates; (ii) Direct channels (via import and export prices) and indirect channels (via greater exposure to foreign competition and commodity prices) both seem to matter; (iii) Differences in trade (overall and with China) and in commodity exposure help explaining cross-country differences in price responses.

Nonetheless, the authors note that, between 2002 and 2011, the “supply shock” from cheap Chinese goods explained only 1% of changes in consumer prices outside China, whilst the “demand shock”, from rapid Chinese, growth accounted for 3.6% of changes in global consumer prices. 95% of the variation in global inflation were due to non-Chinese factors.

As the Trans Pacific Partnership comes into effect, China needs to embark on a series of bilateral trade agreements. After the US, its largest trading partners are Japan, South Korea, Taiwan, Germany, Australia and Malaysia, however, as a currency trading block the Euro Area is preeminent.

There are two alternatives to a US$ peg, the first is to manage the RMB effective exchange rate, but this would be expensive due to the multiple currencies involved, the second option is to peg the RMB to the SDR basket. Both politically and economically this acknowledges China’s position as the second largest economy. It also heralds another incremental change in perception about the pre-eminence of the US$ as a reserve currency.

The RMB will be included in the SDR from October 2016. As the Chinese administration moves towards free-convertibility it is likely that they will start by widening the degree to which the currency can fluctuate. By managing the RMB versus the other SDR currencies they can take advantage of the liquidity these currencies provide and the lower volatility that the SDR basket has relative to its constituents. This will also allow the PBoC to intervene to stem the largest speculative currency flows. Table below shows the annual level of trade by region (2011):-

Region Exports Imports Total trade Trade balance
 European Union 356 211.2 567.2 144.8
 United States 324.5 122.2 446.7 202.3
 Hong Kong 268 15.5 283.5 252.5
 ASEAN 170.1 192.8 362.9 -22.7
 Japan 148.3 194.6 342.9 -46.3


Source: China National Statistics Bureau

Capital Flows

Trade is one aspect of China’s development, the other is capital; the Kansas City Federal Reserve Macro Bulletin – Global Capital Flows from China – takes up the story:-

In 2014-15, China experienced five consecutive quarters of capital outflows for the first time since 2000, and the annual volume of outflows is at a record level. If growth expectations continue to soften, this trend may continue in the near future.

China has been an active investor in Africa and other resource-rich regions, but, as its competitive advantages from labour dissipate, external investment will become far more important. Another reason to allow full convertibility.

Technical issues and challenges

The two requirements for joining the SDR are; being a larger exporter – which is no issue for China -and having a freely accessible currency. They still have some way to go on the latter, but China now has more than two dozen swap lines with foreign central banks, has promoted offshore trading and abolished quotas for foreign central banks and sovereign wealth funds investing in mainland bonds. 

RMB fixing – the PBoC as a participating SDR central bank, must provide the IMF with a daily fix. Currently there is a gap between domestic and the offshore RMB rate, closing that gap will be an operational challenge.

SDR currencies are weighted based on trade and reserve status – Marc Chandler – China And The Pull Of The SDR – elaborates:-

Given China’s export prowess, it suggests the yuan should be a major currency in the SDR. However, as a reserve asset, it is very small. The IMF estimates the yuan’s share of reserves at a minuscule 1.1%.

For more on the technical aspects of the SDR this paper from Europacifica – The RMB in the SDR and why Australia should care offers more insights.

In October China issued its first Treasury bill on the international market. Here is how it was reported by the FT – China completes first London debt sale:-

Spencer Lake, global head of capital financing at HSBC, one of the banks that arranged the sale, called the transaction a milestone in the internationalisation of the renminbi, noting that it was the first debt offering in any currency from the PBoC outside China.

“This strategic move demonstrates the clear commitment by the Chinese authorities to grow the offshore bond market and the confidence in the City of London as a leading renminbi hub for future activities,” he said.

“The PBoC bond will give a genuine boost to liquidity, market confidence and provide investors with the quality that they demand.”

Who will buy the non-performing loans?

Another reason China may want to move towards free convertibility is to encourage foreign investment. An article from Zero-Hedge – One Analyst Says China’s Banking Sector Is Sitting On A $3 Trillion Neutron Bomb explains:-

If one very conservatively assumes that loans are about half of the total asset base (realistically 60-70%), and applies an 20% NPL to this number instead of the official 1.5% NPL estimate, the capital shortfall is a staggering $3 trillion. 

That, as we suggested three weeks ago, may help to explain why round after round of liquidity injections (via RRR cuts, LTROs, and various short- and medium-term financing ops) haven’t done much to boost the credit impulse. In short, banks may be quietly soaking up the funds not to lend them out, but to plug a giant, $3 trillion, solvency shortfall. 

Conclusion

I believe the inclusion of the RMB in the SDR is more than simply symbolic. It will allow the PBoC to move away from a US$ peg, widen it trading bands and balance its currency more effectively relative to its main trading partners. PBoC Intervention can be generally confined to SDR currencies which, due to their high liquidity, will be the cross-currency pairs of choice for speculators.

What are the prospects for UK financial markets in 2016?

400dpiLogo

Macro Letter – No 47 – 04-12-2015

What are the prospects for UK financial markets in 2016?

  • The EU referendum may take place as early at as June next year
  • Financial markets appear to be ignoring the vote at present
  • The tightening of bank capital requirements is almost over
  • Higher tax receipts have tempered the pace of fiscal tightening

In assessing the prospects for UK financial markets next year I will focus on three areas, the EU referendum, the stability of the financial system and the state of government finances.

The EU Referedum

As we head into 2016 political and economic commentators are beginning to focus on the potential impact of a UK exit from the EU would have on the British economy. Given the size and importance of the financial services sector to the economy, I want to investigate claims that a UK exit would be damaging to growth and lead to a rise in unemployment. For a more general overview of the referendum please see my July 3rd post – Which way now – FTSE, Gilts, Sterling and the EU referendum?

In February a report by the UK Parliament – Financial Services: contribution to the UK economy opened with the following statement:-

In 2014, financial and insurance services contributed £126.9 billion in gross value added (GVA) to the UK economy, 8.0% of the UK’s total GVA. London accounted for 50.5% of the total financial and insurance sector GVA in the UK in 2012. The sector’s contribution to UK jobs is around 3.4%. Trade in financial services makes up a substantial proportion of the UK’s trade surplus in services. In 2013/14, the banking sector alone contributed £21.4 billion to UK tax receipts in corporation tax, income tax, national insurance and through the bank levy.

The GVA was down from a 2009 high of 9.3%. For London the GVA was 18.6%. In international terms the UK ranks fourth, behind Luxembourg, Australia and the Netherlands in terms of the size of its financial services sector. As at September 2014, 1.1mln people were employed in the sector. According to research by PWC financial services accounted for £65.6bln or 11.5% of total government tax receipts in 2013-14.

Last week the Evening Standard – ‘Brexit’ would lead to loss of 100,000 bank jobs, says City – cited senior banking figures warning of the potential impact of the UK leaving the EU:-

Mark Boleat, policy chairman at the City of London Corporation, said: “If as a country we were to vote to leave, then London’s position as a leading financial centre would remain but without doubt there would be an impact on our relative size and the jobs we support.”

Confidential client research from analysts at US investment bank Morgan Stanley, seen by the Standard, warned that “firms for whom the EU market is important” would need to “adjust their footprint” in London if the Eurosceptic cause was victorious.

Sir Mike Rake, deputy chair of Barclays and chairman of BT, said: “It is extremely difficult to quantify the number of jobs that would be lost and the time frame over which that might happen but leaving the EU would severely damage London’s competitiveness and our financial services sector.”

There have been growing hints from financial institutions that they are starting to plan for Britain quitting the 28 member club.

Both HSBC, which announced a review of the location of its global headquarters in April, and JP Morgan are reportedly in talks about moving sections of their businesses to Luxembourg in part because of the threat of Brexit.

Deutsche Bank, which employs 9,000 people in Britain, has set up a working group to review whether to move parts of its business from Britain in the event of a UK withdrawal. 

US asset management group Vanguard, which has a City office, has admitted that Brexit would have a “significant impact” on its operation across Europe and has already started planning for it.

Many senior bankers are concerned that they would lose the financial services “passporting” rights enjoyed by fellow EU members.

A fascinating historic assessment of the opinion of the UK electorate towards the EU is contained in this week’s Deloitte – Monday Briefing, they  anticipate a referendum date of either June or September 2016, in order to avoid coinciding with a French (March/April) or German (September) election in 2017:-

Since Ipsos MORI started polling on this issue in 1977 on average 53% of voters in a simple yes/no poll have supported membership and 47% have opposed it. The yes vote reached a low of 26% in 1980 rising, over the following decade, to a peak of 63% in 1991, shortly before the pound’s ejection from the European Exchange Rate Mechanism.

In June of this year Ipsos MORI showed UK public support for the EU, again on a straight yes/no poll, at an all-time peak of 75%. Since then it has fallen away in parallel with heightened UK public concerns about immigration. The most recent Ipsos MORI poll, from mid-October, showed the yes vote at 59%.

More recent polls suggest a further narrowing of the yes lead. Across eight polls carried out in November the yes vote averaged 52% and the no vote 48%.  

The yes vote is, by and large, younger and more affluent than the no. Opposition to the EU rises sharply among the over 40s, an important consideration given that voter turnout is higher among older voters. Conservative voters tend to be more eurosceptic than Labour voters; white voters tend to be more sceptical than non-white voters.

… “don’t knows” averaged around 15% of all voters, more than enough to tip the vote decisively.  

The last referendum on UK membership of what was then the European Economic Community (EEC) was held in 1975, just two years after the UK joined the EEC. The vote was an overwhelming victory for EEC membership, with the electorate voting by 67.2% to 32.8% to stay in.

… In an intriguing paper economists David Bowers and Richard Mylles of Absolute Strategies Research (ASR) outline how the political landscape has shifted in the last 40 years.

… in 1975 the debate was about membership of a trading bloc, the Common Market. For sure, the commitment to “ever closer union” was in the Treaty of Rome, but in 1975 few in the UK, especially in the yes campaign, paid much attention to it. Since then the EU has grown from 9 to 28 members, expanded into Central and Eastern Europe, created the Single Currency and acquired more characteristics of a federal union.

…In 1975 the UK economy was in a shambles, slipping into the role of sick man of Europe. In the previous three years the UK had endured a recession, double digit inflation, endemic industrial unrest and the imposition of a three-day working week to save scarce energy supplies. British voters in 1975 looked enviously to the prosperity and stability of Germany. Today the UK is seeing decent growth, while the euro area grapples with the migration crisis, sluggish activity and the difficulties of building a durable monetary union. On a relative basis the performance of the UK economy looks, for now at least, pretty good.

…The Maastricht Treaty of 1992 established the right of people to live and work anywhere in the EU, but… it was EU enlargement into Central and Eastern Europe in 2004 that caused immigration into the UK to rise markedly, pushing migration up the list of UK voter concerns. More recent migration from North Africa and the Middle East, and the growing problems facing the Schengen nations, have added new concerns.  

The final factor…was the enthusiasm of the majority of the press for the Common Market in 1975. The press gave the then Prime Minister, Harold Wilson, largely uncritical coverage of his negotiations for a “better deal” in Britain’s relationship with the Community. (Historians tend to the view that Wilson actually achieved little in his negotiations with the Community; but he deftly turned meagre result into a public relations triumph). The lone dissenting voice in a general mood of press enthusiasm for the EEC was the Communist Morning Star. This time round it seems likely that a number of major papers will take a euro sceptic line.

The most recent poll, published by ORB last week in the wake of the Paris attacks, found 52% in favour of exit.

Financial Stability

This week saw the release of the Bank of England – Financial Stability Report – December 2015 – it suggests that the UK economy has moved beyond the post-crisis phase, the risks are, once again, external in nature:-

The global macroeconomic environment remains challenging. Risks in relation to Greece and its financing needs have fallen from their acute level at the time of the publication of the July 2015 Report. But, as set out in July, risks arising from the global environment have rotated in origin from advanced economies to emerging market economies. Since July, there have been further downward revisions to emerging market economy growth forecasts. In global financial markets, asset prices remain vulnerable to a crystallisation of risks in emerging market economies. More broadly, asset prices are currently underpinned by the continued low level of long-term real interest rates, which may in part reflect unusually compressed term premia. As a consequence, they remain vulnerable to a sharp increase in market interest rates. The impact of such an increase could be magnified, at least temporarily, by fragile market liquidity.

Domestically, the FPC judges that the financial system has moved out of the post-crisis period. Some domestic risks remain elevated. Buy-to-let and commercial real estate activity are strengthening. The United Kingdom’s current account deficit remains high by historical and international standards, and household indebtedness is still high.

Against these elevated risks some others remain subdued, albeit less so than in the post-crisis period to date. Comparing credit indicators to the past alone cannot provide a full risk assessment of the level of risk today, but can be informative. Aggregate credit growth, though modest compared to pre-crisis growth, is rising and is close to nominal GDP growth. Spreads between mortgage lending rates and risk-free rates have fallen back from elevated levels.

They go on to note that the Tier 1 capital position of major UK banks was 13% of risk-weighted assets in September 2015, below the levels advocated by the Vicker’s Commission but above Basel requirements. The Financial Policy Committee (FPC) are expected to impose a 1% counter-cyclical capital buffer in the near future, but otherwise the fiscal tightening, which has been in train since the aftermath of the financial crisis has finally run its course.

The other risks which concern the Bank are cyber-risks of varying types and, of course, the uncertainty surrounding the EU referendum.

Autumn Statement and Spending Review

Last week saw the publication of the UK Chancellor’s Autumn Statement and Spending Review. Mr Osborne was fortunate; the OBR found an additional £27bln in tax receipts which allowed him to reverse some of the more unpopular spending cuts previously announced. He still hopes to balance the government budget by 2020/2021. Public spending will rise from £757bln this year to £857bln in 2020/21. Assuming the economy grows as forecast, public spending to GDP ratio should fall from 39.7% to 36.5%.

Writing in the Telegraph Mark Littlewood of the IEA said:-

George Osborne has today made a one-way bet. His announcements are based on two predictions: continually low interest rates and sustained strong economic growth, making our debt repayments lower than anticipated and tax revenues higher than expected. These are not unrealistic assumptions, but if either go off course, the savings announced today will not go nearly far enough.

Market Performance

Stocks

Financial markets abhor uncertainty. Concern about collapsing FDI and Scottish devolution due to Brexit, will hang over the markets until the outcome of the vote is known: meanwhile rising rhetoric will discourage investment. Regardless of economic performance UK stocks are likely to underperform.

Back in July I believed the uncertainty about the UK position on the EU would have minimal effect:-

Unless the UK joins the EZ, currency fluctuations will continue whether they stay or go. Gilt yields will continue to reflect inflation expectations and estimates of credit worthiness; being outside the EU might impose greater fiscal discipline on subsequent UK governments – in this respect the benefits of EU membership seem minimal. The UK stock market will remain diverse and the success of UK stocks will be dependent on their individual businesses and the degree to which the regulatory environment is benign.

Here’s how the markets have evolved since the summer. Firstly the FTSE100 vs EuroStox50 and S&P500 – six month chart, at first blush, I was wrong, the FTSE  has underperformed EutoStoxx and the S&P:-

FTSE vs STOX vs SPX 6month

Source: Yahoo Finance

However, the FTSE250 tells a different story:-

FTSE100 vs 250 - 6m

Source: Yahoo Finance

This divergence has been in place for several years as the five year chart below shows:-

FTSE100 vs 250 - 5 yr

Source: Yahoo Finance

Here is the FTSE250 compared to EuroStox50 and the S&P500 – over the same five year period. The mid cap Index has followed the S&P, although in US$ terms its performance has been less impressive:-

FTSE250 vs EurStox and S&P - 5yr

Source: Yahoo Finance

Gilts and Bunds

During the period since the beginning of July the spread between 10yr Gilts and Bunds has ranged between 112bp and 145bp reaching its narrowest during the fall in equity markets in August and widening amid concerns about European growth last month. UK Inflation expectations remain subdued; this is how the MPC – November Inflation Report described it:-

All members agree that, given the likely persistence of the headwinds weighing on the economy, when Bank Rate does begin to rise, it is expected to do so more gradually and to a lower level than in recent cycles.

Sterling

The Sterling Effective Exchange Rate has traded in a relatively narrow range (please excuse the date axis, vagaries of the Bank of England’s data format – this is a one year chart):-

GiltBund JulNov

Source: Bank of England

During  stock market weakness in the summer Sterling strengthened. After weakening in October it rebounded, following the US$, in November.

Back in July I anticipated a weakening of Sterling:-

Ahead of the referendum, uncertainty will lead to weakness in Sterling, higher Gilt yields and relative underperformance of UK stocks. If the UK electorate decide to remain in the EU, there will be a relief rally before long-term trends resume. If the UK leaves the EU, Sterling will fall, inflation will rise, Gilt yields will rise in response and the FTSE will decline. GDP growth will slow somewhat, until an export led recovery kicks in as a result of the lower value of Sterling. The real cost to the UK is in policy uncertainty.

It may be that capital outflows are about to begin in earnest but I start to question my assumptions – the market seems to be caught between the uncertainty surrounding UK membership of the EU and doubts about the longevity of the “European Experiment” as a whole.

Conclusion

Gilts remain below their long run average spread over Bunds but the interest rate environment is exceptionally benign, making any pick up in yield attractive. The FTSE250 index appears to be ignoring concerns about collapsing commodities, slowing emerging markets – especially China – and the prospect of Brexit, but it may struggle to remain detached for much longer. Sterling also appears to have ignored the referendum debate so far. Or perhaps, the UK market is a relative “safe haven” offering exposure to European markets without the angst of Euro membership – either way I remain cautious until the political uncertainties dissipate.

Should we buy Turkey for Thanksgiving?

400dpiLogo

Macro Letter – No 46 – 20-11-2015

Should we buy Turkey for Thanksgiving?

  • Erdogan’s AKP won an unexpected majority in this month’s election
  • The Turkish Lira (TRY) has fallen by 60% against the USD since 2008
  • Turkish stocks look inexpensive by several measures
  • Economic reform appears unlikely

Back in June the AKP failed to achieve a majority in this year’s first general election. Second time around they achieved a resounding victory – though not the “supermajority” required for constitutional reform. The main reason for the loss of confidence earlier in the year was the state of the Turkish economy. Now the AKP has an opportunity to embark on economic reform – this may be easier said than done.

They need to deal with rising unemployment which, having dipped to 9.3% in May, is on the rise again – August 10.1%. Labour participation has been steadily rising – from 43.6 in 2006 to 51.2 today, however it is still low by international standards and female participation is a rather dismal 29%. Youth unemployment has fallen from 28% in 2009 to 18.3% in August, but this does not bode well for their relatively young nation. Of the 77mln population, 67% are notionally working age – 15 to 64. Only 6% are over 64 years. Turks make up 75% of the population whilst Kurds already account for 18%; as this 2012 article from the IB Times – A Kurdish Majority In Turkey Within One Generation? makes clear, substantial cultural challenges lie ahead.

High unemployment has impacted consumer confidence which plunged to 58.52 in September – its lowest level since the global recession of 2009. October saw a rebound to 62.78.

Core inflation remains stubbornly high despite the fall in oil prices. During the summer it dipped below 8% but by October it was 9.3%. The chart below shows the core inflation rate over the last decade:-

turkey-core-inflation-rate

Source: Tradingeconomics and Eurostat

High inflation is primarily due to the weakness of the TRY; the next chart shows USDTRY, but the BIS Effective exchange rate also declined from 100 in 2010 to 70.6 at the end of 2014. The last big TRY devaluation occurred between February and October 2001, the move since 2008 has been of a similar magnitude, albeit with less precipitous haste:-

turkey-currency

Source: Tradingeconomics

Inflation might have been even higher had imports not fallen:-

turkey-imports

Source: Tradingeconomics and Turk Stat

The decline in imports, principally from Russia (10.4%) China (10.3%) and Germany (9.2%) helped reduce the current account deficit to some extent but at -6% of GDP it remains, unhealthy:-

turkey-current-account-to-gdp

Source: Tradingeconomics and Central Bank of Turkey

Turkey is a big energy importer – for a more detailed discussion on energy security for Turkey (and the EU) this working paper from Bruegel – Designing a new Eu-Turkey Gas Partnership is worth perusal.

The current account deficit is matched by the government budget balance, this has remained negative for most of the decade, although the debt to GDP ratio is an undemanding 33%:-

turkey-government-budget

Source: Tradingeconomics and Turkish Ministry of Economics

Meanwhile Turkey’s external debt continues to grow, it now equates to more than half of GDP:-

turkey-external-debt

Source: Tradingeconomics and Turkish Treasury

Much of the external borrowing has been short-term and the private sector accounts for more than two thirds of the total. Since 2002 GDP has increased from $233bln to $800bln – during the same period external debt has tripled. Short-term debt to central bank reserves have doubled. The table below investigates this and other aspects of Turkey’s external debt:-

Turkish Debt

Source: Central Bank of Turkey and Turk Stat

In 2013 Morgan Stanley dubbed Turkey one of the “fragile five”, the others being Brazil, India, Indonesia and South Africa. These countries had high external debt, twin deficits, structurally high inflation and slowing growth. Turkish GDP has been recovering somewhat this year – 3.8% in Q2 2015 – but it remains below its 2002-2011 average of 5.2%:-

turkey-gdp-growth-annual

Source: Tradingeconomics and Turk Stat

Given the weakness of the currency it is surprising that economic recovery has not been more pronounced. This may be due to the parlous state in Turkey’s principal export markets, Germany (9.6%) has seen slow growth and Iraq (6.9%) has been in recession:-

turkey-exports

Source: Tradingeconomics and Turk Stat

In March Morgan Stanley announced that India and Indonesia had made sufficient reforms to be removed from the “Fragile” category. Turkey remains, unreformed, especially in terms of its labour laws – a focal point if they are to reduce structural unemployment.

Turkey has demographic trends on its side but its productivity has been stagnant since the financial crisis. The OECD estimated GDP per hour for 2014 at 29.3 hours – in 2007 it was 28.9 hours.

Financial Markets

Short-term interest rates, which touched 10% last year, have fallen to 7.5%, despite inflation and TRY weakness, but the independence of the central bank has been questioned since Erdogan openly criticised their interest rate policy in March – with the AKP majority restored the problem of inflation may be deferred:-

turkey-interest-rate

Source: Tradingeconomics and Central Bank of Turkey

Reflecting market sentiment better, 10yr Turkish Government bonds, reached 10.78% in October, although they have recovered, in the wake of the election, to yield 9.72% today (Wednesday 18th) here is a five year chart:-

turkey-government-bond-yield 5yr

Source: Tradingeconomics and Turkish Treasury

From a technical perspective bond yields appear to have backed away from the 2014 highs, but considered in conjunction with the continued trend of the TRY, I lack the confidence to buy ahead of real economic reform package. Meanwhile, the US Federal Reserve look set to raise interest rates next month, putting further downward pressure on the TRY and driving short-term US$ financing costs higher.

The Turkish XU100 stock index rallied from 77,776 to 83,692 after the election – today (Wednesday 18th) it stands at 81,274. It has been buoyed by currency weakness:-

turkey-stock-market

Source: Tradingeconomics and Istanbul Stock Exchange

The market valuation is relatively undemanding. A CAPE of 10.3 is higher than its emerging European neighbours, but on a straight PE basis (11 times) and dividend yield (3.4%) it is comparable. On a price to cost, price to book or price to sales basis, however, it is more expensive than Emerging Europe.

The largest stocks in the index are:-

Company Ticker Sector
Garanti Bankası GARAN Banking
Akbank AKBNK Banking
Turkcell TCELL Telecommunications
Koç Holding KCHOL Conglomerate
Türkiye İş Bankası ISATR Banking
Türk Telekom TTKOM Telecommunications
Enka İnşaat ENKAI Construction
Sabancı Holding SAHOL Conglomerate
Halk Bankası HALKB Banking
Efes Beverage Group AEFES Beverage
Vakıfbank VAKBN Banking
Turkish Airlines THYAO Transportation

Source: Istanbul Stock Exchange

Whilst the economy is 25% Agriculture, 26% Industry and 49% Services, the stock market is dominated by banks. At the end of 2013 the weights for the XU100 were 36% Banks, 17% Beverages and 8% Conglomerates – although the fragmented (30 companies) cement industry should be mentioned. It is the largest in Europe and fifth largest globally. Rising bond yields, even though they have fallen since the election, and the weakness of the TRY increase the risk of bank losses. Technically, one should remain long, but I’m not inclined to add aggressively at this stage.

An additional concern is Turkey’s political relations with the EU. According to a 3rd September article from Brookings – Why 100,000s of Syrian refugees are fleeing to Europe:-

Turkey’s is being deeply affected too, in spite of having the largest economy in the region and a strong state tradition. Its resources and public patience are wearing thin. The Syrian refugee issue certainly plays a role in the current political instability in the country. According to UNHCR, Turkey became the world’s largest recipient of refugees (total, including those from Iraq) in 2014. 

The EU’s inability to act on concert to address the migrant crisis, along with the imminent collapse of the Schengen Agreement, is likely to further strain relations. It may not stop existing trade but it is likely to slow new business developments.

Security remains a major issue for the new Turkish government as CFR – What Turkey’s Election Surprise Says About the Troubled Country explains:-

…Turkey now confronts simultaneous conflicts with the PKK and the Islamic State. After a year of intensive American diplomacy, Ankara’s decision last July to provide the United States and coalition forces access to air bases close to the Islamic State’s territory has made Turkey a target.

On a more positive note. The new government is likely to make good on its election promises by increasing fiscal stimulus. That 33% debt to GDP ratio must be burning a hole in Erdogan’s pocket. Stimulus is expected to be directed at infrastructure – the “three R’s”, roads, railways and real-estate. “Grand projects” include a third Airport and a mountaintop mosque for Istanbul, a third bridge and a tunnel across the Bosporus, a canal linking the Black Sea to the Sea of Marmara and a gigantic presidential palace in Ankara.

Conclusion – the currency is key

On balance I think it is too soon to buy Turkish bonds or stocks. The new government seems reluctant to embrace the economic reforms needed to drive productivity growth. External debt will have to be repaid, inflation, subdued and jobs created. Turkish stocks look relatively inexpensive and her bonds may be tempting to the carry trader, but an appreciating TRY is key – should the currency recover, stocks and bonds will follow.