Trading – the Ukraine and other geopolitical risks

  400dpiLogo                   

Macro Letter – No 6 –28-02-2014

Trading – the Ukraine and other geopolitical risks

This week I want to look at the impact of the events which have been unfolding in the Ukraine over the past fortnight. Below is a link to the leader from last week’s Economist – Ukraine’s Crisis: A tale of two countries, which describes the fractured nature of this country of 46 mln people:-

http://www.economist.com/blogs/easternapproaches/2014/02/ukraines-crisis

The Ukraine is also being commented on widely by the mainstream press, yet, barring a slightly heightened price of Gold and Oil together with some weakness in certain Eastern European markets, the global financial markets appear to have taken the situation in their stride.

Here is a one year chart for Spot Gold: –

Gold 1 yr

Source: Barchart.com

Below is the front month NYMEX WTI future:-

April 2014 WTI

Source: Barchart.com

Both Gold and Oil started to rise before the Ukrainian situation deteriorated but the heightening of risk has helped them move higher.

The dip and subsequent recovery in Eastern European stocks and currencies is typical of many geopolitical events and makes trading financial markets in this environment, more often than not, profitable for the shorter term “contrarian” trader.

Geopolitical exceptions

1.       German Unification

There are few exceptions to this general “contrarian” rule but one which I would like to review was the unification of Germany in 1989 since this example highlights the way geopolitics events can impact an economy – most events simply don’t meet these criteria.

German Unification led to a substantial restructuring of the unified East and West Germany. The decision in July 1990 to allow Ostmark conversion at one to one parity with the “mighty” Deutsche Mark was considered a major factor in the protracted adjustment process. A closer examination of this action shows that the reason for its significant impact on the economy and financial markets lay in the seismic economic consequences of the political edict. East German wages were well below those of workers in West Germany and their manufacturing productivity was also well below that of the West.

The relative degree of integration of the EZ at the time of the fall of the Berlin Wall meant that the shockwaves from the Unification effected pan-European bond markets. Added to this, Germany’s significant trade with the US and other major economies meant the ripples were felt globally.

The chart below shows German 10 yr Bund yields from 1986 to 1993:-

German Bund Yield 1986 - 1993

Source: Trading Economics

Here is the same period for the DAX Index: –

Germany DAX 1986 - 1993

Source: Trading Economics

It took the German financial markets more than two years to recover from the initial effects of Unification. In the broader economy this process took much longer. The Hartz Plan and subsequent reforms – a reaction to the effect of Unification – only took place between 2003 and 2005.

Below is a chart of the EuroStoxx50 from 1987 to 1996 showing the impact of German Unification on the wider EZ economy: –

EuroStoxx50 - 1987 - 1996

Source: Trading Economics

2.       Other major geopolitical events

9/11/2001 is a date few will forget. The bombing of the World Trade Center had a unique impact on financial markets in that it knocked out the settlement systems of the New York Stock Exchange in additions to its psychological affront to western democracy.

The S&P500 started the week of 10th September 2001 at 1092, by the following Monday it was at 965. The recovery was swift, however, by the mid-October it was back above 1100.

The US equity market was already in a down-trend prior to the attacks and never breached 1200 over the next six months. It then began the next leg of its downturn to bottom at 800 in October 2002. I would argue that this was principally due to the bursting of the internet bubble of 2000 rather than the terrorist attacks on 2001.

S&P500 - 2000-2004

Source: Barchart.com

The Gulf War of August 1990 was another major geopolitical event. The chart below shows how the nascent bull-market after the 1987 crash was stopped in its tracks. During the 1987 stock market crash the S&P500 had made a low around 220. During the Spring of 1990 the market came under pressure but staged a strong recovery into the early Summer. The Gulf War broke out in August 1990 prompting a 20% correction by October – that was the last buying opportunity below 300. By March 1991 it was above the pre-war highs.

S&P500 - 1990-1992

Source: Barchart.com

There are a number of other events which have had a significant impact of the economy and financial markets for a shorter period, for example: – The Iranian Revolution – January 1979, The Bay of Pigs crisis – August 1960, Suez crisis – July 1956. The vast majority of geopolitical events, however, have limited impact economically beyond their immediate borders; to have a wider influence the actors must play a pivotal role in the global economy. I’ll come back to a couple of these potential risks later.

Analysis of Ukrainian contagion

Ukraine - Map

Source: maps.com

Among the major Eastern European markets likely to be impacted by the Ukrainian situation are Poland, Hungary and Romania, yet brief look at their currencies and stock markets indicate little cause for concern. Another casualty has been Russia; its stock market looks sanguine but the RUB has made new highs for the year.

As the rhetoric gathers momentum, the risk that Russia withholds or substantially raises the price of the Natural Gas it supplies to Europe and, in particular, Germany, may create significant problems for the German and wider EZ economy. Whilst this provides an incentive for LNG producers, especially in the US, to grab market share, the US DOE has been slow to issue LNG export licenses.

The chart below shows the wide price differential for Natural Gas between the US, Europe and Asia:-

Nat Gas Price - 2007 - 2014

Source: World Bank and Knoema

For an in-depth analysis of the Nat Gas market you may interest in this paper from the Carnegie Endowment for International Peace – Natural Gas Pricing and its Future: –

http://carnegieendowment.org/files/gas_pricing_europe.pdf

The paper was published in 2010 but it is still prescient, here is an extract from the summary: –

Unlike other internationally traded commodity markets, natural gas has disparate regional benchmark prices. The dominant mechanism for the international gas trade, however, remains oil indexation, which originated in Europe in the 1960s and spread to Asia. A contrasting mechanism based on hub pricing and traded markets developed in the United States and has spread to continental Europe via the UK. Today, Europe is witnessing an unprecedented collision between these two pricing mechanisms and gas industry cultures. According to the International Energy Agency, one of the most essential questions related to global energy supplies and security is whether the traditional link between oil and gas prices will survive.

While Europe is currently the battleground, the implications stretch beyond Europe’s borders because once-isolated regional gas markets are now interconnected through the rising trade in liquefied natural gas. If the spot market model gains the upper hand in Europe, Asia will be the last remaining stronghold of oil indexed pricing, possibly making it unsustainable. Alternatively, if oil indexation re-exerts its predominance, there is the prospect that spot prices in North America will be influenced by this model.

Though the outcomes are far from certain, the stakes are high. Any modifications to existing contractual arrangements will directly impact exporters that depend on gas revenue—including Russia, Algeria, Indonesia, and Malaysia. And these changes will enhance or exacerbate energy security and dictate the sustainability

of future supply. Gas pricing will impact the competitiveness of industry and the potential to achieve environmental targets around the world.

The UK and Norway should benefit from Nat Gas price increases. I doubt the EUR will weaken significantly in this environment since international investment flows will be repatriated if Europe heads into another recession. A higher Nat Gas price will act as a tax on production rather than stoking EZ inflation. There will be stock specific opportunities, both long and short, but I expect the higher Nat Gas price to be positive for European Government bonds. The positive capital flows are likely to be less pronounced for German bunds than for the peripheral markets since the “quest for yield” is still a major factor in European fixed income markets. Lower bond yields will support European stocks unless the “slowdown” in German growth precipitates a serious EZ wide recession.

It is also worth remembering that Russia was elected to the World Trade Organisation in August 2012. Whilst they have far to go in reforming their international trade relations, there is some hope that being a member of the WTO may temper their retaliatory tendencies. This paper from the European Centre for International Political Economy – One Year after Russia’s WTO Accession: Time for Reform goes into more detail about Russia’s prospects: –

http://www.ecipe.org/media/publication_pdfs/ECIPE_bulletin1013vanderMarel__1.pdf

Other geopolitical risks on the horizon

The sudden deterioration in the Ukrainian situation caught many market participants by surprise. The Ukraine, however, is not the largest geopolitical risk in terms of the potential for economic contagion. Putting candidates in order of magnitude is a rather subjective task but here are my top two “flash-points”:-

1.       China and Japan

The territorial dispute over the Senkaku/Diaoyu Islands needs to be seen in the context of the US as global hegemon in retreat and China moving from regional hegemon to challenge the position of the US in the Asia Pacific region. Japan – which relies on the US for military support – being the next largest economy in Asia after China, is more critical to the global economy than Taiwan, South Korea, Vietnam, Malaysia  or the Philippines. All of these countries have regional disputes with China over territory in the South and East China Sea. See map below: –

China SeaTerritorial Disput Map

Sources: Daily Mail and Globe Money Morning staff research NIPR, Google News

2.       Iran and Saudi Arabia

There has been much relief in diplomatic circles since Iran agreed to talks with the US, UK, Germany, France, Russia and China about the permissible scope of their nuclear activities. With a deal in the offing I believe the risk of conflict in the Middle East is higher rather than lower, this Spectator article sums up my cause for concern: –

http://www.spectator.co.uk/features/9122371/armageddon-awaits/

The Middle East is not simply falling apart. It is taking a different shape, along very clear lines — far older ones than those the western powers rudely imposed on the region nearly a century ago. Across the whole continent those borders are in the process of cracking and breaking. But while that happens the region’s two most ambitious centres of power — the house of Saud and the Ayatollahs in Iran — find themselves fighting each other not just for influence but even, perhaps, for survival.

The way in which what is going on in the Middle East has become a religious war has long been obvious. Just take this radio exchange, caught at the ground level earlier this month, between two foreign fighters in Syria, the first from al-Qa’eda’s Islamic State in Iraq and Syria [ISIS], the second from the Free Syrian army [FSA]. ‘You apostate infidels,’ says the first. ‘We’ve declared you to be “apostates”, you heretics. You don’t know Allah or His Prophet, you creature. What kind of Islam do you follow?’ To which the FSA fighter responds, ‘Why did you come here? Go fight Israel, brother.’ Only to be told, ‘Fighting apostates like you people takes precedence over fighting the Jews and the Christians. All imams concur on that.

There has always been the ongoing tension of Bahrain, which is under Saudi domination but which Iran seeks for itself. But then there is the quieter battle for influence in the Gulf states, which, while interventionist at times, quiver before the clashing of these bigger beasts. It was only as Syria fell apart and the regional powers were pulled inexorably into a more open battle, that the cold war between Iran and Saudi found its hot battleground.

There are those who think that the region as a whole may be starting to go through something similar to what Europe went through in the early 17th century during the Thirty Years’ War, when Protestant and Catholic states battled it out. This is a conflict which is not only bigger than al-Qa’eda and similar groups, but far bigger than any of us. It is one which will re-align not only the Middle East, but the religion of Islam.

Saudi officials more recently called for the Iranian leadership to be summoned to the International Criminal Court in The Hague for war crimes. Then, just the month before last, as the P5+1 countries eased sanctions on Iran after arriving at an interim deal in Geneva, Saudi saw its greatest fear — a nuclear Iran — grow more likely. And in the immediate aftermath of the Geneva deal, Saudi sources darkly warned of the country now taking Iranian matters ‘into their own hands’. There are rumours that the Saudis would buy nuclear bombs ‘off the shelf’ from their friends in Pakistan if Iran ever reaches anything like the nuclear threshold.

Here is a map of the Middle East region divided into Shia and Sunni spheres of influence: –

Shia and Sunni Map of the Middle East

Sources: CIA World Factbook; Adherents.com

As at 2010 1.6 bln people 23.4% of the world population was described as Muslim. Here is a world map which shows the potential global nature of this risk. Green = Sunni, Red = Shia and Blue = Ibadi: –

Islam by country 2010

Source: Wikimedia commons

The Council for Foreign Relations take a wider view of the world and pointed out that there are Ten Elections to Watch in 2014: –

http://blogs.cfr.org/lindsay/2013/12/10/ten-elections-to-watch-in-2014/

Beyond this expanded “risk list” one can include the Nuclear Weapons capable (or nearly capable) nations, these are always a source of unexpected risk: –

Map of Nuclear Armed States of the World

Nuclear weapons states

Key

LIGHT BLUE = NPT-designated nuclear weapon states (China, France, Russia, United Kingdom, United States)

RED = Other states with nuclear weapons (India, Pakistan, North Korea)

YELLOW = Other states believed to have nuclear weapons (Israel)

DARK BLUE = NATO nuclear weapons sharing states (Belgium, Germany, Netherlands, Italy, Turkey)

GREEN = States formerly possessing nuclear weapons (Belarus, Kazakhstan, Ukraine, South Africa)

Source:Wikimedia Commons

Conclusion

The current situation in the Ukraine may prove contagious but appears, at this stage, to be of minor economic importance. This situation may change if Russia becomes more belligerent. However, the weakness of Emerging Markets is likely to be more protracted and the risk of further capital repatriation, heightened by this event. The risk to Europe from a Russian Nat Gas embargo is also real and this could threaten the US recovery.

I believe the Ukrainian situation may reduce the likelihood of a rapid increase in tapering by the Fed and increase the prospects for ECB Outright Monetary Transactions. In aggregate that amounts to more QE which should support stocks and higher yielding bonds.

Emerging Markets and disinflation in developed economies

400dpiLogo

Macro Letter – No 5 –14-02-2014
Emerging Markets and disinflation in developed economies

Introduction

Emerging markets have become the focus of attention since the beginning of the year. Many articles have appeared anticipating a repeat of the 1997 Asian crisis but I believe the effects of globalisation and the low levels of inflation in the developed world mean that though a broad crisis might ensue it is more likely that a major crisis will be averted, at least for the present.

Since the second half of 2013 one of the greatest risks to a sustained economic recovery in the developed economies has been the stability of emerging markets. Last year concerns began to emerge with a collapse in the INR, but soon spread to other emerging market currencies. This led a number of commentators to identify the “Fragile Five”; Brazil, India, Indonesia, South Africa, Turkey. The basis for this epithet was: –

1. Twin budget and current account deficits
2. Falling growth
3. Above target inflation
4. Some form of political uncertainty

Further candidates for inclusion based on political factors include: Argentina, Hungary, Thailand, Ukraine and Venezuela – the “Vulnerable Five”.
In this letter I want to look at emerging markets in general. To begin it is worth reviewing world economic growth over the past two decades and forecasts for the next few years. Below is a table of GDP Growth extracted from the IMF World Economic Outlook – October 2013:-

GDP growth              Average                                                                                           Projections
Year                              1995–2004 2005 2006 2007 2008 2009 2010 2011 2012 2013 2014 2018
World                                  3.6         4.7      5.2     5.3      2.7   –0.4  5.2     3.9    3.2     2.9     3.6    4.1
Advanced Economies      2.8         2.8      3.0    2.7      0.1    –3.4  3.0     1.7     1.5     1.2      2.0   2.5
Central/East Europe        4.0         5.9      6.4    5.4      3.2   –3.6  4.6     5.4     1.4     2.3     2.7    3.7
CIS                                       2.9         6.7       8.8   8.9      5.3   –6.4  4.9     4.8     3.4     2.1     3.4    3.7
Developing Asia                7.1          9.5      10.3  11.5     7.3      7.7   9.8     7.8     6.4    6.3     6.5    6.7
Lat Am and Caribbean    2.5          4.7       5.6    5.7      4.2  –1.2    6.0     4.6     2.9    2.7     3.1    3.7
MENA                                 4.6          5.5       6.8   5.9      5.0     3.0   5.5      3.9     4.6    2.1     3.8   4.4
Sub-Saharan Africa          4.5          6.3       6.4   7.1       5.7     2.6   5.6      5.5     4.9    5.0     6.0   5.7

Source: IMF

Perhaps a more useful guide to GDP is to be found in the deflated Real GDP data – again extracted from IMF WEO – October 2013: –

Real GDP data         Average                                                                                          Projections
Year                             1995–2004 2005 2006 2007 2008 2009 2010 2011 2012 2013 2014 2018
Advanced Economies      2.8          2.8      3.0     2.7     0.1    –3.4   3.0     1.7    1.5    1.2     2.0      2.5
Central/East Europe       4.0          5.9      6.4      5.4     3.2    –3.6   4.6     5.4   1.4    2.3    2.7      3.7
CIS                                      2.9           6.7      8.8     8.9     5.3     –6.4  4.9     4.8   3.4    2.1    3.4      3.7
Developing Asia               7.1           9.5     10.3    11.5    7.3        7.7   9.8     7.8   6.4   6.3    6.5      6.7
Lat Am and Caribbean   2.5           4.7      5.6      5.7     4.2    –1.2    6.0     4.6   2.9   2.7    3.1      3.7
MENA*                              4.6          6.0      6.7      5.9     5.0      2.8    5.2     3.9    4.6   2.3    3.6     4.4
Sub-Saharan Africa         4.5          6.3      6.4      7.1      5.7      2.6    5.6     5.5    4.9    5.0    6.0    5.7

Source: IMF

*MENA includes Afghanistan and Pakistan

This analysis suggests that developing Asia will continue to lead the way followed by MENA and the frontier markets of Africa. Whilst this may be useful for tactical asset allocation it tells us little about the size of the economies in question.

To address this issue I’ve ranked the emerging markets from the latest World Bank – GDP data 2012. It is these largest emerging economies that will have the greatest international impact. Here are the EM’s taken from the top 30. As you might expect, the BRIC’s are at the top: –

Gross domestic product 2012

Economy                        Mlns US dollars
2 China                               8,227,103
7 Brazil                               2,252,664
8 Russian Federation      2,014,775
10 India                              1,841,710
14 Mexico                           1,178,126
15 Korea, Rep.*                 1,129,598
16 Indonesia                      878,043
17 Turkey                            789,257
19 Saudi Arabia                 711,050
22 Iran, Islamic Rep.       514,060
26 Argentina                      475,502
28 South Africa                 384,313
29 Venezuela, RB              381,286
30 Colombia                      369,606

Source: World Bank

*It may be argued that South Korea shouldn’t be included since it has emerged.

The complete list is here:-

Click to access GDP.pdf

BRIC Bats

In the table above, the “Fragile Five” are all represented – although only two of the “Vulnerable Five” – with Thailand (31) just outside. Given their prominence however I want to examine the prospects for the largest EM economies – the BRICs:-

• China is a year into its economic rebalancing away from production and towards domestic consumption. This is a slow process; some commentators anticipate it may take as much as a decade to work through. Whilst GDP growth remains robust – IMF forecast real GDP of 7% plus out to 2018 – it is well below the nearly double digit growth of the last decade. As the world’s second largest economy China will set a benchmark for the rest of the developing world. Official statistical data from the PRC is notoriously unreliable so a true picture of the success or failure of economic reform may be difficult to discern. The level of debt, especially in the public sector, and the demographic effects of the “one child” policies of the Mao era, are likely to subdue economic growth for a considerable time.

The following article from Macrobusiness.com.au looks at Chinese Iron Ore port stocks: –

http://www.macrobusiness.com.au/2014/02/daily-iron-ore-price-update-cliffs-edge/

This indicates a continued slowing of the Chinese economy. Whilst Iron Ore port inventories are a rather narrow indicator of expected demand the recent decline in Rebar prices shows that demand from the construction industry remains muted.

• Brazil has been battling high inflation – 5.59% January 2014, down from 6.7% last summer but still above the central bank target of 4.5%. Growth has been slowing since the 2010 rebound and commodity prices have remained under pressure. An election in September 2014 and the opportunity for public protests around the FIFA World Cup add to the uncertainty.

• India has seen its currency under pressure for some time. Ranjan, the new governor of the Reserve Bank of India, has already raised interest rates three times, to 8%, since his election in September 2013. This only takes rates back to their 2012 level. Meanwhile industrial production is lacklustre and the bursting of the housing bubble continues to act as a drag on the economy. Inflation has been running in double digits for the past couple of years and only dropped to 9.13% in January.

• Russia has slightly less inflation concern (6.1% in January) and central bank rates have been held at 5.5% since September 2013. Commodity prices have remained a drag on growth (1.2% in Q3 2013). The current account surplus continues to diminish despite the relative stability of the oil price. Another issue for Russia is their standing on Transparency International’s Corruption Perceptions Index. Russia ranks 127, the lowest of the BRIC countries.

Full 2013 Transparency International CPI results are here:-

http://cpi.transparency.org/cpi2013/results/

EM institutions must remain calm

Perhaps a greater risk for EM countries may be policy mistakes from there own institutions, as this article from the Peterson Institute – Emerging Market Victimhood Narrative – January 31st – suggests: –

http://www.piie.com/publications/opeds/oped.cfm?ResearchID=2561

From Istanbul to Brasilia to Mumbai comes a crescendo of complaints about dollar imperialism. Heads of state and central bank governors allege that the policies of central banks in industrial countries, especially the US Federal Reserve, pursued in self-interest, are wreaking havoc in emerging-market economies. This allegation is mostly unfair. Emerging markets aren’t hapless and undeserved victims; for the most part they are simply reaping what they sowed.

Interest rate increases by EM central banks to combat higher inflation due to currency depreciation poses a significant “contagion” risk. They should take note of the actions of the BoE, who missed its inflation target every month since November 2009. Now inflation is back to target (December 2013) and the UK economy is predicted to be the strongest in Europe this year, see last weeks post: –

Whither the UK – From Tantalus to Sisyphus?

For emerging market officials to blame the Federal Reserve might be populist but it will antagonise international relations. Emerging market central banks and their governments need to concentrate on those internal factors they can influence. International capital outflows can, to some extent, be reversed by raising interest rates precipitously but at what cost to the domestic economy?

Cross-border Capital flows and the “Carry Trade”

Since the Tech Bubble collapse of 2001, and subsequent slashing of interest rates during the mid-2000’s, a significant amount of developed country investment has flowed towards emerging markets. A large reversal occurred in 2009 but since then developed country central banks have cut interest rates aggressively encouraging renewed enthusiasm for EMs. After a steady period in 2012 credit inflows dried up as US bond yields began to rise. Since the second half of 2013 the overall trend has begun to reverse. The fascinating chart below from the World Bank illustrates the critical impact of credit inflows and outflows over the last 22 years: –

EM Private Capital Inflows - source World Bank

Source: World Bank

The recent outflows from emerging markets have benefitted capital account surplus countries; especially the UK – it is a factor underpinning the appreciation of GBP.

These “repatriations”, are likely to continue despite emerging market central banks increasing interest rates to defend their currencies. It is still quite early in the repatriation cycle and expectations are currently dominated by the prospect of further Fed tapering.

EM short term interest rates are rising but as the chart below illustrates 10 yr bond yields have not risen to extreme levels at this stage. The comments are courtesy of Mauldin Economics:-

EM Bond yields - source Mauldin Economics and Bloomberg

Source: Bloomberg and Mauldin Economics

Whilst yields have risen, the situation doesn’t look too dire, especially when compared to EM currencies; chart below again courtesy of Mauldin Economics: –

EM Currencies - source Mauldin Economics and Bloomberg

Source: Bloomberg and Mauldin Economics

The next chart, once more care of Mauldin Economics, shows the relatively stable, although high, inflation rates in some of the larger emerging markets. Several EM central banks have raised interest rates this year and I expect to see investors return to higher yielding bond markets as developed country bond yields fall – a kind of “self-righting” mechanism will see a return of capital inflows. This may take a few months to materialise and, should EM central banks panic, a full-blown crisis could ensue in the meantime. This month the sentiment is fragile, as exemplified last week by both the Russian and Brazilian governments’ cancelling their bond auctions. The point made by Maudlin is the crux of the issue: as developed market rates rise the attraction of the carry trade diminishes. I simply don’t expect developed market bond yields to rise dramatically when disinflationary forces are blowing from the depreciating EM’s.

EM Inflation - source Mauldin Economics and Bloomberg

Source: Bloomberg and Mauldin Economics

In some ways the marginal capital flows which affect currencies, bonds and stocks, are all a form of the classic “Carry Trade”. So what is different about the carry trade since 2008?

As developed world central banks cut interest rates towards the zero bound, so the carry trade, which had traditionally relied upon the JPY (and to a lesser extent the CHF) for funding, became attractive to fund in USD, EUR and even GBP. In the past, interest rate differentials between the major markets had been significant – and therefore attractive to the carry trader. In the new, post 2008 environment, the carry trade destination became more concentrated in less liquid markets such as peripheral European bonds, higher yielding mortgage and corporate bonds and, of course, emerging markets.

This article from Prospect Magazine – Are Emerging Markets a storm in a teacup, or a storm that’s brewing? – 6th February 2014 – picks up on a World Bank report: –

A recent study by the World Bank (Global Economic Prospects, January 2014) estimated that US interest rates, QE and other external factors accounted for 60% of the increase in capital flows to emerging countries between 2009-13, with domestic factors accounting for the remainder.

They go on to point out: –
So next time someone says emerging market currencies are a storm in a tea cup, you can remind them of two things. First, you can point out that slower growth, flawed development models, excessive reliance on credit and foreign capital inflows, and weak institutions constitute a rather different cocktail. Secondly, you can emphasise that raising interest rates to defend your currency doesn’t always work. It might just exacerbate the underlying problem of weak growth, low returns to investment, and political tension, and so spur another bout of capital flight, and so on.

At some point, a buying opportunity for the brave and fleet of foot in emerging markets is as certain as night follows day. But the emerging market growth crisis is still in Act 1 of a rather long play.

http://www.prospectmagazine.co.uk/prospector/are-emerging-markets-a-storm-in-a-teacup-or-a-storm-thats-brewing/#.UvtJBJRFDMw

Another look at the currency and bond charts above suggests that whilst the currencies are leading the way, bonds are still broadly within their recent ranges. Many commentators anticipate higher EM bond yields in the wake of currency weakness, this remains a risk near-term. By contrast, EM equities, as measured by the MSCI EM Index, look range-bound. They failed to follow the major markets higher last year. Looking ahead, trade surplus EM countries will benefit from a weaker currency as it makes their export sector more competitive: –

MSCI Emerging Market ETF - 5 yr - source yahoo finance

Source: Yahoo Finance

Back in November 2013 Anders Aslund wrote, what may turn out to be, a prescient article for the Peterson Institute – Why Growth in Emerging Economies Is Likely to Fall, here are some highlights: –

The high growth rate of the emerging economies has become widely accepted as the new normal.
A new conventional wisdom has arisen, that economic convergence between the developed and the
emerging economies is all but inevitable and that China will soon overtake the United States economically and rule the world. Books such as Eclipse: Living in the Shadow of China’s Economic Dominance (Subramanian 2011) and When China Rules the World (Martin 2012) have become staples. However, the two preceding decades, 1981–99, off er a sharp contrast. Emerging economies grew only at an average of 3.6 percent a year during those decades, while the US economy grew at 3.4 percent a year. Considering that the initial US economic level was so much higher, no economic convergence occurred between the United States and the emerging economies during those two decades.

… The hypothesis of this paper is that the emerging market growth from 2000 to 2012 was atypically high and we might be back in a situation that is more reminiscent of the early 1980s. The growth of the last 12 years was neither sustainable nor likely to last. Several cycles that are much longer than the business cycle exist. One is the credit cycle, which Claudio Borio (2012) assesses at 15 to 20 years.

Another is the commodity cycle, which last peaked in 1980 and might last 30 to 40 years (Jacks 2013, Hendrix and Noland forthcoming). A third is the investment or Simon Kuznets cycle, which appears related to both the credit and commodity cycles (Kuznets 1958). A fourth cycle is the reform cycle, which might also coincide with the Kondratieff cycle (Rostow 1978).

The purpose of this paper is by no means to prove the existence of these cycles and even less to
discuss their length. My argument is much more limited: A large number of emerging economies seem to be close to a turning point in all these four cycles. The credit, commodity, and investment cycles have peaked out, while reforms on the contrary have tended to occur during crises and need to be restarted. It usually takes a decade or two to embark on, design, and implement new reforms. I offer seven arguments why high emerging-economy growth is over:
1. One of the biggest credit booms of all time has peaked out. Extremely low interest rates cannot
continue forever. A normalization is inevitable. Many emerging economies are financially vulnerable with large fiscal deficits, public debts, current account deficits, and somewhat high inflation.
2. A great commodity boom has peaked out, as high prices and low growth depress demand, while the high prices have stimulated a great supply shock.
3. The investment or Simon Kuznets cycle has peaked out, as the very high Chinese investment ratio is bound to fall and real interest rates to rise.
4. Because of many years of high economic growth, the catch-up potential of emerging economies has been reduced and growth rates are set to fall ceteris paribus.
5. Many emerging economies carried out impressive reforms from 1980 to 2000, but much fewer
reforms have taken place from 2000 to 2012. T e remaining governance potential for growth has
been reduced. Characteristically, reforms evolve in cycles that are usually initiated by a serious crisis, and after 12 good years complacency has set in in the emerging economies.
6. Worse, the governments of many emerging economies are drawing the wrong conclusion from
developments during the Great Recession. Many think that state capitalism and industrial policy have proven superior to free markets and private enterprise. Therefore, they feel no need to improve their economic policies but are inclined to aggravate them further.
7. Finally, the emerging economies have benefited greatly from the ever more open markets of the
developed countries, while not fully reciprocating. The West is likely to proceed with selective,
regional trade agreements rather than with general liberalization.

Here is the full article: –

Click to access wp13-10.pdf

Countering this well argued case for an EM slowdown is a fascinating paper from the BIS – Asia’s decoupling: fact, forecast or fiction? December 2013, here’s the abstract:-

Standard measures of real economic co-movement between Asia-Pacific economies and those elsewhere had been observed to follow a downward trend, leading some commentators to suggest that the region was decoupling. However, this process reversed in response to the International Financial Crisis, and co-movement increased to historically high levels for some economies. We examine co-movement patterns and show that these are very sensitive to changes in macroeconomic volatility over time. Controlling for this, however, co-movement is closely linked to underlying trade and financial integration. If international links continue to strengthen in future, co-movement will strengthen in tandem. Decoupling is more a fiction than a fact or a forecast.

Click to access work438.pdf

Developed markets and globalisation
If the world economy is becoming more coupled due to globalisation, then the monetary conditions of the major economies is critical to understanding how the nascent emerging market crisis might play out.

As a broad generalisation, emerging markets rely on Trade Exports and International Capital Investment, so the robustness of their trading and finance partners is a critical but often overlooked aspect of any analysis. I am indebted to Pi Economics for the chart below which tracks broad money growth in US, EU, UK and Japan.

Weighted Average Broad Money Growth - US EU Japan UK - source Pi Economics

Source: Pi Economics

Given that broad money growth of 4 – 5% is consistent with inflation of around 2% – a statement with which many would disagree since it ignores velocity, liquidity preference and a number of other factors – I would suggest that, as long as the Federal Reserve, ECB, BoE, BoJ etc. maintain inflation targets, further accommodative policies are likely to prevail.

For more reading on the link between broad money growth and inflation the ECB – Long Run Evidence on Money Growth and Inflation – WP 1027 – March 2009 may be informative, there’s plenty more from other central banks too.

Click to access ecbwp1027.pdf

With falling money supply growth disinflation is an increased risk. George Selgin – Less than zero –is an excellent introduction to the heterodox idea that falling prices are a good thing. This remains at odds with the inflation targeting mandates of the major central banks. Here is the IEA link:-

Click to access upldbook98pdf.pdf

Many EM countries already have some form of price, capital or currency controls in place. As international inbound capital flows have slackened or reversed many of these controls have been tightened. As those countries which can, weaken their currencies, their export competitiveness will improve. For the developed countries import prices should decline. This will temper domestic inflation, making higher interest rates unnecessary. Any domestic slowdown in economic activity in developed countries will then prompt an increase in QE.

Since the beginning of 2014 US, UK and German bond markets have rallied. Traditionally, lower bond yields, except during times of crises, are positively correlated to higher equity prices. With developed markets exhibiting anaemic growth, a reasonable proportion of this additional liquidity is bound to seek out higher yielding bonds and growth stocks. This will lead to renewed capital flows into EM equities.

Commodity prices remain subdued, see my post from last year: –

Commodity super-cycles in a fiat currency world

Many of the largest emerging economies are still slowing. More robust growth in the UK and USA looks like the exception rather than the rule for the developed world and money supply growth in the major economies is disappointingly weak. None of this suggests that the main catalyst of asset price appreciation (QE) will disappear in the next five years. If 60% of the capital flows into emerging markets are the result of QE, and the Federal Reserve are still buying $65bln per month, whilst the BoJ are attempting a similar degree of monetary accommodation, I can’t be bearish on EM equities.
It has been argued that the major central banks are mandated to focus on their domestic economies.

Commentators point to the Latin American crisis of the 1980’s or the Asian crisis of the late 1990’s as examples of how the rest of the world will be left to fend for themselves, however, I believe the impact of globalisation is under estimated. When the effects of globalisation are combined with benign inflationary forces in the developed world, together with central bank inflation targets, disinflation will lead to more QE. This will lead to further asset price inflation. We will finally reach a denouement where the mal-investments associated with these ridiculous policies are laid bare, but not until the credibility of central banks has been undermined.

We may yet have a full-blown emerging market crisis but I think it is less likely due to the increased interconnectedness of the world’s economies. If it does happen it will stem from a loss of confidence in EM institutions. The credit inflows pre-2008 have not returned. Regulatory capital increases have undermined the lending capability of banks around the world. There has been less “hot money” flowing to EM markets since the Great Recession and therefore I believe EM markets will keep their nerve.

Whilst their arguments are somewhat different from my own, the Economist – Don’t Panic – 1st February 2014, ends with a salutary warning and a longer-term expectation: –

If enough investors get nervous, money will flood out, currencies will fall and a gradual tightening could become a sudden rout. But there is no reason for American interest rates to rise fast, and no reason why emerging economies cannot adapt to a world in which rates gradually climb.
http://www.economist.com/news/leaders/21595454-there-no-reason-broad-emerging-market-crisis-nervous-investors-could-yet-cause?

Conclusion

A major emerging market crisis is still a real risk, however, I believe the disinflationary effect of their currency depreciations, on the major developed economies will be pronounced. The developed world central banks will not raise interest rates in this environment. This will provide significant liquidity support to emerging markets – especially to equities and those bond markets where the government debt to GDP ratio is not too high, nor the current account balance in substantial deficit. As always, each emerging market should be analysed on its own merits – some deserve the treatment they are receiving at the hands of “Mr Market” others may be damaged by contagion. In general, however, I don’t expect a rout of the magnitude of 1997 this time around. Emerging market equities are a “hold”. They may break lower, in which case reduce, but don’t exit the market just yet, another round of developed world QE may appear, like a knight in shining armour, sooner than you think.

Whither the UK – From Tantalus to Sisyphus?

400dpiLogo.

Macro Letter – No 4 – 31-01-2014

Whither the UK – From Tantalus to Sisyphus?

It has been a long time since I have reviewed the UK economy and the prospects for our financial markets but the recent spate of positive economic news deserves investigation.

Sterling

To begin I have enclosed a chart of GBP/USD. You will notice that despite a significant strengthening of GBP, in line with the improving economic data, we still have a distance to travel before returning to the pre-Northern Rock range. The near-term trend looks clear but a comprehensive break above 1.70 is required for confirmation.


GBP-USD FX 10yr - source fxtop.com

GBP/USD FX 10yr – source fxtop.com


To understand why GP/USD may return to its pre-crisis range one needs to consider why it has been languishing in purgatory since 2008/2009. Partly this is due to the size of the UK financial services sector, where regulatory headwinds remain fierce, and partly the direction of long-term interest rates globally. Here is a chart of 10 year Gilt yields:-

10yr Gilt yield - 10yr Monthly - source investorsintelliegence.com Stockcube Research Ltd.

10yr Gilt yield – 10yr Monthly – source investorsintelligence.com Stockcube Research Ltd

Of course short and long term interest rates have declined in most countries since the Great Recession but traditionally GBP was a “carry-currency” due to our structurally higher inflation rates. The “sea-change” in interest rate differentials has seen the “carry-trader” depart this sceptre isle. There are a number of other factors including the arrival of a coalition government in 2010, a significant decline in the UK housing market and a collapse in the UK export sector, despite the precipitous decline of sterling against its trading partners. Financial services went out of fashion and North Sea oil and gas production took an unfortunate nose-dived simultaneously.

The chart below showing the GBP Trade-Weighted Index is from Ashraf Laidi . It is a couple of years old but it’s still valid, the annotation is his:-

GBP Trade Weighted Index - 1990 - 2013 - source AshrafLaidi 

Source – AshrafLaidi.com

Gilts

Looking  at the chart of 10 year Gilt yields above, you will notice that yields bottomed in mid-2012 whilst GBP/USD took until 2013 to begin its recovery. The external factor driving Gilt yields to their nadir was the Eurozone crisis, however, since Draghi’s “whatever it takes” speech (July 26th 2012) Gilt yields have begun to normalise in a similar manner to the US. Meanwhile Eurozone rates have converged lower and German 10 year Bund rates have remained relatively low.

Looking ahead it is not unreasonable to expect Gilt yields to go higher, but, with GBP rising and inflation falling this is likely to be a gradual process; added to which the Bank of England (BoE) have been softening their tone on prospective interest rate increases.

Here’s a quote from MPC member Ben Broadbent speaking at the LSE on 17th January: –

The final and more general point is to caution against inferring too much about future growth from its current composition. Of course there’s a risk the recovery could falter. But, if it does, it will probably be because of more fundamental problems – a failure of productivity to respond to stronger demand, for example, or continuing stagnation in the euro area – not any imbalance in expenditure or income per se. These are outcomes, not determinants, of the economic cycle. As we shall see, they are poor predictors of future growth.

http://www.bankofengland.co.uk/publications/Pages/news/2014/024.aspx

On 23rd January Ian McCafferty reiterated the MPC’s position on rates: –

…the MPC sees no immediate need to increase interest rates, even if unemployment reaches 7% in the near future.

McCafferty goes on to discuss capital expenditure which, along with productivity growth, has been weak during the early stages of the recovery.

http://www.bankofengland.co.uk/publications/Pages/news/2014/027.aspx

Also on 23rd January MPC memberPaul Fisher, after explaining why the BoE allowed inflation to remain above target for so long, went on to opine: –

We are very conscious that the headwinds have not gone away: much of Europe and some other parts of the world continue to struggle for sustained growth; fiscal consolidation in the UK (and elsewhere) is likely to continue for a while to come; and the financial sector still needs some rebuilding. Indeed, the official production and construction data released earlier this month were rather disappointing, reminding us that strong growth from here on is by no means guaranteed.

http://www.bankofengland.co.uk/publications/Pages/news/2014/028.aspx

Fisher goes on to explain that unemployment, and the composition of employment, are key metrics in their thought process. The whole speech is also a fascinating insight into the MPCs approach and their ideas on forward guidance.

BoE Governor – Mark Carney addressed the CBI at Davos on 24th January: he discussed the UK economy and the need to reach “escape velocity”: –

After the Great Moderation and the Great Recession, there are several reasons why it will be years before any superlatives are attached to this recovery.

First, for all the talk of austerity and deleveraging, the aggregate debt burdens of advanced economies have actually increased; with their total non-financial sector debt rising by 25% relative to GDP since 2007. Balance sheet repair in the public and private sectors will exert a persistent drag on major economies for some time.

Second, the need to rebalance demand from deficit to surplus countries endures. Given the adjustment pressures on the former, without progress on rebalancing, robust and sustainable global growth will remain an aspiration.

Third, confidence, while improved, remains subdued. Recognising that the end isn’t nigh is far from marking the normalisation of business and consumer sentiment. Given past shocks and modest prospects, business investment in particular remains hesitant across the advanced world. On balance, corporations remain more focused on reducing operating expenditures than increasing capital expenditures.

… Nevertheless, it appears that the recovery will need to be sustained for a period before productivity gains can resume in earnest. The latest data show that more than a quarter of a million jobs were created in a three-month period – the biggest increase since records began in 1971. As a result, unemployment seems to be falling at a pace that will reach our 7% threshold materially earlier than we had expected.

Crucially, unemployment remains above the level that is likely to be consistent with maintaining inflation at the target in the medium term. It is not just that nearly three quarters of a million more people are out of work than before the crisis; another three quarters of a million more people are involuntarily working part time.

The effect of this slack in the labour market is evident in wage inflation, which is at around 1% so that, even with weak productivity, unit labour cost growth remains below 2%.

http://www.bankofengland.co.uk/publications/Pages/speeches/2014/705.aspx

All of these comments concerning lack of productivity growth, elevated levels of unemployment, growth of part-time employment, lack of capital expenditure and international headwinds from the Eurozone, suggest that interest rates will stay low and the BoE will risk above target inflation to insure the economic recovery broadens and deepens. In this environment I see Gilts remaining in a relatively narrow range, even if inflation ticks higher once more.

Politics

On 29th January, Mark Carney spoke in Edinburgh on The economics of currency unions. The full speech is here: –

http://www.bankofengland.co.uk/publications/Documents/speeches/2014/speech706.pdf

He attempted to be deliberately non-political – to judge by the press comment afterwards he failed – but it is a timely reminder that Scotland will vote on whether they remain in the Union on 18th September. The uncertainty surrounding the possible break-up of the Union and one what economic terms is another factor which will temper a broader based recovery.

Other political clouds on the horizon include the European Parliament elections (22nd to 25th May) where nationalist parties are expected to gain significant ground.

Equities

The FTSE100 has performed strongly since the beginning of 2013, in line with other developed country stock markets. The large dose of QE delivered by the BoE has underpinned this trend, but, now that the economy has regained some upward momentum, many commentators are becoming doubtful about the prospects for UK stocks – after all, lower interest rates are one of the most powerful drivers of equity market performance.

Firstly, I believe UK-centric stock momentum is increasing, but a number of external factors will be supportive of the UK equity market: –

  1. China has announced a rebalancing of their economy towards domestic consumption, even if this is at the expense of headline GDP growth. This makes inward foreign investment into China less attractive – I expect capital to flow back to UK and USA.
  2. Japan is attempting to deliver economic growth through what PM Abe has dubbed the “Three Arrows” policy, this has already seen a significant decline in the JPY and a new “quasi-carry trade” is being driven but expectation of relative government spending. The US has begun to taper (another $10bln just this week) and the UK might follow suit at some point this year, but Japan will continue with QE.
  3. Emerging markets have already started to react to the changed policy of the Federal Reserve: India, beginning last year, Argentina, South Africa and Turkey, have seen their currencies depreciate and respond with higher interest rates since the start of the year. Emerging market bonds have, needless the say, fallen sharply, prompting international investors to liquidate some of their investments. The reversal of more than a decade of Capital flows to emerging markets will support developed country currencies, especially those, like the UK, with Capital account surpluses.

Secondly, UK Exports have remained resilient despite the strengthening of sterling.

UK Exports - 10 yr - source tradingeconomics and ONS

Source – tradingeconomics.com

I have some caveats concerning UK equities however; banking and financial services firms are still under pressure due to regulatory change – a new report from United Nations Conference on Trade and Development (UNCAD) shows the UK falling to second place behind the USA; down more than 20% from its peak only seven years ago. The European Commission has just announced plans to stop all proprietary trading by Banks by 2017 – whilst this is likely to be challenged by UK, France and Germany it will lead to the postponement of any expansion plans in this area.  Another sector which is under pressure is mining or commodity firms which are still suffering from the downturn in prices in 2013 – this tallies with my short-term concerns about emerging markets.

UK House Prices

A number of commentators have suggested that the recent strength of the UK economy has been largely driven by increased debt, especially mortgages. Government schemes such as “funding for lending” actively encouraged UK banks to lend more aggressively despite their balance sheet constraints.

MPC member David Mills, in a speech to the Dallas Federal Reserve, discussed housing last November:-

That problem with using monetary policy to stabilise the housing market would be acute if housing markets were overheating when the wider economy was not and consumer price inflation was low even though house price inflation was high.

…High leverage is at the heart of problems in housing market. Monetary policy and macro prudential policy can influence leverage. But more fundamentally, use of outside equity might be a way of permanently bringing down reliance upon debt financing.

http://www.bankofengland.co.uk/publications/Pages/news/2013/132.aspx

In other words the BoE is unlikely to be concerned about house price inflation and will use macroprudential measures rather than interest rates to stem its rise should it occur in isolation. This is clearly good for property but, in anticipation of the “Macroprudential Stick” other asset classes, such as equities, may benefit by association.

The housing market is finally recovering from the bottom up as the following chart makes clear: –

First Time Buyers as percentage of home loans - source Council for Mortgage Lenders

Source – Council for Mortgage Lenders

First time buyers have returned, perhaps because banks are more amenable about loan to value ratios but also because real house prices are well off their highs: –

 Real House Prices since 1975 - source Nationwide Building Society

Real House Prices since 1975 – source Nationwide Building Society

House price momentum appears to have turned higher once more – this chart, from MarketOracle.co.uk, uses data to November 2013:-

UK house prices and annual momentumn-Dec-2013 - source Market Oracle.com and Halifax

Source – MarketOracle.co.uk and Halifax

The December 2013 report from the Land Registry, published on 29th January, shows continued improvement: –

http://www.landregistry.gov.uk/__data/assets/pdf_file/0020/71192/HPIReport20140122.pdf

Independent forecasts for UK property are strongly positive, here is a recent sampling:-

CBRE 17% Rise by 2018 Commercial property consultants

OBR 20% Rise by end of 2018

Knight Frank24% rise by end of 2018 – Retail property specialists

Savills25% rise by end of 2018 – Retail property specialists

Why so strong? Because interest rates are low and therefore housing is relatively affordable. Here is one of my favourite measures of housing affordability from Moneystepper.com:-

UK mortgage to income ratio - source moneystepper.com

UK Mortgage payment to income ratio – source Moneystepper.com

The author uses the Nationwide House Price Index, the BoE base rate plus 2% and the ONS after-tax income data.

For a more detailed investigation of the UK property market here is their post from November 2013, it’s the second of three articles:-

http://moneystepper.com/financial-planning/housing-bubble-uk-2/

Why Tantalus to Sisyphus?

Almost everything I’ve written so far has been positive for the UK economy and neutral or positive for UK markets. After unprecedented actions by the BoE, the “Tantalus Phase” appears to be over; growth that was just out of reach is now within our grasp, however, ahead of us lies the “Sisyphus Phase” where we have to pay the piper.

To begin with I want to look at money supply growth. Here is the Ratio of M4 to M0 from BoE data: –

Ratio M4 to M0 - source Bank of England

Ratio of M4 to M0 – source Bank of England – John Phelan

An excellent article by John Phelan written for the Cobden Centre analyses this development in more detail: –

http://www.cobdencentre.org/2014/01/britains-inflationary-outlook

Since March 2009 Britain’s monetary base, also known as narrow money or M0, has increased by 321%. We can see that the majority of this is in the form of increased bank reserves, up 642% since March 2009.

This is just what we’d expect to see following the Bank of England’s Quantitative Easing, where the Bank creates new money and uses it to purchase bonds from banks – that new money becomes bank reserves. Those banks have sat on that money (not using it as a basis for new credit creation and feeding into M4) which is why, while narrow (M0) money has exploded, broad (M4) money has barely budged, increasing by just 7.4% since March 2009.

This relative restraint in M4 growth explains the relative restraint in inflation. There is no great mystery as to why banks which have just seen their assets tank and ravage their balance sheets should want to hold more reserves. The key question is what happens next.

A paper published in December 2013 by European Commission – The flow of credit in the UK economy and the availability of financing to the corporate sector – looks in more detail at the problem of the transmission of credit:-

http://ec.europa.eu/economy_finance/publications/economic_paper/2013/pdf/ecp509_en.pdf

They conclude on an optimistic note: –

The flow of credit in the UK economy may be close to turning a corner in connection with recent improvements in the macroeconomic outturns and outlook, and as banks finish adapting to a new regulatory environment. Improving access to finance for firms and SMEs is set to remain a crucial element for driving the desirable rebalancing of the UK economy, fomenting investment and fostering the reallocation of resources to the most productive sectors of the economy throughout the on-going recovery.

The BoE – Corporate Credit Conditions Survey – Q4 2013 – released earlier this month, also suggests this process is starting to happen:-

Overall credit availability to the corporate sector was reported to have increased significantly in 2013 Q4; lenders have now reported an increase in availability for five consecutive quarters. Lenders cited market share objectives, competition from capital markets and an improvement in the economic outlook as factors that had contributed significantly to the increase in availability. All these factors were expected to contribute significantly to availability in 2014 Q1.

http://www.bankofengland.co.uk/publications/Documents/other/monetary/ccs/creditconditionssurvey140108.pdf

Against this back-drop of improving conditions, however, it is important to realise that the combination of UK public and private sector debt is the second largest of any developed country on the planet relative to GDP – only Japan carries a greater burden. Academic research has shown that when the ratio of debt to GDP exceeds 260% to 275% this tends to act as a drag on economic growth.

The chart below is from 2012 but the situation has not improved.

 Total Debt to GDP ratios - source DailyMail

Total Debt to GDP – source DailyMail – January 2012

UK Household debt is now at a record £1.43trln, although, it has fallen from 167% of income to 140% since 2008.

At some point in the future we will have a “reckoning” – probably when broad-based inflation begins to rise once more. Interest rates will rise dramatically to control credit growth. What the catalyst will be is difficult to say – a breakup of the Eurozone could lead to a collapse of GBP, the next major leg of a commodity super-cycle turbo-charged by the collapse of the Saudi regime – it’s best not to speculate, but, perhaps the longer term factor most likely to re-ignite the inflationary potential of the “great debasement” is demographic.

As the “Baby-boomers” finish retiring and downsizing the next leg of the demographic cycle will begin, with increased spending and consumption. When these “new-boomers” eclipse the “old-boomers” inflation will regain its power to decimate the value of money whilst at the same time asset prices will collapse under a deluge of foreclosures and debt default. The Sisyphian task will be to reduce the debt against the rising tide of servicing costs. But when will the next “Baby Boom” arrive?

Here is a fascinating chart from the ONS:-

UK Baby boom - source ONS

UK Baby boom – source Office of National Statistics

According to ONS data, UK population growth to mid-2011 was the highest in 40 years. They predict that, should this trend continue, the UK will have the largest population of any country in Europe by 2050. Recent CML data shows the average age of first time house buyers to be 29/30 years. I therefore anticipate a “mini-baby boom” effect kicking in between 2015 and 2020, followed by a 10 year decline. From 2030 this pattern will reverse; by 2040 the next significant inflation wave will be in full swing.

This weekCharles Goodhart, speaking at the LSE predicted that “The Next Crisis” – which was the title of his speech – will occur around 2025/2026. Here’s the podcast, he starts his argument around 10 minutes in and make the case for 17 year cycles. Hence 2025/26 will see the next UK crisis which, he believes, will be more severe than the recent downturn due to a greater concentration on lending to the property sector, exacerbated by the regulatory curtailment of investment banking activity in favour of more traditional bank lending: –

http://www.lse.ac.uk/newsAndMedia/videoAndAudio/channels/publicLecturesAndEvents/player.aspx?id=2219

My expectation is that during the remainder of this decade demographic forces will be somewhat supportive of inflation but attempts to deleverage UK debt after 2020 will have more deflationary consequences.

Conclusion

Sterling looks well placed to move back into its pre-crisis range. Gilts are caught between inflationary and deflationary forces and should remain range-bound. UK Equities are likely to benefit from inward capital flows and UK property looks better than ever – barring a significant change in UK planning laws, this is my preferred UK asset class for 2014, and probably beyond.


European Markets and Unification

400dpiLogo.

.

.

Macro Letter – No 3 – 17 -01-2014

European Markets and Unification

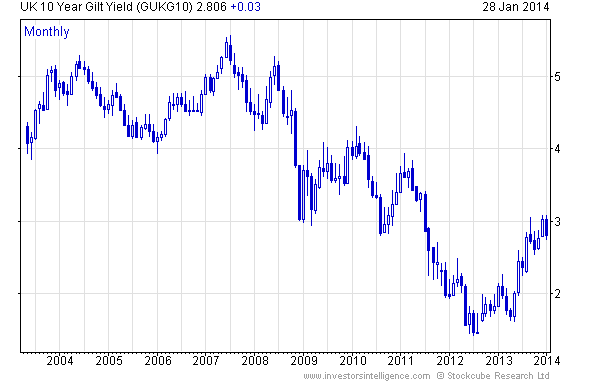
During 2013 developed market equities were the top performing major asset class. The US and UK had justification for rising since the effects of quantitative easing appear to have stimulated some economic activity. Europe, however, has less reason for strength since ECB policies have been less accommodative. The performance of the German mid-cap index aside, European equity market performance in 2013 was largely due to receding fears of the break-up of European currency union. This has been a major contributor to the decline in peripheral bond yields as the chart below shows.

European Bond Yields - 2005 - 2014 - Bloomberg.

.

.

Source: Bloomberg

Banking Union and the ECB

In 2014 the focus will be on deepening unification, commencing with a European Banking Union. Der Spiegel reports: –

Not Fit for the Next Crisis: Europe’s Brittle Banking Union – 19th December 2013

http://www.spiegel.de/international/business/weak-eu-banking-union-could-have-dangerous-side-effects-a-940065.html

When German Finance Minister Wolfgang Schäuble, a trained lawyer, announced an agreement on Wednesday night in Brussels on the long negotiated EU banking union, observers might have been left thinking that he is precisely this type of lawyer.

On paper, Schäuble and his negotiators are right about very many points. They succeeded in ensuring that in 2016, the Single Resolution Mechanism will go into effect alongside the European Union banking supervisory authority. The provision will mean that failing banks inside the euro zone can be liquidated in the future without requiring German taxpayers to cover the costs of mountains of debt built up by Italian or Spanish institutes.

They also backed the European Commission, which wanted to become the top decision-maker when it comes to liquidating banks. The Commission will now be allowed to make formal decisions, but only in close coordination with national ministers from the member states.

But it goes even farther. Negotiators from Berlin have also created an intergovernmental treaty, to be negotiated by the start of 2014, that they believe will protect Germany from any challenges at its Constitutional Court that might arise out of the banking union.

They also established a very strict “liability cascade” that will require bank shareholders, bond holders and depositors with assets of over €100,000 ($137,000) to cover the costs of a bank’s liquidation before any other aid kicks in. The banks are also required to pay around €55 billion into an emergency fund over the next 10 years. Until that fund has been filled, in addition to national safeguards, the permanent euro bailout fund, the European Stability Mechanism, will also be available for aid. However, any funds would have to be borrowed by a national government on behalf of banks, and that country would also be liable for the loan. This provision is expected to be in place at least until 2026.

The government in Berlin put a strong emphasis on preventing the ESM, with its billions in funding, from being used to recapitalize debt-ridden European banks. Schäuble was alone with this position during negotiations, completely isolating himself from the other 16 finance ministers from euro-zone countries. Brussels insiders report that it was “extremely unusual because normally at least a few countries share Germany’s position.”

The article goes on to highlight some of the weaknesses with this agreement: –

  1. 1.       It’s too complex – The Financial Times stated, “In total, the process could involve nine committees and up to 143 votes cast.”
  2. It’s underfunded – The Single Resolution Mechanism, at Euro 55bln by 2026, is a drop in the ocean.
  3. It’s primarily a domestic affair, the union will be subject to national borders
  4. It will probably take at least five years to establish joint European liability.

Bruegel – Ending uncertainty: recapitalisation under European Central Bank Supervision – takes up the subject:-

http://www.bruegel.org/publications/publication-detail/publication/806-ending-uncertainty-recapitalisation-under-european-central-bank-supervision/

• Estimates of the recapitalisation needs of the euro-area banking system vary between €50 and €600 billion. The range shows the considerable uncertainty about the quality of banks’ balance sheets and about the parameters of the forthcoming European Central Bank stress tests, including the treatment of sovereign debt and systemic risk. Uncertainty also prevails about the rules and discretion that will apply to bank recapitalisation, bank restructuring and bank resolution in 2014 and beyond.

• The ECB should communicate the relevant parameters of its exercise early and in detail to give time to the private sector to find solutions. The ECB should establish itself as a tough supervisor and force non-viable banks into restructuring. This could lead to short-term financial volatility, but it should be weighed against the cost of a durably weak banking system and the credibility risk to the ECB. The ECB may need to provide large amounts of liquidity to the financial system.

• Governments should support the ECB, accept cross-border bank mergers and substantial creditor involvement under clear bail-in rules and should be prepared to recapitalise banks. Governments should agree on the eventual creation of a single resolution mechanism with efficient and fast decision-making procedures, and which can exercise discretion where necessary. A resolution fund, even when fully built-up, needs to have a common fiscal backstop to be credible.

The initial Asset Quality Review (AQR) of European Banks carried out in 2011 by the European Banking Authority proved to be a political embarrassment since almost every bank was found to be in relatively rude financial health: shortly before bailouts were required.

Breaking Views – Still time to undo EU bank stress test fiasco – November 2011 – sums up the problems with the previous stress tests eloquently: –

http://www.breakingviews.com/still-time-to-undo-eu-bank-test-fiasco/1616988.article

The test, which was blessed by last month’s ill-fated European summit, had two problems. First, it wasn’t stringent enough: the European Banking Authority concluded that Europe’s lenders needed an additional 106 billion euros, when the International Monetary Fund thought about twice as much was needed. The test has done little to restore confidence in the blighted sector. Banks are still unable to issue long-term unsecured debt, and have been increasingly thrown back on short-term support from the European Central Bank.

Second, the test encouraged deleveraging by expressing the capital requirement as a ratio and giving lenders eight months to get there. Given depressed share prices, many banks are anxious to avoid issuing equity. Instead they are trying to boost capital ratios by shrinking their balance sheets. This will almost certainly have the unfortunate side-effect of further suffocating the European economy, which is already on the edge of recession.

The current iteration of the AQR will, undoubtedly, have more “teeth” but these are shark infested waters where an ECB “health warning” might precipitate an ugly banking crisis.

The Peterson Institute – The European Central Banks Big Moment – December 2013 –  elaborates:-

http://www.piie.com/publications/opeds/oped.cfm?ResearchID=2527

Europe’s banking union project has had many doubters since it started to be widely discussed in the spring of 2012. What is not in doubt, however, is its transformative nature. In June 2012, EU leaders chose—in a galloping hurry, as usual—to move towards the centralization of bank supervision across euro area countries, with this authority entrusted to the European Central Bank (ECB). The consequences have only gradually become apparent to most and represent both an opportunity and a risk.

The opportunity is to reestablish trust in European banks, reboot the pan-European interbank market, end dysfunctional credit allocation, and start reversing the vicious circle between bank and sovereign credit. In an optimistic scenario, the ECB’s 12-month process of “comprehensive assessment,” including an asset quality review (AQR) and stress tests of about 130 credit institutions covering 85 percent of the euro area’s banking assets, will trigger the triage, recapitalization, and restructuring that history suggests is a prerequisite for systemic crisis resolution.

The risk is that, if the assessment fails to be consistent and rigorous, the ECB may find its reputation so damaged that the credibility of its monetary policy—and the perception of Europe’s ability to get anything done—could be affected. After all, this exercise is unprecedented in scale and scope, which means the ECB has little prior experience. At the same time, the political fallout is potentially poisonous to most of the states concerned.

Thus, much is at stake in the balance sheet review, and the scene is set for an escalating confrontation between the ECB and member states in the months ahead. The ECB has pointedly made clear that it will form an independent judgment on the capital strength of the banks examined, without necessarily following the views of national supervisors.

A successful AQR and establishment of the Single Supervisory Mechanism (SSM)—EU jargon for the handover of supervisory authority to the ECB—would have structural consequences. Europe’s national and local governments often use their leverage over the publicly-regulated banking industry for industrial policy purposes or to facilitate their own financing, a dynamic known to economists as financial repression.

Bruegel – Supervisory transparency in the European banking union – January 2014  – looks, in more detail, at the issues surrounding European bank regulation by the  ECB, they acknowledge the need for greater transparency and highlight the dangers of a half-baked approach to a banking union: –

http://www.bruegel.org/publications/publication-detail/publication/807-supervisory-transparency-in-the-european-banking-union/

• Bank supervisors should provide publicly accessible, timely and consistent data on the banks under their jurisdiction. Such transparency increases democratic accountability and leads to greater market efficiency.

• There is greater supervisory transparency in the United States compared to the member states of the European Union. The US supervisors publish data quarterly and update fairly detailed information on bank balance sheets within a week. By contrast, based on an attempt to locate similar data in every EU country, in only 11 member states is this data at least partially available from supervisors, and in no member state is the level of transparency as high as in the US.

• Current and planned European Union requirements on bank transparency are either insufficient or could be easily sidestepped by supervisors. A banking union in Europe needs to include requirements for greater supervisory transparency.

I always find Bruegel comments useful , not only in terms of what should be done to move the “European Project” forward, but also as a guide to what the institutional response is likely to be should an EU proposal fail to be adopted. They conclude: –

Finding agreement on an EU legal change that requires the ECB and member-state supervisors to open their books to greater scrutiny will surely be a difficult task given the current diversity of practices and interests – eg banks, national supervisors – that benefit from this diversity.

But greater supervisory transparency will facilitate more efficient distribution of capital and increase market discipline. It will increase the legitimacy of actions that the regulator takes against banks. The European Union receives justified flak that there is a great distance between European citizens and the institutions that make decisions on their behalf. There is real suspicion of the financial sector and distrust that public money goes only to help out political friends. Transparency in terms of the data the supervisors themselves use to make decisions would allow the public, and more realistically the various interest groups one finds in civil society, to judge whether regulators did choose actions consistent with protecting the public interest. Such ‘fire alarms’ therefore represent one small step towards addressing the democratic deficit that most citizens think exists in Europe.

If such transparency is not possible, for purposes of increasing ‘output legitimacy’ more work should be done to strengthen the role of parliaments. For the European Parliament, the autumn 2013 interinstitutional agreement with the European Central Bank represents a good start. Under all current proposals, national regulators will continue to play an important role especially for any bank resolution. As discussed earlier, the German Bundestag gains the ability in 2014 to investigate specific banks as part of the national implementation of Basel III. Such parliamentary powers should become standard in all European Union member states. Moreover, such a procedure should be not only a theoretical power, but also one that is used.

Nationalist Backlash

In a more recent post this month – Peterson Institute – Calm Seas in Europe in 2014? – Jacob Funk Kirkegaard predicts that whilst 2013 was a year of relative calm for the Eurozone, 2014 may be a very different matter. As usual the driving force behind any change in sentiment will be political: –

http://www.piie.com/blogs/realtime/?p=4195

No major EU elections are scheduled in 2014. In Italy, a new electoral law is unlikely to be agreed upon before it takes over the rotating EU presidency in the second half of 2014. By tradition, countries in that position refrain from holding national elections. Rather, European Parliament elections in May will be the political highlight of 2014. As discussed earlier, there is a risk that angry voters will turn out and elect some colorful non-mainstream members to that body. Still, there seems little risk that the European Parliament will become a “Weimar Parliament” with a majority of anti-EU members. Instead the established European parties seem likely to prevail with a smaller majority, ensuring that Europe remains governable.

With their increased representation, the question of what the anti-EU parties want (aside from their daily parliamentary allowances) will arise. Much has been written about the alliance between Marine Le Pen, leader of the French National Front, and the leader of the Dutch Freedom Party Geert Wilders. But theirs is little more than a photo-op coalition, posing limited political risks. There are inherent limitations on the ability of nationalist parties to collaborate across borders.

The European Parliament elections, though, may also indirectly influence the choice of the next president of the European Commission. In an attempt to broaden the democratic appeal of the European Union, the European political parties have suggested that they each propose a pan-European spitzen-kandidat for the post and then let the European voters decide. Of course, this is a naked—if well-intended—power grab by the European Parliament, as the right to select the Commission president resides with the EU member states according to the EU Treaty. And they are unlikely to surrender this right. At the same time, it will be very difficult for the EU member states to ignore the winning side in the European Parliament election. The heads of states will hence likely be compelled to at least choose a new European President from the side of the political aisle that won the most votes in the election. Their selection power will thus be constrained…

Economically, the biggest event in 2014 will be the rollout of the ECB’s asset quality review (AQR) and stress tests of the euro area banking system, representing the opportunity to finally restore the soundness of Europe’s bank balance sheet. Failure to carry out a convincing review will threaten the region with Japanese-style prolonged stagnation and undermine the credibility of the ECB. The AQR/stress test is more important than the hotly debated single resolution mechanism (SRM) designed to close down or consolidate failing banks, finally agreed by the EU finance ministers in late December [pdf]. Only a successful AQR/stress test can avert the continuing fragmentation of credit markets and reduce the high interest spreads between the core and periphery. Assuming that the SRM can fix financial fragmentation is erroneous, and much of the related criticism of the complex SRM compromise is misplaced. Even an optimally designed SRM would not make euro area banks suddenly lend to each other again.

A more pertinent question is whether the SRM compromise makes it more or less likely that the AQR succeeds in 2014. For sure the envisioned SRM is far from perfect. It has an excessively complex structure, including a 10-year phase-in, and a multistage resolution process involving a resolution board, the European Commission, and the EU finance ministers in the ECOFIN (finance ministers’) Council. Parts of it are grounded in EU law and parts are to be embodied by a new intergovernmental treaty. Hopefully some of these kinks will be corrected in the ongoing final reconciliation negotiations on the SRM between the member states and the European Parliament. But writing off the SRM as unworkable just because it is complex is a mistake. The European Union of 28 member states works every day, despite breathtaking complexity. Moreover, in emergencies the European bureaucracy can be circumvented and a decision forced through in 24 hours.

The European political landscape may become more polarised in 2014 with right wing parties gaining ground in the European parliament.

The Economist – Europe’s Tea Parties – 4th January 2014 – looks at the rise of nationalist parties in Europe, making comparison with the US Tea Party Republican group, there are some similarities but the differences are more pronounced: –

There are big differences between the Tea Party and the European insurgents. Whereas the Tea Party’s factions operate within one of America’s mainstream parties, and have roots in a venerable tradition of small-government conservatism, their counterparts in Europe are small, rebellious outfits, some from the far right. The Europeans are even more diverse than the Americans. Norway’s Progress Party is a world away from Hungary’s thuggish Jobbik. Nigel Farage and the saloon-bar bores of the United Kingdom Independence Party (UKIP) look askance at Marine Le Pen and her Front National (FN) across the Channel. But there are common threads linking the European insurgents and the Tea Party. They are angry people, harking back to simpler times. They worry about immigration. They spring from the squeezed middle—people who feel that the elite at the top and the scroungers at the bottom are prospering at the expense of ordinary working people. And they believe the centre of power—Washington or Brussels—is bulging with bureaucrats hatching schemes to run people’s lives.

The minority parties might seem largely irrelevant but voter apathy towards voting at European Elections gives European “Tea Parties” an opportunity to punch above their weight: –

Ultimately, though, the choice falls to voters themselves. The Tea Party thrived in America partly because a small minority of voters dominate primary races especially for gerrymandered seats. In elections to the European Parliament many voters simply do not bother to take part. That is a gift to the insurgents. If Europeans do not want them to triumph, they need to get out to the polls.

For an historical perspective on how the Eurozone might move towards closer unification the New York Fed – The Mississippi Bubble of 1720 and the European Debt Crisis – 10th January 2014 – offers some interesting observations. This is part of a series of articles called the “Crisis Chronicles” from Liberty Street Economics: –

http://libertystreeteconomics.newyorkfed.org/2014/01/crisis-chronicles-the-mississippi-bubble-of-1720-and-the-european-debt-crisis.html

Austerity and Debt Restructuring

From summer 2012 through 2013 European equities performed well, with peripheral markets such as Greece and Ireland benefitting from the reduced risk of a Greek exit and single currency area breakup. Bond markets exhibited a similar response with higher yielding peripheral markets outperforming the core – see first chart above.  2014 may see these convergence patterns reverse as this article from the Council for Foreign Relations – Beware of Greeks Bearing Primary Budget Surpluses – points out: –

http://blogs.cfr.org/geographics/2013/12/04/greeksurpluses

Sovereign Debt Default and Primary Balances - Source IMF.

.

.

.

Source: IMF

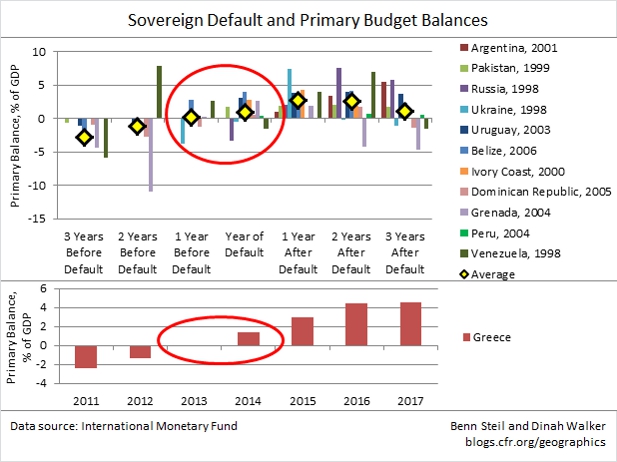
Things are looking up in Greece – that’s what Greek ministers have been telling the world of late, pointing to the substantial and rapidly improving primary budget surplus the country is generating.  Yet the country’s creditors should beware of Greeks bearing surpluses.

A primary budget surplus is a surplus of revenue over expenditure which ignores interest payments due on outstanding debt.  Its relevance is that the government can fund the country’s ongoing expenditure without needing to borrow more money; the need for borrowing arises only from the need to pay interest to holders of existing debt.  But the Greek government (as we have pointed out in previous posts) has far less incentive to pay, and far more negotiating leverage with, its creditors once it no longer needs to borrow from them to keep the country running.

This makes it more likely, rather than less, that Greece will default sometime next year.  As today’s Geo-Graphic shows, countries that have been in similar positions have done precisely this – defaulted just as their primary balance turned positive.

The upshot is that 2014 is shaping up to be a contentious one for Greece and its official-sector lenders, who are now Greece’s primary creditors.  If so, yields on other stressed Eurozone country bonds (Portugal, Cyprus, Spain, and Italy) will bear the brunt of the collateral damage.

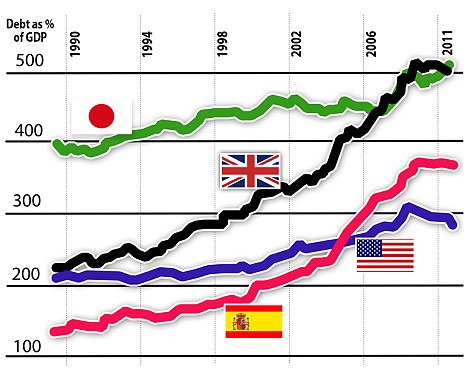
European debt restructuring meanwhile still has far to go but many EZ countries seem to think that being “developed” precludes the need to restructure and reform. Carmen Reinhart and Kenneth Rogoff produced a working paper for the IMF –  Financial and Sovereign Debt Crises: Some Lessons Learned and Those Forgotten – December 2013 – which takes a global look at this subject in detail: –

http://www.imf.org/external/pubs/ft/wp/2013/wp13266.pdf

Here’s the abstract: –

Even after one of the most severe multi-year crises on record in the advanced economies, the received wisdom in policy circles clings to the notion that high-income countries are completely different from their emerging market counterparts. The current phase of the official policy approach is predicated on the assumption that debt sustainability can be achieved through a mix of austerity, forbearance and growth. The claim is that advanced countries do not need to resort to the standard toolkit of emerging markets, including debt restructurings and conversions, higher inflation, capital controls and other forms of financial repression. As we document, this claim is at odds with the historical track record of most advanced economies, where debt restructuring or conversions, financial repression, and a tolerance for higher inflation, or a combination of these were an integral part of the resolution of significant past debt overhangs.

The paper follows on from research they have undertaken over the last couple of years including their seminal work – Growth in a time debt – NBER – January 2010 – which achieved considerable notoriety when an economics student discovered statistical errors in the paper – a short version is available here: –

http://www.nber.org/digest/apr10/w15639.html

Their new paper concludes: –

Of course, if policymakers are fortunate, economic growth will provide a soft exit, reducing or eliminating the need for painful restructuring, repression, or inflation. But the evidence on debt overhangs is not heartening. Looking just at the public debt overhang, and not taking into account old-age support programs, the picture is not encouraging. Reinhart, Reinhart, and Rogoff (2012) consider 26 episodes in which advanced country debt exceeded 90 percent of GDP, encompassing most or all of the episodes since World War II. (They tabulate the small number of cases in which the debt overhang lasted less than five years, but do not include these in their overhang calculations.) They find that debt overhang episodes averaged 1.2 percent lower growth than individual country averages for non-overhang periods. Moreover, the average duration of the overhang episodes is 23 years. Of course, there are many other factors that determine longer-term GDP growth, including especially the rate of productivity growth. But given that official public debt is only one piece of the larger debt overhang issue, it is clear that governments should be careful in their assumption that growth alone will be able to end the crisis. Instead, today’s advanced country governments may have to look increasingly to the approaches that have long been associated with emerging markets, and that advanced countries themselves once practiced not so long ago.

Germany’s slowing growth and potential banking crisis

Meanwhile, Germany, which has benefitted economically from the painful Hartz reforms of the early 2000’s may be losing momentum.

Peterson Institute –  Making Labor Market Reforms Work for Everyone: Lessons from Germany – sets the scene, highlighting how labour reform in Germany has given the country a significant competitive edge: –

http://www.piie.com/publications/pb/pb14-1.pdf

…First, Germany has the best functioning labor market among large economies in Europe and the United States. Second, German wage restraint is of a relatively limited magnitude compared with most euro area countries and hence fails to explain the uniformly large intra–euro area unit labor cost divergences between Germany and other members after 1999. Third, total German labor costs per worker continue to exceed costs in other major EU countries and the United States. Fourth, Germany’s recent labor market revival has not come about through the expansion of predominantly low wage jobs. Fifth, the expansion of mini-jobs in Germany since 2003 has overwhelmingly taken place as second jobs. And sixth, the successful reliance on kurzarbeit programs in 2009 was not an innovation but rather another instance of labor input adjustment in favor of “insider workers” in Germany.

I’m indebted to Quartz.com for the table below which shows German exports and imports by region. Within the Eurozone the two components are fairly balanced but this disguises country specific imbalances, for example, for the first 10 months of 2013, Germany ran a surplus with France of Euro 30bln but a deficit with the Netherlands of Euro 15bln.

German exports and imports by region - source Quartz.

.

.

Source: Quartz.com

The Economist – Die grosse stagnation – 30th November 2013 – paints a rather different picture of the risks ahead for Germany – once again these risks are political in nature, but their principal concern is that the recent coalition deal looks set to reverse a number of these successful reforms: –

http://www.economist.com/news/leaders/21590903-germanys-proposed-new-government-set-turn-motor-europe-slowcoach-die-grosse

…That is because Germany’s economy has been living off past glory—especially “Agenda 2010”, a series of reforms launched in 2003 by Gerhard Schröder, Mrs Merkel’s predecessor. But it is running out of puff. Labour productivity has grown less than half as fast as Spain’s over the past ten years; and its overall rate of public and private investment, at 17% of GDP, has fallen by more than a fifth since the euro was introduced. No European country has carried out fewer reforms than Germany since the euro crisis began.

… The coalition’s 185-page “treaty” was a chance to launch a new reform agenda. Instead, its proposals are a mixture of the irrelevant—charging foreigners to use German motorways—and the harmful.

…The coalition’s pension policy seems even more retrogressive. These days, most advanced economies are expecting longer-living people to be longer-working, too. But the coalition wants the pension age, raised to 67 in the previous grand coalition, to be moved back down again for specific groups, in some cases to 63. France’s president, François Hollande, was rightly mocked, not least by Mrs Merkel, for a similar ploy. Now the woman who has lectured the rest of Europe about the unsustainability of its welfare spending will follow down the same spendthrift road.

…The impact on this coalition on the rest of Europe would not be all bad. One bonus is that, for all its primitive economic policies, the SPD seems keener to support some basic reforms such as the creation of a banking union. But that will count for little if Germany, the motor of Europe’s economy, stalls. And, in the light of the coalition agreement, that is a real danger.

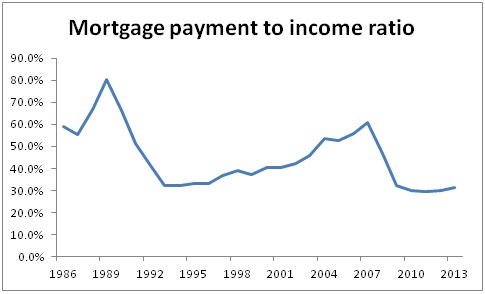
After a strong performance by European Equities and peripheral government bonds in 2013, the prospects for 2014 may be less sanguine, though I’m not bearish at this stage. The principal market risk is likely to emanate from the European banking sector. One example of this, concerns shipping. The chart below shows the Baltic Dry Freight Index month end values from 1985 to end December 2013 – it’s worth noting that the BDI has plummeted this month leading many commentators to predict a global economic downturn.

Baltic Dry index 29 yrs.

.

.

Source: Bloomberg

Over the past ten years the price of “Dry” cargoes has soared and plummeted. During this cycle European banks, German ones in particular – abetted by favourable German government tax treatment – moved aggressively into the shipping finance sector; it is estimated that German banks are currently the financiers behind more than 40% of the world container shipping fleet. These shipping loans were often repackaged and sold on to high net worth investors but, rumour has it, the majority of these investments carried a “principal guarantee”. The ships, meanwhile, are no longer competitive due to improvements in fuel efficiency since the mid 2000’s. The banks are effectively left long “scrap metal”.

Moody’s gave an estimate last month for German banks impairment due to shipping loans of US$22bln for 2014, they went on to state: –

Germany’s eight major ship financiers have lent a total of 105 billion euros to the sector, a fifth of which are categorized as non-performing…

We expect the extended downward shipping cycle to cause rising problem loans in the shipping sector during 2013-14, requiring German banks to increase their loan-loss provisions. This will challenge their earnings power.

Here is the Reuters article for further detail: –

http://www.reuters.com/article/2013/12/10/moodys-shippingbanks-idUSL6N0JP2CV20131210

I wonder whether the ECB’s AQR will uncover the extent of this problem. Last Autumn S&P estimated European banks had a funding gap of Euro 1.3trln as at the end of 2012. My guess is that this is understated: shipping is just one sector, the “quest for yield” is industry wide.

EZ Money supply growth and rising peripheral debt

Another headwind facing Europe is the weakness in money supply growth. In 2012 EZ M3 was growing at above 3%, it dipped below 3% in H1 2013 and below 2% in H2 2013.

Eurozone M3 - ECB.

.

.

.

Source: ECB

The ECB CPI target of 2% is roughly consistent with M3 growth of 4-6%.

The Telegraph – Eurozone M3 plunge flashes deflation alert – Novemebr 28th 2013

takes up the theme of potential deflation:-

http://www.telegraph.co.uk/finance/economics/10481773/Eurozone-M3-money-plunge-flashes-deflation-alert-for-2014.html

The European Central Bank said M3 money growth fell to 1.4pc from a year earlier, lower than expected and far below the bank’s own 4.5pc target deemed necessary to keep the economy on an even keel.

A rather more extreme view is expressed by Andrew Cullen – Europeans Looking To Inflate Their Debts Away – Mises Institute – 12th November 2013

http://mises.org/daily/6581/Europeans-Looking-To-Inflate-Their-Debts-Away

How does a reduction in consumer price inflation become “deflation”? How does a minor improvement in the purchasing power of consumers become a problem for liquidity in the financial markets? Austrian-economic thinking, which understands that new money is never neutral in its effects, offers insight:

[T]he crux of deflation is that it does not hide the redistribution going hand in hand with changes in the quantity of money …[4]

European politicians and central bank policy-makers are concerned not about consumer price reductions but about real reductions in the money supply as such reductions would force governments to abandon permanent budget deficit monetization. That is why they maintain a monopoly over the power to create money and they like to control where money enters the economy. Politicians use these advantages in two ways.

First, they are all, with the sole exception of the Bundesbank, “inflationists” when it comes to monetary policy. Inflation (that is, an increase in the money supply) steadily reduces the purchasing power of a fiat money and, in parallel, eases the burden of debt repayments over time as nominal sums become progressively of less relative value.

Such price inflation benefits debtors at the expense of creditors. Hence, for highly indebted Eurozone governments, price inflation is the perceived “get out of jail” card, permitting them to meet their debt obligations with a falling share of government expenditures.

Second, at least amongst the political elites in the “PIIGS” (Portugal, Italy, Ireland, Greece, Spain) and in France, they espouse “reflation” plans using the ECB’s money-creation powers which would ratchet up to another degree inflation of the money supply, monetization of government debt, and increases in total government debts; and thereby protect and enhance the economic power and privileges of governments and the state.[5]

Yet growth of PIIGS governments’ debts as a proportion of GDP (Table 1) have now crossed above the critical 90 percent ratio advised by Rogoff and Reinhart as being the threshold above which growth rates irrevocably decline.[6]

Table 1. Gross Government Debt as Per cent of GDP 2008-14 for the Eurozone and selected member countries (Adapted from: IMF Fiscal Monitor: Taxing Times, p16. October 2013)

                                2008       2010       2012       2014 (forecast)

Eurozone                70.3        85.7        93.0        96.1

Spain                      40.2        61.7        85.9        99.1

Italy                        106.1      119.1      127.0      133.1

Portugal                 71.7        94.0        123.8      125.3

Ireland                    44.2        91.2        117.4      121.0

There is another potential problem: European commercial banks may be too fragile to fulfil their allotted role. ECB President Mario Draghi himself has initiated another round of stress testing of European banks’ balance sheets against external shocks, a sign that the ECB itself has doubts about systemic stability in the banking sector. But this testing has hardly begun. Here are four risk factors in play:

First, there has been large-scale flight of deposits from banks operating within the PIIGS’ toward banks of other Eurozone countries,[7] as well as outside the Eurozone entirely. This phenomenon is caused by elevated risk of seizures, consequent upon the forced losses on bondholders at Greek banks and the recent “bail-in” of depositors at the Bank of Cyprus.

Second, many PIIGS’ domestic banks still hold on their books bad loans arising from the boom years (2000-2007). Failure to deleverage and liquidate losses is prolonging the banks’ adjustment process.

Third, they already hold huge quantities of sovereign debt (treasury bonds) from Eurozone governments from previous rounds of buying. Banks have had to increase their risk weightings on such debt holdings as Ratings Agencies have downgraded these investments to comply with Basel II. This constrains their forward capacity for lending to these governments.

Fourth, there is concern for rising interest rates. Since the famous “Draghi put” in July 2012, real rates remain low and yields on PIIGS’ sovereign bonds fell back closer to German bunds. But this summer yields on US Treasury bonds with long maturities started to rise on Fed taper talk.[8] Negative surprises knock confidence in the international bond markets. The risk of massive losses should bond prices drop is one that the European-based banks cannot afford given their still low capital reserves and boom phase legacy of over-leveraging.

Implementation impediments aside, a new phase of aggressive easy money policy from the ECB is both probable and imminent.

[4] J.G. Hülsmann, Deflation & Liberty (2008), p. 27.

You might also enjoy Andrew’s blogsite where he also speculates about large scale asset purchases from the ECB: –

http://www.thecantillonobserver.com

European equity and bond market prospects for 2014

This brings me neatly to what you may consider a rather contrarian view of European equities and bonds. So far this article has focussed on the negative headwinds which many commentators expect to undermine confidence in financial markets, however, I’m reminded of some sage words from the “Sage of Omaha” – the quote below comes from an interview/speech which Warren Buffet gave in July 2000 at the Allen & Co, Sun Valley corporate gathering, reported here by Fortune/CNN: –

http://money.cnn.com/magazines/fortune/fortune_archive/2001/12/10/314691/

In economics, interest rates act as gravity behaves in the physical world. At all times, in all markets, in all parts of the world, the tiniest change in rates changes the value of every financial asset. You see that clearly with the fluctuating prices of bonds. But the rule applies as well to farmland, oil reserves, stocks, and every other financial asset. And the effects can be huge on values. If interest rates are, say, 13%, the present value of a dollar that you’re going to receive in the future from an investment is not nearly as high as the present value of a dollar if rates are 4%.

So here’s the record on interest rates at key dates in our 34-year span. They moved dramatically up–that was bad for investors–in the first half of that period and dramatically down–a boon for investors–in the second half.

Since short term rates are close to zero and central bank buying of government bonds has flattened yield curves in most major markets, surely the risk has to be that government bond yields have an asymmetric upside risk? Well, yes, but only if investors lose all confidence in those “risk-free” government obligations. Added to which – what is the correct size for a central bank balance sheet – $4trln or $400trln? When measured in balance sheet expansion terms the ECB is far behind the curve; they have availed themselves of the aggressive quantitative easing of other central banks to exert internal pressure on profligate EZ countries, cajoling them to structurally reform. I believe this austerity has largely run its course, but, as the AQR, is likely to show, it has left the EZ financial system in a weak position.

European bond convergence between the core and periphery continues as the table below (15/1/2014) from Bloomberg shows : –

Europe Yield

1 Day

1 Month

1 Year

Germany 1.82% +1 -1 +24
Britain 2.86% +3 -4 +84
France 2.47% +1 +4 +34
Italy 3.88% +1 -21 -33
Spain 3.82% +1 -28 -120
Netherlands 2.13% +1 -1 +43
Portugal 5.25% 0 -77 -104
Greece 7.67% 0 -95 -388
Switzerland 1.18% +1 +22 +56

European stock markets are making new highs – although EuroStoxx 50 is still some way below its 2008 peak, unlike the S&P. EUR/USD continues to regain composure after the fears of an EZ break-up in the summer of 2012. In this environment I see no reason to liquidate long positions in European equities and higher yielding peripheral bond markets. If US Equities turn bearish and US bond yields rise abruptly, as they did in 2013, then I would expect the ECB to provide their long overdue support. However, a precipitous decline in EUR/USD is cause for concern as this may herald the beginning of another Eurozone crisis – whilst I anticipate some of the above issues will surface during 2014, the “Draghi put” still offers significant protection, whilst the Peterson Institute – Why the European Central Bank Will Likely Shrink from Quantitive Easing – January 15th 2014 – makes a strong case for the ECBs hands being tied: –

http://blogs.piie.com/realtime/?p=4208

I still believe European markets represent a “hedged” exposure to the continued bullish trends in major market equities and higher yielding bonds – the market always prefers to travel than to arrive.

Commodity super-cycles in a fiat currency world

400dpiLogo.

.

.

Macro Letter – No 2 – 16-12-2013  

Commodity super-cycles in a fiat currency world

Notwithstanding weakness in the last six weeks, stock markets have witnessed significant gains during 2013, but commodities – with a few exceptions – have failed to follow suit.

For global investors the advent of investible commodity indices has simplified the commodity allocation process but I have always encouraged my readers to view each commodity on its own merits.

The Goldman Sachs – GSCI Index is constructed on a production weighted basis; the table below is courtesy of Reuters: –

                       2013       2012    Change Vs 2012

 WTI Crude           30.96%     24.71%           6.25%

 Kansas Wheat         0.88%      0.68%           0.20%

 Live Cattle          2.71%      2.62%           0.09%

 Sugar                1.90%      1.85%           0.05%

 Cotton               1.12%      1.07%           0.05%

 Gold                 3.05%      3.00%           0.05%

 Soybeans             2.63%      2.62%           0.01%

 Coffee               0.83%      0.82%           0.01%

 Natural Gas          2.03%      2.02%           0.01%

 Zinc                 0.52%      0.51%           0.01%

 Cocoa                0.23%      0.23%           0.00%

 Nickel               0.58%      0.58%           0.00%

 Silver               0.49%      0.49%           0.00%

 Aluminum             2.12%      2.13%          -0.01%

 Lead                 0.38%      0.40%          -0.02%

 Corn                 4.66%      4.69%          -0.03%

 Feeder Cattle        0.49%      0.52%          -0.03%

 LME Copper           3.24%      3.28%          -0.04%

 Lean Hogs            1.52%      1.58%          -0.06%

 Chicago Wheat        3.04%      3.22%          -0.18%

 Gas Oil              8.11%      8.56%          -0.45%

 RBOB Gasoline        5.02%      5.90%          -0.88%

 Heating Oil          5.13%      6.17%          -1.04%

 Brent Crude         18.35%     22.34%          -3.99%

This highlights the increasing production of WTI Crude (West Texas Intermediate) relative to Brent Crude. It also highlights the substantial index weighting to Energy followed by Metals and then Grains. In this letter I will keep these weightings in mind.

The table below, from barchart.com, shows the year to date performance of the major US futures markets. The price divergence is not atypical.

US Futures YTD - barchart

.

.

.

.

Source: barchart.com

As an “asset class” commodities offer among the most uncorrelated returns, but, unlike more traditional assets, they generally have a negative real expected long-term return. In other words, due to human ingenuity, the cost of production falls over time.

Back in 2006 I used the chart below from the Economist as part of a presentation about the dangers of “long-only” investment in commodities. The Economist first published its Industrial Commodity-price index in 1864 due to demand for information on commodity markets resulting from the strong price appreciation during the preceding two decades. The commodity price appreciation was driven primarily by US demand as the country industrialised and then entered into a bloody civil war. Historic data was collected to create a starting level of 100 in 1845. When the raw data is deflated using the US GDP deflator you will observe that the current index is rebounding from a cyclical low of 20.

The Economist industrial commodity-price index

Economist Commodity Price Index - deflated - 1845 - 2005.

.

.

.

Source: Economist

Today, in a world of fiat currencies, it is more difficult to examine the cause and effect of changes in supply and demand for commodities because their measurement – generally in US$ – is itself a “moving target” rather than a “store of value”. However, given the vagaries of Gold leasing and the plethora of conspiracy theories surrounding the price of Gold, the “gently declining” US$ seems like the most familiar measure of value. This “Dollar Value” is practical in the short-term but in the Long Run the entire commodity cycle may be as much a reflection of monetary policy as supply and demand for the underlying commodities.

The collapse of Bretton Woods in 1971 heralded in a period of inflation, the appointment of Paul Volcker as governor of the Federal Reserve finally reversed this process as he attempted to control the supply of money. The bursting of the “Tech Bubble” and a policy of low interest rates created the conditions for the next “Super-cycle”.

One of the vexing issues with commodity super-cycles is their variability of duration. This paper from the United Nations Department of Economic and Social Affairs – Super-cycles of commodity prices since the mid-nineteenth century – is a useful guide to the difficulties of prediction: –

http://www.un.org/esa/desa/papers/2012/wp110_2012.pdf

Here is the abstract:-

Decomposition of real commodity prices suggests four super-cycles during 1865-2009 ranging be­tween 30-40 years with amplitudes 20-40 percent higher or lower than the long-run trend. Non-oil price super-cycles follow world GDP, indicating they are essentially demand-determined; causality runs in the opposite direction for oil prices. The mean of each super-cycle of non-oil commodities is generally lower than for the previous cycle, supporting the Prebisch-Singer hypothesis. Tropical agriculture experienced the strongest and steepest long-term downward trend through the twentieth century, followed by non-tropical agriculture and metals, while real oil prices experienced a long-term upward trend, interrupted temporarily during the twentieth century.

The paper goes on to point out that these cycles can last between 20 and 70 years. The UN, however, focus on developing country demand, seeing it as the main driver of the cycles; they don’t consider the “money” side of this phenomenon.

The origin of modern economic studies of cycles is thought to have commenced with Nicolai Kondratiev, it was then taken up by economists of the Austrian School, most notably Joseph Schumpter. At this time – 1930’s – other price cycle theories were being developed independently by Ralph Elliott, among others. Elliott’s ideas were published in his book – The Wave Principle – in 1938. Among his influences were the Italian 10th Century mathematician Leonardo of Pisa – otherwise known as Fibonacci.

I believe there is another long-term factor which drives these cycles, beyond economic growth and currency debasement, and that is geopolitical tension. In developing my thoughts on this subject I am indebted to two authors; Marc Widdowson – The Coming Dark Age – The Phoenix Principle – which I must admit I am still reading, you may download it here: –

http://www.scribd.com/doc/63914376/The-Coming-Dark-Age

The other author is David Murrin – Breaking the Code of History – David looks at the history of empires using a wave principle derived from Elliott and the Polish-American mathematician Benoit Mandelbrot’s theories of fractal geometry, here is his website:-

www.davidmurrin.co.uk

In simple terms, David’s observation is that the majority of wars, throughout history, have been driven by resource scarcity. Looking back at the Economist Commodity Price Index you can identify the great conflicts of recent history. However, during the tumults, more often than not, payment in specie was suspended and inflation ensued. Any countries return to the “Gold Standard”, or its equivalent, was likely to precipitate an inevitable period of deflation; as happened to the UK and US after the first world war.

Returning to the factor of debasement, during the “Great Deformation”, as David Stockman describes the post Bretton Woods era (1971 onwards) governments have been operating in an elastic “quasi-war finance” environment. When ever a crisis arrives, governments lean on their respective central banks to backstop the markets with abundant liquidity. As the worlds’ “reserve currency” is the US$, the US government has an advantage – what De Gaulle referred to as the “exorbitant privilege” during the period of the gold exchange standard, remains a  boon today – but other countries have succeeded to a lesser degree by allowing their currencies to decline relative to the UD$.

The prospects for commodities

Looking ahead to 2014 there are a plethora of factors to consider. I will focus on just a few: –

Commodity – Demand

On the demand side of the equation are China followed by other emerging market countries where strong economic growth is expected. Below is the OECD GDP forecast from 20th November 2013: –

Real   gross domestic product – forecasts
‌‌

‌2008‌

‌2009‌

‌2010‌

‌2011‌

‌2012‌

‌2013‌

‌2014‌

‌2015‌

Australia

2.4


1.5


2.6


2.4


3.7


2.5


2.6


3.1


Austria

0.9


-3.5


1.9


2.9


0.6


0.4


1.7


2.2


Belgium

1.0


-2.8


2.4


1.9


-0.3


0.1


1.1


1.5


Canada

1.2


-2.7


3.4


2.5


1.7


1.7


2.3


2.6


Chile

3.2


-0.9


5.7


5.8


5.6


4.2


4.5


4.9


Czech   Republic

3.1


-4.5


2.5


1.8


-1.0


-1.5


1.1


2.3


Denmark

-0.8


-5.7


1.4


1.1


-0.4


0.3


1.6


1.9


Estonia

-4.2


-14.1


2.6


9.6


3.9


1.0


2.4


4.0


Finland

0.3


-8.5


3.4


2.7


-0.8


-1.0


1.3


1.9


France

-0.2


-3.1


1.6


2.0


0.0


0.2


1.0


1.6


Germany

0.8


-5.1


3.9


3.4


0.9


0.5


1.7


2.0


Greece

-0.2


-3.1


-4.9


-7.1


-6.4


-3.5


-0.4


1.8


‌‌

‌2008‌

‌2009‌

‌2010‌

‌2011‌

‌2012‌

‌2013‌

‌2014‌

‌2015‌

Hungary

0.9


-6.8


1.1


1.6


-1.7


1.2


2.0


1.7


Iceland

1.2


-6.6


-4.1


2.7


1.4


1.8


2.7


2.8


Ireland

-2.2


-6.4


-1.1


2.2


0.1


0.1


1.9


2.2


Israel 1

4.5


1.2


5.7


4.6


3.4


3.7


3.4


3.5


Italy

-1.2


-5.5


1.7


0.6


-2.6


-1.9


0.6


1.4


Japan

-1.0


-5.5


4.7


-0.6


1.9


1.8


1.5


1.0


Korea

2.3


0.3


6.3


3.7


2.0


2.7


3.8


4.0


Luxembourg

-0.7


-5.6


3.1


1.9


-0.2


1.8


2.3


2.3


Mexico

1.2


-4.5


5.1


4.0


3.6


1.2


3.8


4.2


Netherlands

1.8


-3.7


1.5


0.9


-1.2


-1.1


-0.1


0.9


New   Zealand

-0.6


0.3


0.9


1.3


3.2


2.3


3.3


2.9


Norway

0.1


-1.6


0.5


1.2


3.1


1.2


2.8


3.1


Poland

5.0


1.6


3.9


4.5


2.1


1.4


2.7


3.3


Portugal

0.0


-2.9


1.9


-1.3


-3.2


-1.7


0.4


1.1


Slovak   Republic

5.8


-4.9


4.4


3.0


1.8


0.8


1.9


2.9


Slovenia

3.4


-7.9


1.3


0.7


-2.5


-2.3


-0.9


0.6


Spain

0.9 

-3.8


-0.2


0.1


-1.6


-1.3


0.5


1.0


‌‌

‌2008‌

‌2009‌

‌2010‌

‌2011‌

‌2012‌

‌2013‌

‌2014‌

‌2015‌

Sweden

-0.8


-5.0


6.3


3.0


1.3


0.7


2.3


3.0


Switzerland

2.2


-1.9


3.0


1.8


1.0


1.9


2.2


2.7


Turkey

0.7


-4.8


9.2


8.8


2.2


3.6


3.8


4.1


United   Kingdom

-0.8


-5.2


1.7


1.1


0.1


1.4


2.4


2.5


United   States

-0.3


-2.8


2.5


1.8


2.8


1.7


2.9


3.4


Euro   area (15 countries)

0.2


-4.4


1.9


1.6


-0.6


-0.4


1.0


1.6


OECD-Total

0.2


-3.5


3.0


1.9


1.6


1.2


2.3


2.7


Brazil

5.2


-0.3


7.5


2.7


0.9


2.5


2.2


2.5


China

9.6


9.2


10.4


9.3


7.7


7.7


8.2


7.5


India

6.2


5.0


11.2


7.7


3.8


3.0


4.7


5.7


Indonesia

6.0


4.6


6.2


6.5


6.2


5.2


5.6


5.7


Russian   Federation

5.2


-7.8


4.5


4.3


3.4


1.5


2.3


2.9


South   Africa

3.6


-1.5


3.1


3.5


2.5


2.1


3.0


3.7


Source: OECD

Resource security has influenced China’s foreign policy for several years. Their increasing presence in Africa is but one example of this approach. Chinese trade negotiations at a bilateral and multilateral level continue apace. China’s latest economic policies are discussed by Jamestown Foundation – Economic Reform in the Third Plenum: Balancing State and Market –  

http://www.jamestown.org/programs/chinabrief/single/?tx_ttnews%5Btt_news%5D=41667&tx_ttnews%5BbackPid%5D=25&cHash=9fc3fb92316d1e463d72d5505fc20884#.UqrHhJRFDMx

The new “market-centric” policy suggests more, rather than less, uncertainty for commodity prices: –

The plenum report calls for the market to play a “decisive role” (juedingxing zuoyong) in the allocation of resources in the economy. This represents an elevation from previous party documents, which assigned the market a “fundamental role” (jichuxing zuoyong) in resource allocation. This change in language reflects a step forward in the continued reduction in the number of official price controls. Areas that are specifically targeted in the report include the prices of water, oil, natural gas, electricity, transportation and information technology.

As the private sector gains traction and State Owned Enterprises (SOEs) diminish, better inventory controls are bound to be implemented. Chinese stockpiles of commodities have been a function of SOEs ability to purchase well into the future. The more cash-flow constrained private sector will need to operate more efficiently and with lower stock levels. During the transition I anticipate some reduction in demand. In the past year a moderate slow-down in Chinese growth, combined with a backing-up of US Treasury yields in anticipation of the tapering of QE has put significant downward pressure on a broad array of industrial commodities. With stronger growth forecast for next year demand may lead to an increase in prices but the structural rebalancing towards the private sector is a strong counter-factor.

Energy – supply

On the supply side, starting with Oil, Gas and Coal are the OPEC members, Russia and USA – though it is worth noting that China is the fifth largest Oil producer. Recent price action in Crude Oil has been puzzling in that the price rallied following the recent Iranian peace deal. The European Council for Foreign Relations – The Gulf and sectarianism – give some insight into the increased risk that the recent agreement has created, however, it goes on to look at Shiite/Sunni tensions throughout the whole middle eastern region: –

No single country is considered to do more to propagate sectarianism than Saudi Arabia. As Andrew Hammond writes in his essay in this issue of Gulf Analysis, the Saudi royal family sees itself as the rightful inheritor and guardian of Islamic orthodoxy. Saudi Arabia’s formal interpretation of Islam is ideologically sectarian, condemning all other traditional schools of Islamic thought and religious communities as heresy. The state and private citizens put millions every year into evangelism (known in Arabic as da’wa), the establishment of schools and mosques worldwide and financial support to print and broadcast media that promote its interpretation of Islam.

As Shiite communities inside Saudi Arabia and around it constitute the largest and most organised group of such “heretics”, it deliberately subjects them to particularly stringent criticism and discrimination. Even before the Arab Awakening, the rise of an Islamist, Shiite Iran, and then a Shiite Iraq had already posed a serious threat to a Saudi and Wahhabi influence over the region.

The full article can be found here: –

http://ecfr.eu/page/-/ECFR91_GULF_ANALYSIS_AW.pdf

The oil price appears to be trapped in a virtuous/vicious circle: a collapse in the oil price will exacerbate sectarian tensions prompting a rise in the price of oil. Only a significant slowdown in global demand is likely to change this dynamic.

Of course, there are other geopolitical flashpoints; Russia – as they approach the winter Olympics – the South China Sea (as discussed last week) but the disruption to energy supplies created by a new Middle Eastern conflict would probably cause the largest immediate damage to global growth.  Returning to the UN paper, the “Oil Cycle” tends to be “contra” to other commodities; rising oil prices are often referred to as a tax on consumption. It may also go some way to explaining the relatively strong performance of oil in 2013 despite significant increases in fracking production and continuous improvement in drilling techniques. The chart below shows the relative strength of oil since the Great Recession began.

WTI - 5 yr chart - infomine

.

.

.

Source: infomine.com

Natural Gas in the US is a “local” market due to US restrictions on the issue of export licenses and the significant cost of gas liquefaction. In Europe, Russia is the dominant player. Russian gas prices have been relatively stable this year, although they have rebounded more strongly than US Natural Gas since 2008.

The recent surge in US gas prices is a response to regional weather conditions. It’s worth noting that US Natural Gas prices tend to be either non or negatively correlated to the price of WTI. Overall supply is increasing and as the government issues more LNG licenses – longer-term I expect prices to remain subdued.

US Natural Gas - 5 yr chart - infomine US Natural Gas - 6 month chart - source infomine

.

.

.

Source: infomine.com

Coal has remained subdued in the US and elsewhere during 2013. China is the largest producer followed by the US, India, Australia and Russia. Thermal Coal has rallied recently in response to the spike in Natural Gas but, barring a significant increase in global demand, I don’t envisage a marked increase in prices in 2014.

US Thermal Coal CAPP - 2001 to 2013 - Source Infomine

.

.

.

Source: infomine.com

Industrial metals – Supply

Among the industrial metals I will focus on Iron Ore/Steel and Copper. These form the basis for a large swathe of industrial activity. The largest producers of Iron Ore are China, Australia, Brazil, India and Russia. By contrast global copper production is dominated by Chile which produces around 5 mln tons (USA is next with just over 1 mln tons).

Iron Ore - 5yr chart - source infomine Copper - 24 yr chart - source infomine

.

.

.

Source: infomine.com

Iron Ore has reflected the moribund state of global demand since the start of the great recession. Copper has recovered from its 2009 lows but further upside impetus is lacking. This may have been due to the high levels of stock, however, during the last six months these stock levels have started to decline. A small increase in demand could lead to a significant re-rating.

Copper LME warehouse levels - 5 yr - source infomine

.

.

.

Source: infomine.com


Precious Metals – supply

The precious metals complex is dominated by Gold and 2013 has been a difficult year for the “Gold-bugs” as central banks continue adding liquidity but gold prices fail to respond. So much has been written about this subject that I feel I can add little to the debate except to note that the disparity between paper gold (ETFs and Certificate) appear to be at an unusually large discount to physical gold – especially in India and China. For more insights into the arcana of the gold leasing market, I refer you to an excellent article by Gold Money’s Alasdair Macleod – There’s too little gold in the West –  published by the Cobden Centre: –

http://www.cobdencentre.org/?s=There+is+too+little+gold+in+the+West+

Here is his typically bullish dénouement: –

Bearing in mind Veneroso’s conclusion in 2002 that there must be 10,000-15,000 tonnes out on lease and loan from the central banks at that time, one could imagine that this figure has increased significantly. Officially, the signatories of the Central Bank Gold Agreement, plus the U.S. and U.K. own 20,393 tonnes. A number of other central banks are likely to have been persuaded to “invest” their gold, but this is bound to exclude Russia, China, the Central Asian states, Iran, and Venezuela. Taking these holders out (amounting to about 3,000 tonnes) leaves a balance of 8,401 tonnes for all the rest. If we further assume that half of that has been deposited in London, New York, or Zurich and leased out, that means the total gold leased and available for leasing since 2002 is about 12,000 tonnes. And once that has gone, there is no monetary gold left for the purpose of price suppression.

Could this have disappeared since 2002 at an average rate of 1,000 tonnes per annum? Quite possibly, in which case, the central banks are very close to losing all control over the gold price.

Meanwhile the trend continues lower.

Gold

Gold - 2yr chart.

.

.

Source: Tradingcharts.com

Agricultural commodities – supply

With the agricultural sector demand is broadly constant although secular trends such as China’s increasing consumption of meat are structurally important. Within the agricultural sector I will review Wheat, Corn and Soybeans. No pork bellies, frozen concentrated orange juice and none of the softs – not because these markets don’t matter but in the interests of brevity.

In June 2013 the Food and Agriculture Organisation (FAO) published their long-term forecast for agricultural production.  Here is their press release: –

Global agricultural production is expected to grow 1.5% a year on average over the coming decade, compared with annual growth of 2.1% between 2003 and 2012, according to a new report published by the OECD and FAO today.

Limited expansion of agricultural land, rising production costs, growing resource constraints and increasing environmental pressures are the main factors behind the trend. But the report argues that farm commodity supply should keep pace with global demand.

The OECD-FAO Agricultural Outlook 2013-2022 expects prices to remain above historical averages over the medium term for both crop and livestock products due to a combination of slower production growth and stronger demand, including for biofuels,

The report says agriculture has been turned into an increasingly market-driven sector, as opposed to policy-driven as it was in the past, thus offering developing countries important investment opportunities and economic benefits, given their growing food demand, potential for production expansion and comparative advantages in many global markets.

However, production shortfalls, price volatility and trade disruption remain a threat to global food security. The OECD/FAO Outlook warns: “As long as food stocks in major producing and consuming countries remain low, the risk of price volatility is amplified. A wide-spread drought such as the one experienced in 2012, on top of low food stocks, could raise world prices by 15-40 percent.”

China, with one-fifth of the world’s population, high income growth and a rapidly expanding agri-food sector, will have a major influence on world markets, and is the special focus of the report. China is projected to remain self-sufficient in the main food crops, although output is anticipated to slow in the next decade due to land, water and rural labour constraints. 

Presenting the joint report in Beijing, OECD Secretary-General Angel Gurría said:  “The outlook for global agriculture is relatively bright with strong demand, expanding trade and high prices. But this picture assumes continuing economic recovery. If we fail to turn the global economy around, investment and growth in agriculture will suffer and food security may be compromised. (Read Mr. Gurría’s speech)”

“Governments need to create the right enabling environment for growth and trade,” he added. “Agricultural reforms have played a key role in China’s remarkable progress in expanding production and improving domestic food security.”

FAO Director-General Jose Graziano da Silva said: “High food prices are an incentive to increase production and we need to do our best to ensure that poor farmers benefit from them.  Let’s not forget that 70 percent of the world’s food insecure population lives in rural areas of developing countries and that many of them are small-scale and subsistence farmers themselves.”

He added:  “China’s agricultural production has been tremendously successful. Since 1978, the volume of agricultural production has grown almost five fold and the country has made significant progress towards food security. China is on track to achieving the first millennium development goal of hunger reduction.

While China’s production has expanded and food security has improved, resource and environmental issues need more attention. Growth in livestock production could also face a number of challenges. We are happy to work with China to find viable and lasting solutions.” 

Developing countries to gain

Driven by growing populations, higher incomes, urbanization and changing diets, consumption of the main agricultural commodities will increase most rapidly in Eastern Europe and Central Asia, followed by Latin America and other Asian economies.

The share of global production from developing countries will continue to increase as investment in their agricultural sectors narrows the productivity gap with advanced economies. Developing countries, for example, are expected to account for 80 percent of the growth in global meat production and capture much of the trade growth over the next 10 years. They will account for the majority of world exports of coarse grains, rice, oilseeds, vegetable oil, sugar, beef, poultry and fish by 2022.

To capture a share of these economic benefits, governments will need to invest in their agricultural sectors to encourage innovation, increase productivity and improve integration in global value chains, FAO and OECD stressed.

Agricultural policies need to address the inherent volatility of commodity markets with improved tools for risk management while ensuring the sustainable use of land and water resources and reducing food loss and waste.

Specifically in the US, droughts and extreme weather conditions have been the principal factors influencing supply. Water remains a scare and undervalued resource but improvements in technology and farming methods are ongoing. Nonetheless, prices for irrigated farm land have been making new highs during the year. Below are a series of Ten Year monthly charts of Wheat, Corn and Soybeans. The price spike of 2008 is evident in each case and the subsequent rally of Corn and Soybeans to make new highs in 2012. However, during 2013, despite another year of droughts, prices have remained subdued. Nonetheless, prices appear to be near to the base of their long-term up-trends.

Wheat

Wheat - 10yr chart

.

.

.

Source:Tradingcharts.com

Corn

Corn - 10yr chart

.

.

.

Source: Tradingcharts.com


Soybeans

Soybeans - 10yr chart

.

.

.

Source: tradingcharts.com

The latest USDA reports (December 2013) can be found here: –

Wheat

http://www.ers.usda.gov/publications/whs-wheat-outlook/whs-13l.aspx

Projected 2013/14 supplies are raised 10 million bushels this month to 3,008 million bushels. Production and carryin stocks are unchanged, but imports are raised to 10 million bushels to 160 million bushels with expected higher hard red spring (HRS) and soft red winter (SRW) imports from Canada, up 5 million bushels each.

Corn

http://www.ers.usda.gov/publications/fds-feed-outlook/fds-13l.aspx

Projected 2013/14 corn use is increased 100 million bushels this month, split evenly between fuel ethanol and exports. Margins have been very favorable for ethanol mills, with higher ethanol and distillers’ dried grains (DDG) prices on the revenue side combined with lower corn prices on the input side. Exports have benefitted from lower corn prices and increased global consumption. Increases in use are offset slightly by a 5-million-bushel increase in projected imports. Production and feed and residual are unchanged. Projected carryout is tighter by 95 million bushels, at 1.8 billion bushels, but still double last season’s estimate of 824 million. The 2013/14 season-average farm price for corn is projected 10 cents lower at the midpoint of $4.40 per bushel, with the range narrowed to $4.05 to $4.75 based on prices reported to date.

World coarse grain production for 2013/14 is projected higher this month led by increases for Canadian corn and barley, Australian barley, and Ukrainian corn. Global coarse grain use prospects increase slightly more than production increases, trimming expected global ending stocks.

Soybeans

http://www.ers.usda.gov/publications/ocs-oil-crops-outlook/ocs-13l.aspx

USDA raised its 2013/14 forecast of U.S. soybean exports this month by 25 million bushels to 1.475 billion. Similarly, 2013/14 exports of soybean meal were forecast 250,000 tons higher to 10.5 million short tons, which prompted an expected increase in the domestic soybean crush by 5 million bushels to 1.69 billion. An improved demand outlook lowered the forecast of season-ending soybean stocks by 20 million bushels this month to 150 million. USDA raised its forecast range for the season-average farm price by 35 cents this month to $11.50-$13.50 per bushel.

For Argentina, area reductions for corn and sunflowerseed led USDA to raise its 2013/14 soybean area estimate by 300,000 hectares this month to 20 million. As a result, Argentine soybean production is forecast 1 million tons higher to 54.5 million metric tons. Additional output of Argentine soybean meal may push exports of the commodity in 2013/14 to a record 29.4 million tons. Yet, Argentine soybean stocks could be higher by next September to 28.5 million tons.

None of these forecasts looks excessively constrained and the proximity to trend-line support makes me cautious in the near-term, a breakdown through the ten year up trend could see a retracement of the entire cycle.

A longer term factor which may yet change this dynamic dramatically is the effect of the “Eddy Minimum”.

For some general background on sunspots and climate, this Princeton University website is a useful resource: –

http://www.princeton.edu/~achaney/tmve/wiki100k/docs/Maunder_Minimum.html

The argument in favour of a cooling of global temperature is not new but for the latest comments on this subject the following website is informative: –

http://wattsupwiththat.com/2013/07/24/newsbytes-sunspot-enigma-will-inactive-sun-cause-global-cooling/

Conclusion

Throughout 2013 I waited for a resumption of the commodity bull-trend, expecting that the pick-up in economic activity, combined with the provision of central bank liquidity, would fuel the next leg of the super-cycle. It never materialised. Global growth remained subdued, China switched to a policy of “quality not quantity” and “taper terror” in the US, increased deflation expectations: and revealed weaknesses in a number of emerging markets. Even in the agricultural sector, weather related stress failed to materially reverse the downward pressure on prices.

Looking ahead to 2014 I can see little reason, thus far, to be broadly long commodities – as mentioned at the beginning I encourage all investors to view each market on its own particular merits. However, just like 2013, I am waiting for bearish sentiment to turn. To misquote St Augustine’s teenage prayer “Give me commodities Lord, but not yet!”

I’ll be back in mid January. With best wishes for the festive season and New Year. Col

Japan: The Coming Rise?

400dpiLogo

.

.

.

Macro Letter – No 1 – 6-12-2013

Welcome to my first blog. Those of you who have followed my commentary previously will be used to the eclectic mix of subjects I tend to write about. In my new blog I aim to expand on that reportage service by adding my own, more market centric, opinions.

Japan – The Coming Rise?

On the 4th December Bank of Japan (BoJ) board member Takehiro Sato gave an interesting speech on the prospects for the Japanese economy: –

http://www.boj.or.jp/en/announcements/press/koen_2013/data/ko131204a1.pdf

Japan’s economy has been recovering moderately. While it will be affected by the two scheduled consumption tax hikes, the economy is likely to continue growing at a pace above its potential, as a trend, on the assumption that the global economy will follow a moderate growth path…

… The growth rate for fiscal 2014 is likely to dip temporarily in the April-June quarter due to a decline in demand subsequent to the front-loaded increase in the previous quarters. However, I do not expect an economic downturn such as what we experienced at the time of the previous consumption tax hike in 1997. This is because the current economic situation differs in some aspects from that of the previous tax hike. Specifically, (1) the government is preparing an economic package with a total size of about 5 trillion yen; (2) emerging economies, some of which suffered from simultaneous declines in stock prices, bond prices, and in the value of their currencies this year, are becoming resilient to negative shocks compared to 1997, when the Asian currency crisis occurred, due to the establishment of backstops such as the accumulation of foreign reserves; and (3) Japan’s financial system has been stable as a whole.

Sato went on to predict above trend growth in 2014 H2. I think the majority of this information is priced into the market already.

BARCHART.COM - USD-JPY Weekly - December 2013.

.

.

Source: Barchart.com

Bigcharts - Nikkei 225 - December 2013.

.

.

Source: Big Charts

Despite the sharp correction since Tuesday,during the last few weeks the Japanese Yen (JPY) has begun a renewed decline (see weekly chart above). Earlier this year short JPY and long Nikkei futures (see daily chart above) proved to be an excellent trading opportunity. The election of Shinzo Abe (LDP) as the 90th Prime Minister in December 2012, with his “Three Arrows” policy, spelt hope for an economy which had been moribund, in GDP growth terms, for more than a decade. However, the present Japan story really begins on 25th April 1949 when the JPY was fixed against the US$ at a rate of JPY360 – this fixed rate remained in tact until the collapse of the Bretton Woods agreement in 1971. In the aftermath of WWII Japan, like Germany, took advantage of, what proved to be, a relatively low rate of exchange to rebuild their shattered economy. In the case of Japan one of the societal responses to the end of WWII was to encourage a nation of savers and investors.

As the US withdrew from Japan the political landscape became dominated by the LDP who were elected in 1955 and remained in power until 1993; they remain the incumbent and most powerful party in the Diet to this day. Under the LDP a virtuous triangle emerged between the Kieretsu (big business) the bureaucracy and the LDP. Brian Reading (Lombard Street Research) wrote an excellent, and impeccably timed, book entitled Japan: The Coming Collapse in 1989. By this time the virtuous triangle had become, what he coined the “Iron Triangle”.

Nearly twenty five years after the publication of Brian’s book, the” Iron Triangle” is weaker but alas unbroken. However, the election of Shinzo Abe, with his plan for competitive devaluation, fiscal stimulus and structural reform has given the electorate hope.  Abe’s “Three Arrows” policy takes its name from a 16th century Japanese legend which gives his proposal a cultural attraction, but he will need more than elegant words to overcome the difficulties of implementing the third arrow:-

Mori Motonari(1497 – 1571)ruler of the Chugoku area of Western Japan, found his land on the brink of war. He called his three eldest sons to his castle and gave the first an arrow, asking him to break it. Of course, his son easily broke the arrow in two. Then, Mori gathered three arrows together, gave them again to one of his sons, and asked him to break these three arrows, all together. His son tried with all his strength to break the arrows but it was impossible. Mori explained to his sons, “Just like one arrow, the power of just one person can easily be overcome. However, three arrows together cannot be destroyed. Human strength is the same as these arrows; we cannot be defeated if we work together.”

The BoJ’s 2% inflation target and policy of “quantitative and qualitative easing” (QQE) have been effective in managing market expectations – the JPY is lower and the Nikkei higher without too dramatic a backing up of Japanese Government Bond (JGB) yields. However, doubts about Abe’s ability to deliver the essential third arrow heralded a reversal of both JPY and the Nikkei during the summer. Now the JPY is declining once more and the Nikkei, rising – although other major stock markets have also performed strongly of late.

Is this the beginning of the next stage of the “Japan Trade” or are we merely witnessing year end rebalancing of portfolios?

Emerging Markets

To answer this question I believe we also need to consider the position of China, South Korea and other emerging markets. China is the growing regional hegemon within South East Asia and its territorial disputes with its neighbours around the South and East China Sea are likely to escalate – its announcement last month of the Air Defense Identification Zone (ADIZ) in the East China Sea is likely to sour relations with South Korea. This article from The Diplomat provides more information: –

http://thediplomat.com/2013/11/is-the-china-south-korea-honeymoon-over

Yet, at the same time China is an essential export market for these neighbours; according to a recent article from China Daily, Japan’s exports to China hit a four year low as a result of the rising military tensions surrounding the Senkaku/Diaoyu Islands : –

http://usa.chinadaily.com.cn/business/2013-08/15/content_16897913.htm

This year the US resumed its place as Japan’s largest export market, a position it had lost to China in 2009, however China is still a close second – although it also remains Japan’s largest import market.

For a broader review of the current geopolitical situation within the region, this week’s China-US Focus newsletter from the China – United States Exchange Foundation –  Japan and China: Courting Confrontation – is a useful resume:-

http://www.chinausfocus.com/foreign-policy/japan-and-china-courting-confrontation/

South Korea’s exports to China are also lower this year due to a slowing of Chinese growth, but, helped by stronger exports to Europe and the US, they have been able to support higher GDP growth – together with higher inflation – than Japan. The ending of the Iranian Oil embargo, easing upward geopolitical pressure on energy prices, will help South Korea maintain growth. Its exports to Japan have been strong throughout 2013. Nonetheless, the South Korean administration is extremely sensitive to a weakening JPY, notwithstanding the world class quality of a number of its exporters. Of course, lower oil prices will also benefit Japan but its energy consumption per capita is roughly 20% lower than that of South Korea.

The US has been leading the way with structural reform and parts of Europe have followed suit, however, a number of commentators have voiced concern about the need for emerging markets to embrace structural reform. Anders Aslund of the Peterson Institute had this to say: –

http://www.piie.com/publications/wp/wp13-10.pdf

The hypothesis of this paper is that the emerging market growth from 2000 to 2012 was atypically high and we might be back in a situation that is more reminiscent of the early 1980s. The growth of the last 12 years was neither sustainable nor likely to last. Several cycles that are much longer than the business cycle exist. One is the credit cycle, which Claudio Borio (2012) assesses at 15 to 20 years.

Another is the commodity cycle, which last peaked in 1980 and might last 30 to 40 years (Jacks 2013, Hendrix and Noland forthcoming). A third is the investment or Simon Kuznets cycle, which appears related to both the credit and commodity cycles (Kuznets 1958). A fourth cycle is the reform cycle, which might also coincide with the Kondratieff cycle (Rostow 1978).

The author goes on to highlight seven reasons why high emerging market growth will not continue at the pace of the past decade:-

1. One of the biggest credit booms of all time has peaked out. Extremely low interest rates cannot

continue forever. A normalization is inevitable. Many emerging economies are financially vulnerable

with large fiscal deficits, public debts, current account deficits, and somewhat high inflation. 

2. A great commodity boom has peaked out, as high prices and low growth depress demand, while the

high prices have stimulated a great supply shock. 

3. The investment or Simon Kuznets cycle has peaked out, as the very high Chinese investment ratio is

bound to fall and real interest rates to rise.

4. Because of many years of high economic growth, the catch-up potential of emerging economies has

been reduced and growth rates are set to fall ceteris paribus.

5. Many emerging economies carried out impressive reforms from 1980 to 2000, but much fewer

reforms have taken place from 2000 to 2012. The remaining governance potential for growth has

been reduced. Characteristically, reforms evolve in cycles that are usually initiated by a serious crisis,

and after 12 good years complacency has set in in the emerging economies.

6. Worse, the governments of many emerging economies are drawing the wrong conclusion from

developments during the Great Recession. Many think that state capitalism and industrial policy have

proven superior to free markets and private enterprise. Therefore, they feel no need to improve their

economic policies but are inclined to aggravate them further.

7. Finally, the emerging economies have benefited greatly from the ever more open markets of the

developed countries, while not fully reciprocating. The West is likely to proceed with selective,

regional trade agreements rather than with general liberalization.

I am more optimistic about EM growth than Peterson because of the underlying economic renaissance I believe is happening in the USA, combined with the benefits which will accrue from harnessing Big Data and the improving “health-span” (the upside of extended Life-span) over the next ten to twenty years.

Free Trade

A further factor to consider is the progress, or otherwise, of the Trans Pacific Partnership (TPP) and other agreements.  The European Centre for International Political Economy (ECIPE) has produced a timely up-date here: –

http://www.ecipe.org/media/publication_pdfs/ECIPE_bulletin_TPP_Nov_2013_final.pdf

The TPP is not the only Free Trade Agreement (FTA) on the agenda but the negotiations, even of bi-lateral FTAs, is so protracted that the financial markets are unlikely to afford them any credence until they are signed and sealed.

Demographics

As I mentioned earlier, historically Japan has been a nation of savers and investors. As JGB yields trended towards zero, investors looked for higher yields abroad. Today, in a world of near zero interest rates in the major economies, the “carry trade” is no longer the attraction it once was. More significantly, going forward, demographics will also change the direction of capital flows. Savers are retiring and become consumers. Foreign assets, which have gradually been repatriated during the last decade, will be eclipsed by consumption of foreign goods – the Japanese have been running a trade deficit since the beginning of 2012 – see the link below from Trading Economics:-

http://www.tradingeconomics.com/japan/balance-of-trade

Derivatives

The “carry trade” is discussed extensively in a recent working paper from the IMF – The Curious Case of the Yen – they make an impressive empirical case for a non-domestic cause of JPY “safe-haven” behaviour: –

http://www.imf.org/external/pubs/ft/wp/2013/wp13228.pdf

During risk-off episodes, the yen is a safe haven currency and on average appreciates against the U.S. dollar. We investigate the proximate causes of yen risk-off appreciations. We find that neither capital inflows nor expectations of the future monetary policy stance can explain the yen’s safe haven behavior. In contrast, we find evidence that changes in market participants’ risk perceptions trigger derivatives trading, which in turn lead to changes in the spot exchange rate without capital flows. Specifically, we find that risk-off episodes coincide with forward hedging and reduced net short positions or a buildup of net long positions in yen. These empirical findings suggest that offshore and complex financial transactions should be part of spillover analyses and that the effectiveness of capital flow management measures or monetary policy coordination to address excessive exchange rate volatility might be limited in certain cases.

The IMF concludes that the derivative “carry trade” is largely responsible for the safe-haven behaviour of the last few years:-

The evidence presented in this paper supports the interpretation of the yen as a currency with safe haven status. But safe haven effects work differently for the yen than for other safe haven currencies. Surprisingly and in contrast to the experience of the Swiss Franc, yen risk-off appreciations appears unrelated to capital inflows (cross-border transactions) and do not seem supported by expectations about the relative stance of monetary policies. Instead, we presented evidence that portfolio rebalancing through offshore derivative transactions occur contemporaneously to yen risk-off appreciations. This could reflect either a causal effect of portfolio rebalancing through derivative transactions or the workings of self-fulfilling expectations causing both currency appreciation and portfolio rebalancing.

Conclusion

In an unreformed developed economy like Japan the downside risks to growth remain and these risks temper my enthusiasm for Japanese stocks. Protracted fiscal stimulus by the Japanese government has been crowding out productive private investment for many years.  Japan and South Korea may have similar deflated GDP growth rates since 1997 but I would prefer to invest in a country where private domestic product is the engine of growth. Japanese stocks may rise as the JPY trends lower but the initial windfall to Japanese corporate profits is likely to be tempered by regulatory or tariff style retaliation from their neighbours and the need to repay Japanese government debt via taxation in the longer-term.

The JPY, however, is a different matter. Regulatory reforms such as the introduction of central counterparty, increasing margin requirements for OTC derivatives and the introduction of swap execution facilities (SEFs) are factors which should reduce the nominal size of the JPY “carry trade”.  The lower yield differential between the major currencies has also reduced the attraction of trade.  Demographic headwinds are now beginning to favour consumption over saving and Japanese government debt will need to be repaid in the fullness of time. Japanese corporations may defy gravity by overseas expansion but domestic firms will have to accept a protracted period of slow growth as the economy rebalances away from government spending towards private sector investment.

At the beginning of 2013, whilst I liked both trades, I advocated being long Nikkei futures rather than short JPY. Going into 2014 my preferences are reversed.