Macro Letter – No 66 – 25-11-2016
Protectionism: which countries have room for fiscal expansion?
- As globalisation goes into reverse, fiscal policy will take the strain
- Countries with government debt to GDP ratios <70% represent >45% of global GDP
- Fiscal expansion by less indebted countries could increase total debt by at least $3.48trln
…But now I only hear
Its melancholy, long, withdrawing roar…
Matthew Arnold – Dover Beach
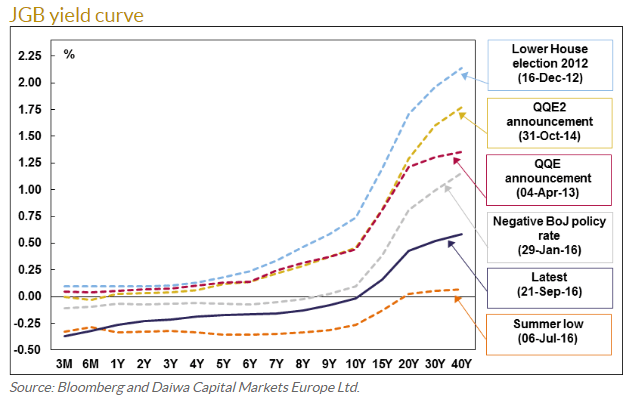
Over the course of 2016 the world’s leading central banks have subtly changed their approach to monetary policy. Although they have not stated that QE has failed to stimulate global growth they have begun to pass the baton for stimulating the world economy back to their respective governments.
The US election has brought protectionism and fiscal stimulus back to the centre of economic debate: but many countries are already saddled with uncomfortably high debt to GDP ratios. Which countries have room for manoeuvre and which governments will be forced to contemplate fiscal expansion to offset the headwinds of protectionism?
Anti-globalisation – the melancholy, long, withdrawing roar
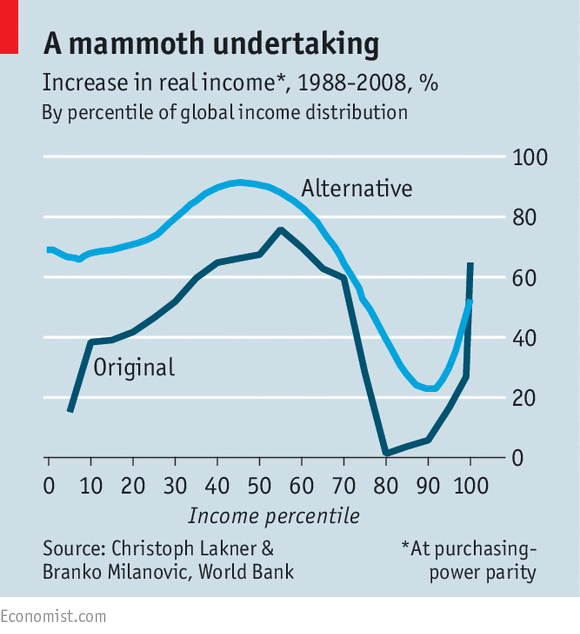
The “Elephant” chart below explains, in economic terms, the growing political upheaval which has been evident in many developed countries:-
Source: The Economist, World Bank, Lakner and Milanovic
This chart – or at least the dark blue line – began life in a World Bank working paper in 2012. It shows the global change in real-income, by income percentile, between 1988 and 2008. The Economist – Shooting an elephant provides more information.
What this chart reveals is that people earning between the 70th and 90th percentile have seen considerably less increase in income relative to their poor (and richer) peers. I imagine a similar chart up-dated to 2016 will show an even more pronounced decline in the fortunes of the lower paid workers of G7.
The unforeseen consequence to this incredible achievement – bringing so many of the world’s poor out of absolute poverty – has been to alienate many of the developed world’s poorer paid citizens. They have borne the brunt of globalisation without participating in much, if any, of the benefit.
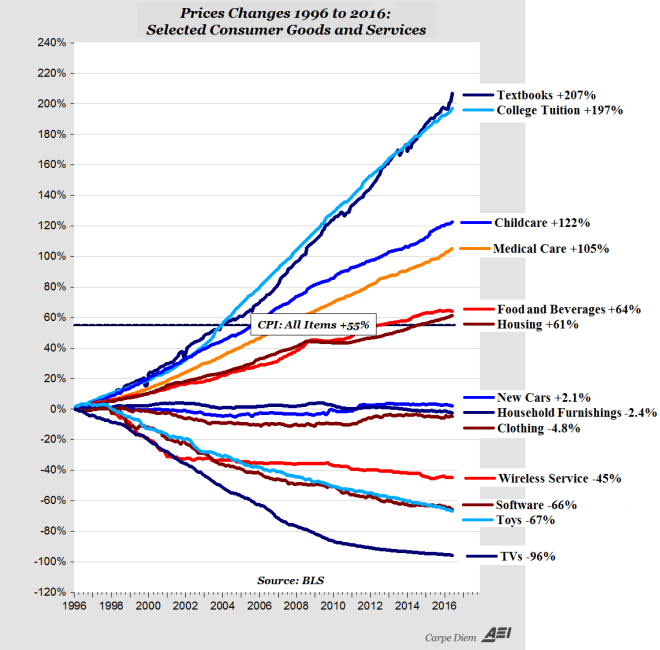
An additional cause for concern to the lower paid of the developed world is their real-inflation rate. The chart below shows US inflation for specific items between 1996 and 2016:-
Source: American Enterprise Institute
At least the “huddled masses yearning to breathe free” can afford a cheaper television, but this is little comfort when they cannot afford the house to put it in.
Anti-globalisation takes many forms, from simple regulatory protectionism to aspects of the climate-change lobby. These issues, however, are not the subject of this letter.
Which countries will lose out from protectionism?
It is too early to predict whether all the election promises of President-elect Trump will come to pass. He has indicated that he wants to impose a 35% tariff on Mexican and, 45% tariff on Chinese imports, renegotiate NAFTA (which the Peterson Institute estimate to be worth $127bln/annum to the US economy) halt negotiations of the TPP and TTIP and, potentially, withdraw from the WTO.
Looking at the “Elephant” chart above it is clear that, in absolute per capita terms, the world’s poorest individuals have benefitted most from globalisation, but the largest emerging economies have benefitted most in monetary terms.
The table below ranks countries with a GDP in excess of $170bln/annum by their debt to GDP ratios. These countries represent roughly 95% of global GDP. The 10yr bond yields were taken, where I could find them, on 21st November:-
| Country | GDP | Base Rate | Inflation | Debt to GDP | 10yr yield | Notes |
| Japan | 4,123 | -0.10% | -0.50% | 229% | 0.03 | |
| Greece | 195 | 0.00% | -0.50% | 177% | 6.95 | |
| Italy | 1,815 | 0.00% | -0.20% | 133% | 2.06 | |
| Portugal | 199 | 0.00% | 0.90% | 129% | 3.70 | |
| Belgium | 454 | 0.00% | 1.81% | 106% | 0.65 | |
| Singapore | 293 | 0.07% | -0.20% | 105% | 2.36 | |
| United States | 17,947 | 0.50% | 1.60% | 104% | 2.32 | |
| Spain | 1,199 | 0.00% | 0.70% | 99% | 1.60 | |
| France | 2,422 | 0.00% | 0.40% | 96% | 0.74 | |
| Ireland | 238 | 0.00% | -0.30% | 94% | 0.98 | |
| Canada | 1,551 | 0.50% | 1.50% | 92% | 1.57 | |
| UK | 2,849 | 0.25% | 0.90% | 89% | 1.41 | |
| Austria | 374 | 0.00% | 1.30% | 86% | 0.54 | |
| Egypt | 331 | 14.75% | 13.60% | 85% | 16.95 | |
| Germany | 3,356 | 0.00% | 0.80% | 71% | 0.27 | |
| India | 2,074 | 6.25% | 4.20% | 67% | 6.30 | |
| Brazil | 1,775 | 14.00% | 7.87% | 66% | 11.98 | |
| Netherlands | 753 | 0.00% | 0.40% | 65% | 0.43 | |
| Israel | 296 | 0.10% | -0.30% | 65% | 2.14 | |
| Pakistan | 270 | 5.75% | 4.21% | 65% | 8.03 | |
| Finland | 230 | 0.00% | 0.50% | 63% | 0.46 | |
| Malaysia | 296 | 3.00% | 1.50% | 54% | 4.39 | |
| Poland | 475 | 1.50% | -0.20% | 51% | 3.58 | |
| Vietnam | 194 | 6.50% | 4.09% | 51% | 6.10 | |
| South Africa | 313 | 7.00% | 6.10% | 50% | 8.98 | |
| Venezuela | 510 | 21.73% | 180.90% | 50% | 10.57 | |
| Argentina | 548 | 25.75% | 40.50% | 48% | 2.99 | |
| Philippines | 292 | 3.00% | 2.30% | 45% | 4.40 | |
| Thailand | 395 | 1.50% | 0.34% | 44% | 2.68 | |
| China | 10,866 | 4.35% | 2.10% | 44% | 2.91 | |
| Sweden | 493 | -0.50% | 1.20% | 43% | 0.52 | |
| Mexico | 1,144 | 5.25% | 3.06% | 43% | 7.39 | |
| Czech Republic | 182 | 0.05% | 0.80% | 41% | 0.59 | |
| Denmark | 295 | -0.65% | 0.30% | 40% | 0.40 | |
| Romania | 178 | 1.75% | -0.40% | 38% | 3.55 | |
| Colombia | 292 | 7.75% | 6.48% | 38% | 7.75 | |
| Australia | 1,340 | 1.50% | 1.30% | 37% | 2.67 | |
| South Korea | 1,378 | 1.25% | 1.30% | 35% | 2.12 | |
| Switzerland | 665 | -0.75% | -0.20% | 34% | -0.15 | |
| Turkey | 718 | 7.50% | 7.16% | 33% | 10.77 | |
| Hong Kong | 310 | 0.75% | 2.70% | 32% | 1.37 | |
| Taiwan | 524 | 1.38% | 1.70% | 32% | 1.41 | |
| Norway | 388 | 0.50% | 3.70% | 32% | 1.65 | |
| Bangladesh | 195 | 6.75% | 5.57% | 27% | 6.89 | |
| Indonesia | 862 | 4.75% | 3.31% | 27% | 7.85 | |
| New Zealand | 174 | 1.75% | 0.40% | 25% | 3.11 | |
| Kazakhstan | 184 | 12.00% | 11.50% | 23% | 3.82 | *** |
| Peru | 192 | 4.25% | 3.41% | 23% | 6.43 | |
| Russia | 1,326 | 10.00% | 6.10% | 18% | 8.71 | |
| Chile | 240 | 3.50% | 2.80% | 18% | 4.60 | |
| Iran | 425 | 20.00% | 9.50% | 16% | 20.00 | ** |
| UAE | 370 | 1.25% | 0.60% | 16% | 3.57 | * |
| Nigeria | 481 | 14.00% | 18.30% | 12% | 15.97 | |
| Saudi Arabia | 646 | 2.00% | 2.60% | 6% | 3.97 | * |
Notes
*Estimate from recent sovereign issues
**Estimated 1yr bond yield
***Estimated from recent US$ issue
Source: Trading economics, Investing.com, Bangledesh Treasury
Last month in their semi-annual fiscal monitor – Debt: Use It Wisely – the IMF warned that global non-financial debt is now running at $152trln or 225% of global GDP, with the private sector responsible for 66% – a potential source of systemic instability . The table above, however, shows that many governments have room to increase their debt to GDP ratios substantially – which might be of luke-warm comfort should the private sector encounter difficulty. Interest rates, in general, are at historic lows; now is as good a time as any for governments to borrow cheaply.
If countries with government debt/GDP of less than 70% increased their debt by just 20% of GDP, ceteris paribus, this would add $6.65trln to total global debt (4.4%).
Most Favoured Borrowers
Looking more closely at the data – and taking into account budget and current account deficits -there are several governments which are unlikely to be able to increase their levels of debt substantially. Nonetheless, a sizable number of developed and developing nations are in a position to increase debt to offset the headwinds of US protectionism should it arrive.
The table below lists those countries which could reasonably be expected to implement a fiscal response to slower growth:-
| Country | GDP | Debt to GDP | 10yr yield | Gov. Debt | 70% Ratio | 90% Ratio | 12m fwd PE | CAPE | Div Yld. |
| Saudi Arabia | 646 | 6% | 3.97 | 38 | 452 | 581 | ? | ? | ? |
| Chile | 240 | 18% | 4.60 | 42 | 168 | 216 | 15.6 | ? | ? |
| New Zealand | 174 | 25% | 3.11 | 43 | 122 | 157 | 19.3 | 22 | 4.1% |
| Peru | 192 | 23% | 6.43 | 44 | 134 | 173 | 12.1 | ? | ? |
| Bangladesh | 195 | 27% | 6.89 | 53 | 137 | 176 | ? | ? | ? |
| UAE | 370 | 16% | 3.57 | 58 | 259 | 333 | ? | ? | ? |
| Colombia | 292 | 38% | 7.75 | 111 | 204 | 263 | ? | ? | ? |
| Norway | 388 | 32% | 1.65 | 123 | 272 | 349 | 14.2 | 11.5 | 4.3% |
| Philippines | 292 | 45% | 4.40 | 132 | 204 | 263 | 16.4 | 22.6 | 1.6% |
| Malaysia | 296 | 54% | 4.39 | 160 | 207 | 266 | 15.6 | 16 | 3.1% |
| Taiwan | 524 | 32% | 1.41 | 166 | 367 | 472 | 12.8 | 19 | 3.9% |
| Thailand | 395 | 44% | 2.68 | 175 | 277 | 356 | 13.8 | 17.7 | 3.1% |
| Israel | 296 | 65% | 2.14 | 192 | 207 | 266 | 9.4 | 14.6 | 2.8% |
| Sweden | 493 | 43% | 0.52 | 214 | 345 | 444 | 16.1 | 19.8 | 3.6% |
| Indonesia | 862 | 27% | 7.85 | 233 | 603 | 776 | 14.7 | 19.6 | 1.9% |
| South Korea | 1,378 | 35% | 2.12 | 484 | 965 | 1,240 | 9.6 | 13.1 | 1.7% |
| Australia | 1,340 | 37% | 2.67 | 493 | 938 | 1,206 | 15.6 | 16.1 | 4.3% |
| Mexico | 1,144 | 43% | 7.39 | 494 | 801 | 1,030 | 16.6 | 22.4 | 1.9% |
| India | 2,074 | 67% | 6.30 | 1,394 | 1,452 | 1,867 | 15.9 | 18.6 | 1.5% |
| 4,649 | 8,114 | 10,432 |
Source: Trading economics, Investing.com, Bangledesh Treasury, Star Capital, Yardeni Research
The countries in the table above – which have been ranked, in ascending order, by outstanding government debt – have total debt of $4.65trln. If they each increased their ratios to 70% they could raise an additional $3.47trln to lean against an economic downturn. A 90% ratio would see $5.78trln of new government debt created. This is the level above which economies cease to benefit from additional debt according to Reinhart and Rogoff in their paper Growth in a Time of Debt.
Whilst this analysis is overly simplistic, the quantum of new issuance is not beyond the realms of possibility – India’s ratio reached 84% in 2003, Indonesia’s, hit 87% in 2000 and Saudi Arabia’s, 103% in 1999. Nonetheless, the level of indebtedness is higher than many countries have needed to entertain in recent years – ratios in Australia, Mexico and South Korea, though relatively low, are all at millennium highs.
Apart from the domestic imperative to maintain economic growth, there will be pressure on these governments to pull their weight from their more corpulent brethren. Looking at the table above, if the top seven countries, by absolute increased issuance, raised their debt/GDP ratios to 90%, this would add $3.87trln to global debt.
Despite US debt to GDP being above 100%, the new US President-elect has promised $5.3trln of fiscal spending during his first term. Whether this is a good idea or not is debated this week by the Peterson Institute – What Size Fiscal Deficits for the United States?
Other large developed nations, including Japan, are likely to resort to further fiscal stimulus in the absence of leeway on monetary policy. For developing and smaller developed nations, the stigma of an excessively high debt to GDP ratio will be assuaged by the company keep.
Conclusions and investment opportunities
Despite recent warnings from the IMF and plentiful academic analysis of the dangers of excessive debt – of which Deleveraging? What Deleveraging? is perhaps the best known – given the way democracy operates, it is most likely that fiscal stimulus will assume the vanguard. Monetary policy will play a supporting role in these endeavours. As I wrote in – Yield Curve Control – the road to infinite QE – I believe the Bank of Japan has already passed the baton.
Infrastructure spending will be at the heart of many of these fiscal programmes. There will be plenty of trophy projects and “pork barrel” largesse, but companies which are active in these sectors of the economy will benefit.
Regional and bilateral trade deals will also become more important. In theory the EU has the scale to negotiate with the US, albeit the progress of the TTIP has stalled. Asean and Mercosur have an opportunity to flex their flaccid muscles. China’s One Belt One Road policy will also gain additional traction if the US embark on policies akin to the isolationism of the Ming Dynasty after the death of Emperor Zheng He in 1433. The trade-vacuum will be filled: and China, despite its malinvestments, remains in the ascendant.
According to FocusEconomics – Economic Snapshot for East & South Asia – East and South Asian growth accelerated for the first time in over two years during Q3, to 6.2%. Despite the economic headwinds of tightening monetary and protectionist trade policy in the US, combined with the very real risk of a slowdown in the Chinese property market, they forecast only a moderate reduction to 6% in Q4. They see that growth rate continuing through the first half of 2017.
Indian bond yields actually fell in the wake of the US election – from 6.83% on 8th to 6.30% by 21st. This is a country with significant internal demand and capital controls which afford it some protection. Its textile industry may even benefit in the near-term from non-ratification of the TPP. Indian stocks, however are not particularly cheap. With a PE 24.3, CAPE 18.6, 12 month forward PE 15.9 the Sensex index is up more than 70% from its December 2011 lows.
Stocks in Israel, Taiwan and Thailand may offer better value. They are the only emerging countries which offer a dividend yield greater than their bond yield. Taiwanese stocks appear inexpensive on a number of other measures too. With East and South Asian growth set to continue, emerging Asia looks most promising.
A US tax cut will stimulate demand more rapidly than the boost from US fiscal spending. Protectionist tariffs may hit Mexico and China rapidly but other measures are likely to be implemented more gradually. As long as the US continues to run a trade deficit it makes sense to remain optimistic about several of the emerging Asian markets listed in the table above.