The Fourth Arrow Option – how Japan may side-step structural reform

400dpiLogo

Macro Letter – No 16 – 18-07-2014

The Fourth Arrow Option – how Japan may side-step structural reform

  • The Third Arrow is hard to deliver but the Fourth Arrow has already been unleashed
  • State and private investments will switch to equities and real-estate
  • The “monetary extortion” of negative real interest rates is here to stay

The First Three Arrows

Mori Motonari (1497 – 1571) was the ruler of the Chugoku area of Western Japan. His land was on the brink of war so he summoned his three eldest sons and gave the first an arrow, asking him to break it. Of course, his son easily broke the arrow in two. Then, Mori gathered three arrows together, gave them again to one of his sons, and asked him to break these three arrows, all together. His son tried with all his strength to break the arrows but it was impossible. Mori explained to his sons, “Just like one arrow, the power of just one person can easily be overcome. However, three arrows together cannot be destroyed. Human strength is the same as these arrows; we cannot be defeated if we work together.”

Abenomics

Today the Three Arrows describe Shinzo Abe’s economic policy:-

Arrow one –        Monetary stimulus by the Bank of Japan (BoJ)

Arrow two –        Tax cuts by the LDP government

Arrow three –    Structural reform

The first arrow has been unleashed with vigour by the BoJ as they target 2% inflation. The most recent CPI was +3.7% in May up from 3.4% in April. Job done? Probably not – prior to April the CPI had struggled to manage 1.5% and even the BoJ acknowledge that the recent rise is due to the consumption tax increase being largely passed on to consumers.

The second arrow has been enfeebled by the imposition of a sales tax increase in April 2014, although the June 25th announcement of corporate tax cuts from April 2015 should lend it some renewed strength. Japanese companies held a record JPY222 trn in cash at the end of 2013. A cut in corporate tax to below the rate of Germany (<30%) will be an incentive to invest at home rather than overseas. In Q4 2013 Japanese corporate invested JPY69 trn abroad – up 40% on the same period in 2012.

The third arrow is “structural reform” but, as any democratically elected politician will tell you, that is a job best left to ones successor. So far there have been tentative attempts to reform agriculture and healthcare.  Policies to encourage immigration and to promote female participation in the labour force are still awaited. As are the signing of free trade agreements with the EU, US and Japan’s Asian neighbours. To check on the glacial progress of the TTP the Office of the US trade Representative is a good starting point.

With only one well honed arrow, the quiver looks bereft. But a Fourth Arrow – asset reallocation to domestic stocks – has been unleashed with stealth. Whether or not it hits its intended target, it will benefit a couple of asset classes in particular.

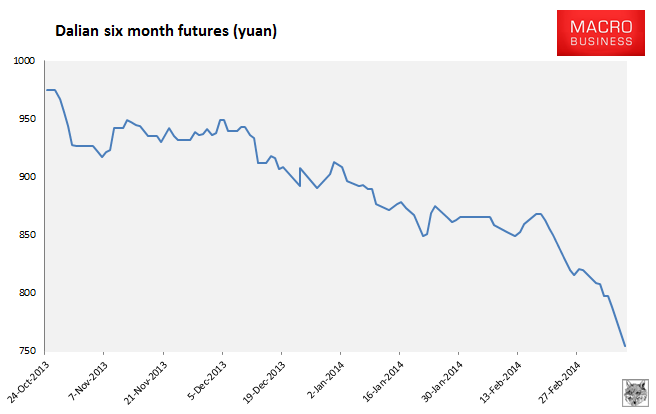
Before examining the Fourth Arrow Option, however, I want to review the recent price action in the JPY, JGB and Nikkei.

The Yen that will not fall

 USDJPY 3yr weekly - Barchart.com

Source: Barchart.com

When the JPY broke out of its range to the downside at the end of 2013 I thought we might see another wave of depreciation, but during the first half of 2014 the currency has been range-bound despite continued BoJ quantitative and qualitative easing (QQE). The relative magnitude of this QQE is demonstrated by the chart below:-

Total central bank assets as percentage of GDP - BIS

Source:BIS- Bloomberg- Datastream – National Data

Like other major central banks, the BoJ is wrestling with the vexing issue of “transmission” – QQE has improved the fiscal position of Japanese banks but it has done little to stimulate credit demand in the wider economy. A significant portion of economic activity was front-loaded into the first quarter of 2014 to avoid the sales tax increase in April. Since then economic data has been weak. This was anticipated, and articulated, by the BoJ so it has largely been discounted by the markets – except, perhaps, JGBs which are toying with all-time low yields again this week (currently 0.54%).

The corporate tax cuts next April are estimated to lead to an increased stock market valuation of around 0.60%. This is hardly going to transform private sector investment decisions. The chart below from the Federal Reserve shows the anaemic expansion of credit despite the well heralded “Abenomics” package:-

Japan Credit - Federal Reserve

Source: Federal Reserve

Some economists have argued that the absence of private credit growth is due to a lack of demand for credit. This absence, is thought to stem from entrenched deflationary expectations. I believe this is only part of the story; of much greater importance is the lack of private sector opportunity due to the increasing scale of the public sector. The chart below shows the divergence between private investment and government consumption.

Japan Real GDP and Expenditure - David Andolfatto

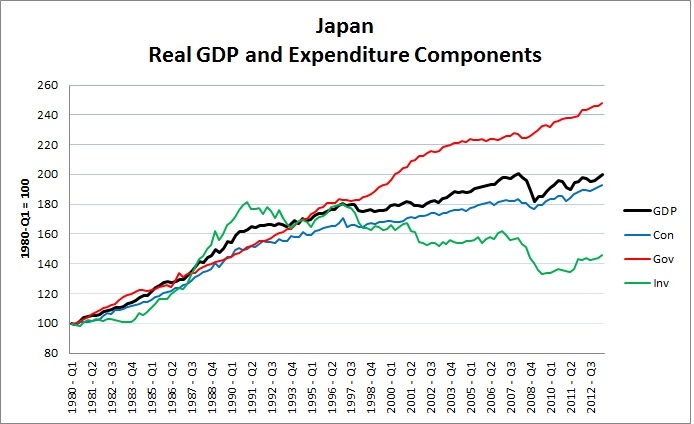
Source: David Andolfatto

For those who wish to investigate this concept more closely, Federal Reserve Bank of St Louis head of research, David Andolfatto’s post, on his private blog site, What’s up with Japan? (G , evidently) makes interesting reading.

Meanwhile the fall in value of the JPY from October 2012 to April 2013 has not delivered a significant increase in export activity. This puzzle is examined in an interesting post by the New York Federal Reserve from July 7thWhy Hasn’t the Yen Depreciation Spurred Japanese Exports?:-

… we show that a key to understanding why there is low pass-through from exchange rates into export prices is that large exporters are also large importers, so they face offsetting exchange rate effects on their marginal costs. In the case of Japan, the connection between the yen and production costs has been made stronger since the country replaced nuclear power with imported fuels in the aftermath of the 2011 earthquake.

Developed country manufacturers are significant importers of semi-manufactured goods. A fall in the exchange rate makes these imports more expensive so the comparative advantage for exporters of finished goods is diminished by the increase in production input costs. Japanese import prices have stabilised along with the currency but higher import prices should support the BoJ in their attempts to meet the 2% inflation target for a while at least.

BoJ Guidance

The BoJ are decidedly more optimistic about the prospects for the Japanese economy. In a speech given on 19th June, entitled Economic Activity and Prices in Japan and Monetary Policy – BoJ policy board member Morimotomade the following remarks: –

On the effect of the consumption tax:-

Since the start of fiscal 2014, a subsequent decline in demand following the front-loaded increase prior to the consumption tax hike has been observed, mainly in private consumption, such as of durable goods, but domestic demand including business fixed investment has remained firm as a trend. Therefore, a virtuous cycle of economic activity has been operating firmly, accompanied by steady improvements in supply and demand conditions in the labor market. In this situation, the economy has continued to recover moderately as a trend.

On consumption and investment:-

Looking at domestic demand, private consumption and housing investment have remained resilient as a trend with improvement in the employment and income situation, although a subsequent decline in demand following the front-loaded increase has recently been observed. Business fixed investment has increased moderately as corporate profits have improved; for example, on a GDP basis, it increased in the January-March quarter of 2014 for the fourth consecutive quarter, and thus is growing at an accelerated pace. Public investment continues to increase, due in part to the effects of various economic measures, and has more or less leveled off recently at a high level.

On inflation:-

The rate of increase for April 2014 registered 3.2 percent, and on a basis excluding the direct effects of the consumption tax hike, it marked 1.5 percent, which is somewhat higher than the rate for March. Given this, the tax increase appears to have been passed on to prices on the whole, on the back of resilient private consumption. As for the outlook, although the effects of the upward pressure from energy-related goods that are directly affected by foreign exchange rates are likely to subside through this summer, the year-on-year rate of increase in the CPI (all items less fresh food), excluding the direct effects of the consumption tax hike, is likely to be around 1¼ percent for some time.

However on wages he makes these observations:-

The tightening of supply and demand conditions in the labor market is starting to influence wages. Hourly cash earnings of overall employees have started to increase moderately, albeit with fluctuations. According to the currently available aggregate results of wage negotiations compiled by the Japanese Trade Union Confederation (Rengo), wage negotiations this spring are expected to result in a rise by firms, including small firms, of around 0.5 percent in base pay, and about 2.1 percent in overall wages.

He is sanguine about business investment:-

In order to achieve sustainable growth of the economy, it is important that improvements in corporate profits and increases in demand lead to firms’ active investment. Corporate profits for fiscal 2013 rose significantly. As for fiscal 2014, firms have relatively conservative fixed investment plans at present. However, supported by a moderate increase in exports and developments in the foreign exchange market, in addition to firm domestic demand, corporate profits are expected to continue their improving trend.

Morimoto concludes with forward guidance about monetary policy and loan facilities going forward:-

First, with a view to pursuing quantitative monetary easing, the Bank decided to increase the monetary base — which is the total amount of currency it directly supplies to the economy (the sum of banknotes in circulation, coins in circulation, and current account deposits held by financial institutions at the Bank) — at an annual pace of about 60-70 trillion yen, thus doubling it in two years. Second, to achieve this, the Bank has been purchasing Japanese government bonds (JGBs) so that their amount outstanding increases at an annual pace of about 50 trillion yen. In doing so, the Bank has been working on interest rates across the yield curve — including longer-term ones — setting the average remaining maturity of its JGB purchases at about seven years. And third, the Bank has been purchasing exchange-traded funds (ETFs) and Japan real estate investment trusts (J-REITs) so that their amounts outstanding increase at an annual pace of about 1 trillion yen and about 30 billion yen, respectively.

… To support full use of the accommodative financial conditions by firms and households, the Bank — in addition to implementing aggressive monetary easing measures — has established the Loan Support Program through which it provides long-term funds at a low interest rate to financial institutions. Specifically, the Bank has been providing funds through two measures that constitute the program: the fund-provisioning measure to stimulate bank lending (hereafter the Stimulating Bank Lending Facility) and the fund-provisioning measure to support strengthening the foundations for economic growth (hereafter the Growth-Supporting Funding Facility). At the Monetary Policy Meeting held in February 2014, the Bank decided to enhance the two facilities.

A more recent speech by Deputy Governor Nakaso – Japan’s Economy and Monetary Policy – given on the 8th July, to an international audience, examines some of the criticisms of QQE: –

The first criticism is that the year-on-year rate of increase in the CPI is unlikely to reach about 2 percent — the price stability target — in or around fiscal 2015 as forecasted by the Bank. In fact, although many private sector economists have recently revised their inflation forecasts upward, these forecasts continue to be conservative compared to that of the Bank. Since QQE is an unprecedented policy, we understand that there remains skepticism regarding the policy’s effectiveness.

However, looking at price developments over the course of the past year, the inflation rate has no doubt been much higher than many had forecasted at the time of the introduction of QQE in April last year. That is, inflation over the past year has been above levels suggested by the relationship between the output gap and inflation data for recent years. This implies that inflation expectations have been edging up. The Bank will therefore continue with QQE, aiming to achieve the price stability target, as long as it is necessary for maintaining that target in a stable manner. Of course, if the outlook changes and if it is judged necessary for achieving the price stability target of 2 percent, the Bank will make adjustments without hesitation.

The second criticism focuses on potential difficulties related to exiting from QQE. In particular, there are concerns that, even after achieving the price stability target of 2 percent, the Bank might be obliged to continue its massive purchases of government bonds due to considerations of the fiscal situation. On the issue of exit, let me mention just two points.

First, the Bank is pursuing QQE and purchasing government bonds solely to achieve the price stability target of 2 percent. The Bank has no intention to go beyond this objective and monetize government debt. Second, the Bank of Japan is the only central bank which has hands-on experience in exiting from unconventional monetary policy. At the time when the Bank exited from QE, which lasted from 2001 to 2006, I was responsible for market operations as the head of the Financial Markets Department of the Bank. While of course QE and QQE are different, in my view, the Bank already has an extensive range of operational instruments to exit from QQE. That being said, what I would like to emphasize is that the Bank is still in the midst of striving to achieve the price stability target of 2 percent at the earliest possible time, and exit policies should be designed depending on the then prevailing economic and inflation situation. Therefore, it would be premature to discuss the specifics of an exit at this stage.

Nakaso concludes by examining the challenges facing the Japanese economy: –

I pointed out that one of the factors behind the rise in the year-on-year rate of change in the CPI is that the output gap has been narrowing and recently has reached around 0 percent, that is, the long-term average. This is mainly due to the increase in demand accompanying the moderate economic recovery. But from a somewhat longer-term perspective, it is also due to a decline in supply capacity in the economy. In fact, Japan’s potential growth rate has been on a downtrend since the 1990s.

The potential growth rate is determined by the growth in labor input, capital input, and improvements in productivity through innovation and the like. Let me review the trends in these three sources of growth — labor input, capital input, and productivity — that underlie the downtrend in the potential growth rate.

First, labor input has been substantially affected by demographic changes. While demographic changes due to aging can be seen in many advanced economies, such changes have been much more pronounced in Japan than elsewhere (Chart 14). These demographic changes have been one factor putting downward pressure on the potential growth rate through the decline in labor supply.

Second, capital accumulation has slowed because Japanese firms were weighed down by the need to resolve the problem of excess capital stock during the process of adjusting their balance sheets following the burst of the bubble. In addition, protracted deflation reduced firms’ investment appetite and resulted in the deferral of business fixed investment.

Third, productivity growth has also declined. One reason is that while concentrating on dealing with the aftermath of the bubble, Japanese firms were unable to adapt fully to major changes in the global economy such as advances in information and communication technology and intensified global competition. In addition, in the aforementioned deflationary equilibrium, innovation by firms was stifled and productivity growth thus subdued for a protracted period.

 The Fourth Arrow and the stock market

In its broadest terms the “Fourth Arrow” is “government sponsored” provision of permanent capital to the private sector with the intention of stimulating private sector investment. This could take the form of private equity and infrastructure allocations but will be more substantial, and visible, in the domestic equity market. In fact the process is already well underway both by government fiat and by the “monetary extortion” of negative real interest rates.

TheGovernment Pension Investment Fund (GPIF), rather conveniently, raised it target equity allocation from 18% to 26% at the end of 2013. At the end of 2013 fiscal year the fund allocation to domestic equities was 16.47% (JPY20 trn) and 15.59% to international stocks. Domestic bonds still represented more than 55% of the portfolio. Assuming they allocate evenly between domestic and international stocks, the new capital allocation to Japanese stocks will be of the order of JPY6 trn – but I suspect their will be pressure to invest domestically and the figure will be nearer twice that amount.

The latest World Bank estimate for the total market capitalisation of the Japanese Stock market from December 2012 was US$3.7trn (JPY370 trn) but the Nikkei 225 is around 50% higher since then. A much larger source of domestic equity investment may emanate from retail savings accounts due to the negative real interest rate policies of the BoJ. The recent increase in CPI means that the real yield on 10 yr JGBs is now -3.16%. After 2008 JGB yields fell in tandem with CPI but since 2010 this correlation has broken down.

The economic theories of Hyman Minsky and Charles Kindleberger suggest that higher levels of debt will slow economic growth if it is skewed towards borrowing that doesn’t create an income stream sufficient to repay principal and interest. This is why I think JGB yields are likely to remain at these low yield levels for some time to come.  The Japanese Personal Savings Rate remains at extremely low levels (currently 0.6% vs a pre-1989 level of more than 20%) and outstanding Government debt continues to grow the current ratio of debt to GDP is 227% up from 167% in 2008. From an investment perspective I see little value in JGBs but that doesn’t mean I am bearish – I expect the market to move sideways.

JGB 10 yr yield - monthly 2008 - 2014

Source: Trading Economics

Returning to the prospects for the Japanese stock market, another, even larger, pool of capital is likely to be redirected into Japanese stocks.  Research by Nomura suggests that retail investors in Nippon Individual Savings Accounts (NISA) could switch up to JPY70trn (around 12% of total stock market capitalisation) of their holdings to equities as a result of negative real JGB yields. Japanese household have historically maintained a low exposure to equities – there is now a real incentive for these investors to increase their exposure to risky assets.

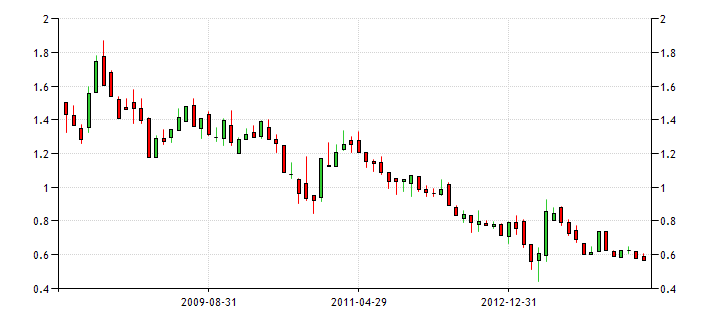
On certain measures Japanese stocks look undervalued. The chart below shows (with some gaps in the data) the P/E ratio for the Nikkei 225 over the past 20 yrs. The current ratio is at the lower end of its range despite a substantial rise in the index between 2012 and 2013:-

Nikkei 255 - PE Ratio - 20yr

Source: Tokyo Stock Exchange

Analysis of the cyclically adjusted P/E by Capital Economics late last year prompted them to conclude that the market was already slightly overvalued by recent standards. They went on to point out that the late 1980’s boom substantially distorted the average P/E ratios. In other words, stocks aren’t as cheap as the might at first appear. An analysis of the ROE of the MSCI Japan index supports this view – at 8.46% it is ranked 28th out of 32 MSCI country indices.

The recent release of Machinery Orders for May at -30.5% shocked economic commentators – it was the sharpest decline since 2005. The stock market took the datum in its stride.

The Fourth Arrow and real-estate

In May 2013 the OECD – Focus on house prices – paper analysed the disparity between house price valuations in different developed countries. Here is a table from their report: –
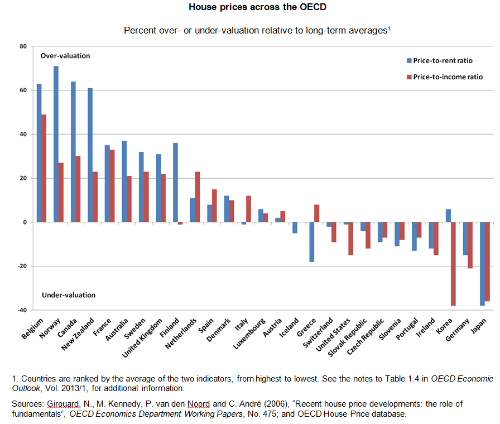
House Prices - OECD

Source: OECD

Partly as a result of BoJ buying of REITs Japanese real-estate turnover increased by 70% between 2012 and 2013. Land prices in the Tokyo, Yokohama and Osaka have risen this year for the first time since 2008. With other central banks actively seeking to temper the overvaluation of their own housing stock I expect to see international as well as domestic capital flows targeting real-estate.

Conclusion

Domestic and international capital will flow into Japanese stocks and real-estate following the lead of the BoJ. The QQE policy of the BoJ will continue to target 2% inflation but the JPY will be subject to a tug-of-war. The BoJ’s attempts to weaken the JPY are likely to be undermined by inward international capital flows. The Japanese government may use geopolitical tensions with China to undermine confidence in the JPY. This article from the AIJSS – The Role of Japan’s National Security Council – may appear benign but I encourage you to read between the lines.  JGBs will remain range-bound, real interest rates, negative and growth, anaemic. The beneficiary of the dismal anodyne will be the Japanese stock market which will outperform several of its low growth peers over the next few years.


Will the next phase of easing be “qualitative” ? Purchasing common stock

400dpiLogo

  • How can central banks normalise interest rates without puncturing the recovery?
  • Will long-term capital smooth the economic cycle?
  • What does “qualitative easing” mean for equities?


Last month saw the release of a report by the OMFIF – Global Public Investors – the new force in markets.These quotes are from their press release:-

Central banks around the world, including in Europe, are buying increasing volumes of equities as part of diversification by official asset holders that are now a global force on international capital markets. This is among the findings of Global Public Investor (GPI) 2014, the first comprehensive survey of $29.1tn worth of investments held by 400 public sector institutions in 162 countries.

The report, focusing on investments by 157 central banks, 156 public pension funds and 87 sovereign funds, underlines growing similarities among different categories of public entities owning assets equivalent to 40% of world output.

…One of the reasons for the move into equities reflects central banks’ efforts to compensate for  lost revenue on their reserves, caused by sharp falls in interest rates driven by official institutions’ own efforts to repair the financial crisis. According to OMFIF calculations, based partly on extrapolations from published central bank data, central banks around the world have foregone $200bn to $250bn in interest income as a result of the fall in bond yields in recent years.

…The survey emphasises the two-edged nature of large volumes of extra liquidity held by GPIs. These assets have been built up partly as a result of efforts to alleviate the financial crisis, through foreign exchange intervention by central banks in emerging market economies or quantitative easing by central banks in the main developed countries. But deployment of these funds on capital markets can drive up asset prices and is thus a source of further risks. ‘Many of these challenges [faced by public entities] are self-feeding’, the report says. ‘The same authorities that are responsible for maintaining financial stability are often the owners of the large funds that have the potential to cause problems.’

The report looks at Sovereign Wealth and Pension Funds as well as Central Banks but the trend towards diversification into equities should not be a surprise. In many countries official interest rates are below even official measures of inflation. It is a long time since government bonds were capable of providing sufficient income to match long term liabilities, but the recent fall in interest rates since the great financial recession has forced these institutions to diversify into higher risk assets.

China’s SAFE (State Administration for Foreign Exchange) has now become the world’s largest holder of publicly traded equities. They have established minority stakes in a number of European companies. Central Banking Publications found that 23 percent of Central Banks surveyed said they own shares or plan to buy them. Back in April the BoJ said it will more than double investments in equity exchange-traded funds to 3.5 trl yen this year.  Abe’s third arrow is looking feeble – buying a basket of Nikkei 225 names would be an expedient solution to his political woes.

The BIS – 84th Annual Report – released last week, focussed on the need to move away from debt:-

The main long-term challenge is to adjust policy frameworks so as to promote healthy and sustainable growth. This means two interrelated things.

The first is to recognise that the only way to sustainably strengthen growth is to work on structural reforms that raise productivity and build the economy’s resilience.

…The second, more novel, challenge is to adjust policy frameworks so as to address the financial cycle more systematically. Frameworks that fail to get the financial cycle on the radar screen may inadvertently overreact to short-term developments in output and inflation, generating bigger problems down the road. More generally, asymmetrical policies over successive business and financial cycles can impart a serious bias over time and run the risk of entrenching instability in the economy. Policy does not lean against the booms but eases aggressively and persistently during busts. This induces a downward bias in interest rates and an upward bias in debt levels, which in turn makes it hard to raise rates without damaging the economy – a debt trap.

… In the longer term, the main task is to adjust policy frameworks so as to make growth less debt-dependent and to tame the destructive power of the financial cycle. More symmetrical macroeconomic and prudential policies over that cycle would avoid a persistent easing bias that, over time, can entrench instability and exhaust the policy room for manoeuvre.

The BIS doesn’t go so far as to promote the idea of central banks buying common stock but neither does it imply that this policy would meet with many objections from the central bankers central bank.

For a more radical argument in favour of central bank buying of common stock I am indebted to Prof. Roger Farmer of UCLA –  Qualitative easing: a new tool for the stabilisation of financial markets. In this speech, given at the Bank of England –John Flemming Memorial Lecture last October, Prof. Farmer elaborated on his ideas about “Qualitative Easing”: –

 …When I refer to quantitative easing I mean a large asset purchase by a central bank, paid for by printing money. By qualitative easing, I mean a change in the asset composition of the central Bank.

…In this talk I argue that qualitative easing is a fiscal policy and it is a tool that should be permanently adopted by national treasuries as a means of maintaining financial stability and reducing persistent long-term unemployment.

…My proposed policy tool follows directly from my research findings of the past twelve years. Those findings demonstrate that, by trading in asset markets, national treasuries can and should act to prevent swings in asset prices that have had such destructive effects on all of our lives.

…asset market volatility and unemployment are closely correlated and I will argue that by stabilising asset markets, we can maintain demand and prevent the spectre of persistent unemployment.

…Although there are very good arguments for the use of government expenditure to repair infrastructure during recessions, we should not rely on countercyclical government investment expenditure as our primary tool to stabilise business cycles. Qualitative easing is an effective and more efficient alternative.

…The crisis was caused by inefficient financial markets that led to a fear that financial assets were overvalued. When businessmen and women are afraid, they stop investing in the real economy. Lack of confidence is reflected in low and volatile asset values. Investors become afraid that stocks, and the values of the machines and factories that back those stocks, may fall further. Fear feeds on itself, and the prediction that stocks will lose value becomes self-fulfilling.

…My work demonstrates that the instability of financial markets is not just a reflection of inevitable fluctuations in productive capacity; it is a causal factor in generating high unemployment and persistent stagnation. The remedy is to design an institution, modelled on the modern central bank, with both the authority and the tools to stabilise aggregate fluctuations in the stock market.

These arguments are the heady stuff of political economy and put me in mind of the two views epitomised by the quotes below: –

“Centralization of the means of production and socialization of labor at last reach a point where they become incompatible with their capitalist integument. Thus integument is burst asunder. The knell of capitalist private property sounds. The expropriators are expropriated.”

Karl Marx – Das capital- 1867


“The traditional, correct pre-Marxist view on exploitation was that of radical laissez-faire liberalism as espoused by, for instance, Charles Comte and Charles Dunoyer. According to them, antagonistic interests do not exist between capitalists, as owners of factors of production, and laborers, but between, on the one hand, the producers in society, i.e., homesteaders, producers and contractors, including businessmen as well as workers, and on the other hand, those who acquire wealth non-productively and/or non-contractually, i.e., the state and state-privileged groups, such as feudal landlords.”

Hans-Hermann Hoppe – The Economics and Ethics of Private Property – 1993

There is a precedent for aggressive central bank intervention in equity markets. In August 1998 the HKMA responded to the forth wave of speculative attacks on the currency peg by buying equities. During the second half of August 1998 the HKMA, through its Exchange Fund, bought HK$118 bln (US$15bln) of Hang Seng constituent stocks – 8% of the total market capitalisation. It also intervened in the Hang Seng futures market, creating a violent short squeeze.  In order to further discourage speculators the HKMA mandated the prompt settlement of all outstanding trades, forcing naked short sellers to source stock loans. Having given the speculators a few days to get their stock borrow in place it then imposed a short selling ban on some of the more liquid names.

The Exchange Fund disposed of some of its holding, bringing the percentage of the Hang Seng it held down to 5.3% by 2003. By 2006 it had crept back up to more than 10%. The Exchange Fund currently manages HK$3032.8bln and is permitted to hold up to 20% in equities. According to the HKMA- 2013 Annual Report they held HK$ 153bln of Hong Kong equities and HK$ 297bln of US equities.

The Future of Central Banking

The developed world’s savers are being decimated to fund the profligacy of borrowers. Polonius’s advice to his son today would surely be “Never a lender, always a borrower be.”Major central banks are struggling with this dilemma. Interest rates are close to the zero bound in most developed countries. These are negative real-rates of return. At some point interest rates need to normalise, but the markets are hooked on the methadone of cheap and plentiful money.  Taking away the punchbowl is the central banker remedy for an “Inflation Party”, closing the cocktail bar in the current environment would risk sending the world economy “cold turkey” and potentially killing the patient.

I believe we will see more central bank buying of agency bonds, corporate debt, including convertibles and finally common stock. The objective will be to maintain stability of employment in the wider economy and provide long term capital to support economic growth. This will favour certain companies: –

  1. Large employers – the primary objective is “full employment”
  2. Large capitalisation names – even if the purchases are evenly weighted it will favour the largest stocks by market capitalisation
  3. Non-financial firms – the secondary objective is to supply capital to the real-economy, financial institutions are principally intermediaries
  4. Industries where trade union membership is higher – due to greater political influence
  5. Industries which are the favoured recipients of state subsidies and patronage

The “dispossessed” will be: smaller listed and non-listed companies.

Implications for asset allocation

Where the central banks lead I believe we should follow. Bond yields will inevitably rise as interest rates normalise and institutions switch increasing quantities of their assets to equities. As bond yields rise the attraction of real-estate will diminish due to increased financing costs – though I would make the caveat that property is always about “location”. Equities will benefit from a world-wide, state-sponsored version of the “Greenspan Put”. This doesn’t mean that stock markets will be a one way bet, but valuation models need to incorporate the prospect of this newly minted “wall of money” into their calculations of what represents “value”.

Remember, also, that there will be two distinct types of central bank investment: that which is designed to support domestic employment and that which is driven by the quest for an acceptable rate of return. Many common stocks now offer a higher dividend yield than government bonds, a situation which has not been seen for several decades. In a low inflation environment this should persist, but in pursuit of their inflation targets central banks are likely to distort this relationship once more. It is hard to dispute that this looks like a variant of the Cantillon Effect.

Implementing structural reform is politically difficult, mandating ones central bank to buy the stock market is much easier. There will be pockets of resistance from those who question whether it is appropriate for central banks to control the equity market but this is the least painful exit from the current impasse. The foreign exchange reserves of emerging market central banks have ballooned since the 1997/1998 Asian crisis. Their governments mercantilist policies rely on developed market consumption. Come the next major crisis, it won’t be just the “big five” central banks acting in isolation a concert party of elite capital will save the day.


Oil, Emerging Markets and Inflation

400dpiLogo

Macro Letter – No 14 – 20-06-2014

Oil, Emerging Markets and Inflation

The political situation in Iraq – OPEC’s third largest producer in 2012 – has prompted a sharp increase in crude oil prices, however, unlike some other industrial commodities, oil has remained at elevated levels since 2002. Global oil inventories have remained tight which is reflected in the backwardation of futures markets. WTI has narrowed relative to Brent as the US economy has recovered and domestic distribution bottlenecks have emerged, the backwardation in WTI is more pronounced but it is also evident in Brent futures.

Here is a monthly chart for Brent crude going back to 2003: –

Brent Crude 2003-2014 barchart.com

Source: Barchart.com

Despite a large correction in 2008 the price recovered swiftly. During the last three years it has consolidated into a relatively narrow range but needs to break above the 2011 and 2012 highs to confirm a significant breakout to the upside. With stronger GDP growth in the US and EU this year, I believe the conditions are in place for an increase in global demand. According to the IEA the emerging market countries will account for 90% of the increase in energy demand between now and 2035, as this chart of OECD and non-OECD demand illustrates, the process is already in train: –

Gloabl Crude Oil demand - yardeni

Source: Yardeni.com/OECD/Oil Market Intelligence

Even during the great recession of 2008/2009 non-OECD demand increased. China has seen the largest growth in demand for oil. Their energy security policies can be seen across the globe. For example, between 2005 and 2012 the PRC invested $18.5bln in Brazilian energy, their governments have entered into technology sharing agreements and since 2009 China has been Brazil’s largest trading partner.

Asia’s Energy Challenge

April 2013 saw the publication of an excellent paper on the state of energy markets in Asia – Asian Development Bank – Asia’s Energy Challenge – 2013, here are some extracts.

On the rebalancing of Asian economies – this push towards increased domestic consumption is not just confined to China:-

…Southeast Asia is benefiting from robust domestic demand and greater trade with its neighbors in the region.

The process of global rebalancing continues. Strong domestic demand and intraregional trade, coupled with weak demand from advanced economies, have further narrowed developing Asia’s current account surplus. The surplus dropped from 2.5% of GDP in 2011 to 2.0% in 2012. Although exports are projected to pick up, imports will likely rise even more quickly, tightening the overall current account surplus further to 1.9% of GDP in 2013 and 1.8% in 2014.

On the risks of inflation: –

… Price pressures must be closely monitored in this environment of continued global liquidity expansion. Robust growth has largely eliminated slack productive capacity in many regional economies such that loose monetary policy risks reigniting inflation. Inflation is expected to tick up from 3.7% in 2012 to 4.0% in 2013 and 4.2% in 2014.

Inflation is expected to remain in check, but price pressures should be closely monitored. In general, inflation in developing Asia remains contained, partly because food prices are stable throughout the region. But tame inflation does not translate at this juncture into a free hand to wield monetary policy to stimulate economic activity. In an environment of excess global liquidity, central banks in economies where forecast output is close to long-term trend must monitor the potential for price pressures to build up and stand ready to intervene to avoid accelerating inflation. Several countries are already dealing with higher inflation or structural imbalances. Stabilization should be their priority.

The heart of the paper is a discussion of Asia’s energy and commodity needs:-

Asia must secure sufficient energy to drive economic expansion in the decades to come. The region already consumes roughly a third of global energy, and this is set to rise to over half by 2035.

Rising consumption and investment demand has turned developing Asia into a net importer of commodities. While the major industrial economies have struggled to recover from the global financial crisis, resilient growth has made Asia a heavyweight in markets for commodities such as copper, iron, coal, oil, and cotton. In 2011, the PRC‘s share of global commodity consumption was 20% for nonrenewable energy resources, 23% for major agricultural crops, and 40% for base metals. The region’s expanded role in commodity markets makes it an important “shock emitter” to resource-rich countries through commodity prices.

The PRC sources commodities globally, while India looks to its neighbors. Because its demand for commodities is so large, the PRC cannot limit itself to regional markets. In fact, 9 of the 10 countries that rely the heaviest on PRC commodity purchases are outside of developing Asia. India, on the other hand, tends to rely on regional resource exporters for commodities other than petroleum products. As such, fluctuations in PRC demand have global consequences, while India’s impacts are largely contained within the region. The large ASEAN economies are generally net commodity exporters but, like the PRC and India, source petroleum products from outside the region.

Developing Asia’s energy needs have risen in tandem with its economic expansion. The region consumes roughly a third of global primary energy. Coal remains the dominant energy source, fueling more than half of the region’s production, followed by petroleum. Natural gas consumption is still limited but rising quickly. The price volatility of energy complicates efforts to maintain macroeconomic stability. Looking past this short-term issue, developing Asia’s sustainable growth will depend critically on securing adequate energy supply.

Critical energy needs for the Asian Century Energy systems will be challenged to satisfy developing Asia’s economic aspirations. With 6% annual growth, developing Asia could produce 44% of global GDP by 2035. This Asian Century scenario would see the region’s share of world energy consumption rise rapidly from barely a third in 2010 to 51%–56% by 2035. With insufficient energy, developing Asia would need to scale back its growth ambitions.

Securing adequate energy is a serious challenge because Asia cannot rely solely on its endowment. The region has abundant coal but currently commands only 16% of the world’s proven conventional gas reserves and 15% of technically recoverable oil and natural gas liquids. More renewable energy and nuclear power generation are planned, but not enough to keep pace with demand. To fill the gap, oil imports would have to rise from the current 11 million barrels per day to more than 30 million barrels per day by 2035, making Asia more vulnerable to external energy shocks.

Geo-political tensions are evident, not just in Iraq, but also in Chinese disputes with its neighbours around the South and East China Seas; the most recent example being a territorial dispute with Vietnam over the location of a Chinese Oil rig which flared up at the end of April. In some senses the timing of this dispute is ironic since Chinese oil demand hit a nine month low of -0.7% in May. Nonetheless the IEA continue to predict Chinese Oil demand to be 3.5% higher in 2014.

India, under the new its new BJP government, is considering a reversal of its recent policy to reduce diesel subsidies. The catalyst for this “about turn” is concern that monsoon rainfall will be only 93% of trend, prompting the need for intensive irrigation. Yet Asian demand for diesel, often viewed as a leading indicator of GDP growth, is at its second lowest level since the Asian crisis of 1998. Commentators have attributed this weakness to slower GDP growth (so much for its “leading indicator” status) and attempts to reduce fuel subsidies across the region. Indian diesel use was 1% lower in the fiscal year to March 2014 – the first decline in more than a decade.

Indonesian oil demand continues to decline; after a fall of 3.9% in 2013, Wood Mackenzie forecast a 4.6% decline in 2014. Indonesian growth has been slowing steadily since 2011 but, after an up-tick in Q4 2013, the decline accelerated following a government ban on exports of unprocessed minerals in January 2014. Q1 GDP was +5.21% – the average growth rate between 2000 and 2014 is 5.42% – in other words its only slightly below its long term trend rate. Bank Indonesia note in their April monetary policy minutes that externaldemand is improving and substituting moderating domestic demand as a source ofeconomic growth…Exports are also following a more favourable trend on theback of exports from the manufacturing sector in harmony with the economic recoveriesreported in advanced countries.” It is important to remember that Indonesia is energy resource rich. The EIA – Energy Information Administration rank Indonesia 22nd by total oil production and 11th by gas and 5th by coal production. Rising oil prices will therefore benefit their economy.

Both Indonesia and India – until last week – have been attempting to reduce their levels of fuel subsidies, however, the chart below shows that, at a global level, fuel subsidies are back to within striking distance of their 2008 highs. In 2011 more than 50% of these subsidies were concentrated on reducing oil prices.

Energy Subsidies - worldwatch

Source: Worldwatch/IEA/OECD

Global Oil Demand

With near-term energy needs from Asia looking undemanding, should we be concerned about the impact of reduced Iraqi production on oil prices longer term?  Back in February the IEA cut its forecast for Emerging Market demand citing higher interest rates and currency related economic uncertainty, yet, at the global level, they still forecast increased demand due to the recovery of the US and other developed market economies. The IEA June report is more sanguine. Their 2014 forecast anticipates a 1.3mln bpd increase from 2013 with the greatest acceleration occurring in Q4.

The International Energy Agency – World Energy Outlook 2013 Factsheet – looks at the longer term global tends:-

…In the New Policies Scenario, our central scenario, global energy demand increases by one-third from 2011 to 2035. Demand grows for all forms of energy, but the share of fossil fuels in the world’s energy mix falls from 82% to 76% in 2035.

…Energy demand growth in Asia is led by China this decade, but shifts towards India and, to a lesser extent, Southeast Asia after 2025. The Middle East emerges as a major energy consumer, with its gas demand growing by more than the entire gas demand of the OECD: the Middle East is the second-largest gas consumer by 2020 and third-largest oil consumer by 2030, redefining its role in energy markets.

…Global energy trade is re-oriented from the Atlantic basin to the Asia-Pacific region. China is becoming the largest oil-importing country; India becomes the largest importer of coal by the early 2020s.

Non-OPEC supply plays the major role in meeting net oil demand growth this decade, but OPEC plays a far greater role after 2020. Technology unlocks new types of oil resources and improves recovery rates in existing fields, pushing up estimates of the amount of oil that remains to be produced. But this does not mean that the world is on the cusp of a new era of oil abundance. An oil price that rises steadily to $128 per barrel (in year-2012 dollars) in 2035 supports the development of these new resources.

In the near-term there are a number of downside risks for oil prices:-

  1. Higher interest rates in the US leading to a moderation of consumption.
  2. New production. Iran is expected to increase production as sanctions are reduced after their meeting in Vienna next week (+1mln bpd). Libyan production should recover having declined by 80% during the recent regime change (+500,000 bpd). Venezuelan production should recover after the recent political turmoil (+250,000 bpd)
  3. Increased supply from unconventional sources in US and Canada – US production continues to increase. The chart below shows the revival in US production during the last few years. The benefit to domestic US industry in cheaper energy has been substantial. This windfall will continue.

US Crude Oil Production - US Gloabl Investors

Source: Bloomberg/US Global Investors

Set against this backdrop of slower US growth and increased supply is the potential increase in oil demand as emerging economies benefit from the lagged effect of the current economic recovery of the US, UK and other developed economies. Developing Asia and some other emerging markets will also benefit as “rebalancing” towards domestic demand bares fruit.

Many emerging market countries have seen a sharp depreciation in their currencies and subsequent rise in inflation. Their central banks have responded by raising interest rates aggressively. These currency devaluations have now improved their export competitiveness and, with the worst of the inflation shock behind them, they should benefit from an export led recovery, accompanied by lower interest rates and increased foreign capital investment flows. This will lead, eventually, to stronger currencies and lower inflation. As emerging markets complete this virtuous circle, currency appreciation will lessen the impact of higher energy costs in domestic terms, thus maintaining oil demand.

Iraqi oil production has recently reached levels last seen in the 1970’s as the chart below shows: –

Iraq Oil Production - Energy insights

Source: Energy Insights

Iraqi supply will undoubtedly be curtailed in the near-term. The effect of the ISIL insurgency may well spill over into conflict with Iran. Iranian production is running at 3.8mln bpd and they claim this can be increased to 4mln bpd once sanctions have been lifted; a regional conflict with Sunni militia will delay production increases.

The impact of Russian energy policy in relation to the Ukraine – and its knock-on effect on Europe – still points to upside risks. Gazprom stopped their supply of gas to the Ukraine this week. The new Ukrainian government report that their gas reserves will be depleted by the autumn.

Of more importance than the near-term geo-political risks, energy demand in emerging Asia is set to grow, not just in the longer term but, I believe, over the next two or three years as the impact of the gradual US economic recovery stimulates demand. The IMF cut their forecast for US GDP growth this week after weak Q1 data, but this will delay Federal Reserve tightening, prompting increased capital flows to emerging Asia.  Oil demand will continue to increase as the chart below is from Energy Insights shows. Incidentally, they are advocates of the theory of “peak oil” – my jury is still out on that subject.

World Oil Production and Consumption - Energy Insights

Source: EnergyInsights.net

Conclusion

The recent rise in oil prices may herald the re-pricing of a number of other industrial commodity markets. This process will be driven by the pace of recovery of emerging market economies, led principally by China and India. The “reflation” maybe punctured by rising interest rates in the US but this looks unlikely in the medium term. Emerging market equities remain cheap relative to the developed markets despite their recent strength. Emerging market bond yields are beginning to fall as their currencies stabilise; the “quest for yield” will support further foreign capital in-flows.

Commodity markets, such as Australian Coking Coal and Iron Ore, languish close to multi-year lows, yet Chinese Steel Mills are expected to produce record quantities again in 2014 and Chinese steel consumption continues to rise despite the slowing pace of economic growth. Chinese steel mills are heavily reliant on bank credit to finance their operations and many mills have been producing at zero profit margins as a result of the tightening of credit conditions. Last month saw a significant surge in bank lending although total credit remained unchanged as tightening of conditions for the shadow banking sector continues.

Chinese industrial production was unchanged from April at 8.8% in May, still low by historic standards but stable, and retail sales rose to 12.8%, a small rebound from the levels of earlier in the year. Copper climbed a little from its recent lows. It would be foolish to call the bottom for Iron Ore prices but I believe we will see steel mills return to profitability as new bank lending is sanctioned by the Xi administration.

It is still too soon to call the final wave of the multi-year commodity bull-market, underway, but I see risks on the upside as consumer demand and tighter supply push oil prices higher. Those central bankers fixated with deflation risks may soon have new Hydra to confront. When demand pull inflation returns the big five central banks will test the political resolve of their masters.

Emerging market stocks in general, and Chinese equities in particular, look cheap by comparison with developed markets. Forward P/E’s on many Chinese stocks are in single digits and few analysts are predicting much earnings growth over the next two years. I think the macro environment is more favourable. The slower the recover in developed market growth, the more likely that emerging market equities outperform developed markets.

A very French revolt

400dpiLogo

Macro Letter – No 13 – 06-06-2014

A very French revolt

18052014311

Sur le Pont d’Avignon

L‘on y danse, l’on y danse

Sur le Pont d’Avignon

L’on y danse tous en rond

Last month I spent a few days helping a friend with his business in Avignon. This was a brilliant opportunity to canvass the views of the non-metropolitan French in respect of the current government and the state of the French economy. During my career I have worked closely with Parisian bankers and asset managers. Somewhat like London, Paris is “another country” which happens to be situated in the middle of France. In the provinces they believe in “rendre la vie plus simple”– life rendered easier.

The city of Avignon is close to the tourist heartland of Provence but it is also very much a commercial centre for a wider agricultural region. The above picture is of the famous Pont Saint-Benezet bridge across the Rhone; the bridge collapsed in 1644 and is now a tourist attraction. It is better suited to dancing today than it was at the time of the 15th century childrens’ song, but, as the home of the Pope from 1309 until 1377, the city has a long history as a tourist attraction.

Old Avignon is a beautiful city and a world heritage site. As one wanders around the walled centre,interieur du murs, filled with shops, cafes and restaurants, one is reminded of the French esteem for “La Bonne Vie”.  Exterior du murs it is a different story. Large housing projects and, often, poorly maintained properties, bare witness to the, predominantly North African, diaspora who work in agriculture or the service industries, or, in many instances, do not work at all. Avignon is a city of contrasts but it offers a unique window into “real France”.  During my visit I spoke to four of the city’s residents:-

  1. a French engineer who works for a large utility company.
  2. a French economist working for local government helping immigrant workers find local jobs
  3. an ex-pat American carpenter who has lived and worked in the region since the 1960’s
  4. a French national who works in the real-estate and tourist industry

None of them were overwhelmed by the performance of Francois Hollande’s PS (socialist party) government, but, to my surprise, none were surprised by his “about-turn” on economic policy.

Francois Hollande was elected in 2012 on a mandate to “tax and spend” but soon achieved a volte-face. The current policy calls for Eur 50bln of spending cuts over the next three years. These cuts will be concentrated on health and welfare. Public sector wages are to be frozen – though I have no doubt many public sector workers will be promoted to higher pay grades. The headline figure is somewhat misleading since the policy package also incorporates reductions in taxes for employers amounting to some Eur 30bln. Nonetheless, it is unlikely that any other French political party could have achieved as much austerity.

The French electorate seem unimpressed by these policies as witnessed by the rising fortunes of the Front National in the European Elections last month. The rightward swing has been widely reported but I doubt the “protest vote” – which has been seen across the EU – will have much impact except to slow the process of federalisation.  Steen Jakobsen – Saxo bank had this to say following the outcome of the vote:-

Across Europe, EU-sceptic voters gained ground, but it could be in vain as the overall majority of the old guard: Conservative, Liberals, Greens and Social Democrat’s still carry 70 percent of the mandates.

…The 751 members of the EU Parliament operate through coalitions of interest across countries and sometimes political standpoint. The final date for submitting a coalition is June 23, and a “coalition” has to be at least 25 members from seven different nations. Here the protest votes can play vital role. The Europe-sceptic vote is divided. The risk is that, similar to the Occupy movement in the US, all lack of common goal, except those of a negative nature, allows the majority get away with ignoring what clearly is a call from the voters to the politicians that Europe is too far away from the daily life of its 500 million citizens.

…The EU “economic police” will be tested. France and Spain is already in violation of budget deficits for 2014 and 2015. The so called “recovery” is actually a stabilisation, not recovery. In history, unions, even primitive ones, fail when economic times turns negative.

The condition of French government finances is not rosy: public debt to GDP is running at 57%. Tax to GDP, at 57%, is the highest in Europe. Meanwhile unemployment is stuck in double digits. The economy has stalled; Q1 GDP was zero and the IMF revised forecast for 2014 is down to 1%. Unsurprisingly, foreign investment into France declined -0.9% during the first quarter.

Employment

Returning to Avignon the issues which most concerned all the “locals” I interviewed were immigration and the standard of living: or perhaps I should say “Quality of Life”. As in many developed countries, immigrants will accept lower pay and take on more menial tasks than the indigenous population. As long as there are higher paid, higher skilled employment opportunities this process frees up scare resources to be employed in productivity enhancing roles. When those opportunities do not exist a country’s standard of living suffers: younger and older workers bare the brunt. In France this effect has been softened by encouraging younger people to study longer, often at the tax payers’ expense. Older workers have been encouraged to retire earlier, again, at the tax payers’ expense.

A recent post from Scott Sumner – How to think about Francemakes some economic comparisons with the USA: –

…So, here are some [2008] ratios of France to the United State:-

GDP per capita: 0.731

GDP per hour worked: 0.988

Employment as a share of population: 0.837

Hours per worker: 0.884

So French workers are roughly as productive as US workers. But fewer Frenchmen and women are working, and when they work, they work fewer hours.

…The bottom line is that France is a society with the same level of technology and productivity as the US, but one that has made different choices about retirement and leisure. Vive la difference!

Professor Sumner observes what von Mises called “Human Action”. He goes on to make some observations about employment protection: –

France has a wide range of policies that reduce aggregate supply:

1.  High taxes and benefits, which create high MTRs.

2.  High minimum wages and restrictions on firing workers.

What should we expect from these “bad” supply-side policies?  I’d say we should expect less work effort at almost every single margin. Earlier retirements, more students staying longer in college, longer vacations, and a higher unemployment rate.

France has always had a reputation for employment protection but overall it is not dramatically different from its larger European neighbour as the OECD – Employment Outlook 2013  reveals in their latest employment protection rankings. Whilst France is above the OECD average (Page 78 – Figure 2.1) it is not that far above Germany.

TheInternational Labour Office –An anatomy of the French labour market – January 2013gives a detailed account employment trends. The rise of temporary labour has been as prevalent in France as in many other countries despite, or perhaps as a result of, its rigid employment laws. The ILO describes this as a Two-tier system which creates a more stringent protective framework for workers on long-term contracts and very limited protection for workers on short-term contracts. According to their report the legislative policies in countries such as France and Spain has led to higher job turnover. Since the 1990’s France has seen a 70% to 90% increase in short-term employment. This trend has accelerated since the Great Recession.

As French government spending falls, the opportunities for longer-term employment, especially for the young and older worker, will be reduced. The ILO continue: –

The share of temporary jobs in the private sector is far higher among young workers aged between 15 and 24 years old than among prime-age workers (25-50) and senior workers (over 50): 39.9 per cent vs. 10.7 per cent and 7.0 per cent in 2010. It is also higher for women (15.2 per cent) than for men (9.1 per cent).

When viewed through the lens of “employment opportunity” the French protest vote at the European Elections is not that surprising. The table below shows the wage inequality between permanent and temporary contracts across Europe, France comes third, behind the Netherlands and Sweden on this measure: –

Wage premium for permanent contracts for 15 European countries.
Sweden 44.7
Netherlands 35.4
France 28.9
Luxembourg 27.6
Germany 26.6
Italy 24.1
Greece 20.2
Austria 20.1
Finland 19
Ireland 17.8
Denmark 17.7
Spain 16.9
Portugal 15.8
Belgium 13.9
United Kingdom 6.5

Source: Boeri (2011)

Impact on the financial markets

But what does all this mean for the French financial markets? To judge by the recent performance of the CAC40 and 10yr OATs, not much.


CAC40 - source - yahoo finance

Source: Yahoo finance

The new highs have been achieved on low volume which may indicate a lack of conviction. What is clear is that the EU election results were anticipated. What is less clear is whether the market reaction is a sign of approval at the “protest” or apathy. It is clear that the financial markets are more concerned about ECB policy. May 2014 EU inflation was +0.5% vs an ECB target of +2%. The small cut in the refinance rate this week and the introduction of negative interest rates on deposits held at the ECB are hardly sufficient to offset the disinflationary forces of the EZ rebalancing which has been on-going since the great recession. The end of “monetary sterilisation” and new targeted LTROs, together with the proposal for the ECB to purchase certain ABS, however, looks like the beginning of something more substantial. OMT is still in the arsenal but has yet to be deployed.

10 yr OATs reflect a similar story: –

OAT 10yr yield

Source: Investing.com 

The all-time low yield was set in April 2013 at 1.64% but, with French growth apparently slowing, yields remain wedded to those of German Bunds. The 10 year spread has continued to converge this year from 65bp on 15th January to around 40 bp today.

French Real-Estate may also be influencing other asset classes. According to a recent OECD report French residential property is still overvalued despite the declines of the past couple of years. On a Price to Rent measure the OECD estimate values to be 35% higher than the long run average. On a Price to Income basis the overvaluation is only 32%. It is worth noting that interest rates are at historically low levels so these overvaluations are not entirely surprising. France is not alone in its overvaluation as the table from Deutsche Bank (using earlier OECD data) shows: –

Global House Prices - OECD + Deutsche bank - February 2014

Source: Deutsche Bank and OECD

In their March 2014 Global House Price Index report, Frank Knight commented that residential property in France and Spain was still languishing. However, in comparison with March 2012 prices were down only 1.4% in France compared to 4% in Spain and 9.3% in Greece.

If historically low interest rates cannot stimulate demand for Real-Estate then asset managers would do well to allocate to a more attractive asset class. With OAT yields nearing historic lows the CAC40 appears to be benefitting by default; it trades on a P/E of 26 times. The UK, with the strongest growth forecast in Europe, is trading at 33 times (FTSE) whilst the DAX trades on a P/E of 22.

Conclusion

The French Revolt at the EU elections is principally a protest against the immigration policies of the French administration. The main concern of the average French voter is long-term employment and quality of life. The policies of Brussels, which reinforce those of the French administration, are seen as contrary to the interests of the French people in respect of immigration but this does not mean that the French people are anti-EU.

French financial markets have paid little heed to the EU election results. The actions of the ECB are of much greater importance in the near-term. The longer-term implications of the gains for the Front National will be tested at the Senate Elections in September this year, but, given the large socialist majority last time, any swing to the Front National will be a further “protest”. The real test will be at the presidential elections – scheduled for 2017.

Low interest rates from the ECB look set to continue. The central bank has now begun to utilise some of the unconventional tools at their disposal to transmit longer-term liquidity to the non-financial economy. OAT yields should remain low in expectation of the implementation of these more aggressive policies. They will also be supported internally if Hollande succeeds with his austerity package. French property prices are likely to remain subdued and may weaken further if the economy continues to stall. French stocks will therefore continue to benefit, both from international and domestic capital flows, but, at their current valuations, they will reflect the direction of international markets led by the US and, within Europe, by the UK and Germany.

Emerging Asia ex-China – prospects for growth – Currency – Stocks and Bonds

400dpiLogo

Macro Letter – No 12 – 23-05-2014

Emerging Asia ex-China – prospects for growth – Currency – Stocks and Bonds

As Chinese growth slows will the rest of Emerging Asia falter?

Will Emerging Asia close the gap which has opened relative to developed markets?

Which Emerging Asian markets offer the best value?

As the world economy continues its slow recovery from the great recession the developed economies have been taking over the reins of growth from the emerging markets. This has been clearly illustrated by the under-performance of the MSCI Emerging Market Equity Index compared to the S&P500; the PE differential between EEM index and the S&P is near to levels last seen in 1997. Emerging equity markets are currently trading at their largest discount to developed markets in more than a decade. Historically when the EM equity price to book ratio is below 1.5 – which is currently the case – the next year sees double digit returns.

MSCI EM vs S&P - 5 yr - Yahoo Finance

Source: Yahoo Finance

This five year chart shows the initial “lock-step” recovery during the early phase of the recovery. After the Eurozone crisis the two markets diverged despite significant capital flows into emerging markets.

The emerging markets share of global GDP is forecast to rise to 40% by 2018 – it was just 10% in 2003. However, EM equities account for only 11% of global market capitalisation.

During 2013 the disappointing performance of emerging market equities spilled over onto the foreign exchange market with several Asian currencies declining precipitously.

The Indian Rupee led the charge followed by the Indonesian Rupiah this prompted aggressive tightening of monetary policy by the Reserve Bank of India and Bank Indonesia. Thailand, Malaysia and the Philippines all suffered by association as foreign capital was withdrawn. However, EM central banks learnt from the Asian crisis of 1997/98 – their foreign currency reserves have increased from 16% of GDP in 1997 to 37% in 2013. The BIS – Foreign exchange intervention and the banking system balance sheet in emerging market economies – March 2014 offers a fascinating insight into this development and its impact on EM economies. They conclude that EM CB FX intervention amounts to an “Impossible Trinity” weakening their control over domestic monetary policy and increasing risks to the financial system.

The charts below are inverted but show the relative performance of the Emerging Asian currencies during the past year. China, of course, is the odd man out due to their peg against the US$.

THB blue - PHP purple - MYR light blue - 1 year - bloomberg 

THB – Blue, PHP – Purple, MYR – Light Blue                    Source: Bloomberg

INR blue - IDR purple - CNH light blue 1 yr - bloomberg 

INR – Blue, IDR – Purple, CNY – Light Blue                       Source: Bloomberg

These currencies have now stabilised but at lower levels thanH1 2013, however, Emerging and Developed Asia is the region of strongest forecast economic growth according to most commentators. The IMF 2014 forecasts for the region have changed little in the past year: –

Country Jul-13 Oct-13 Jan-14 Apr-14
World 3.8 3.6 3.7 3.6
Dev Asia 7 6.5 6.8 6.8
China 7.7 7.3 7.5 7.5
India 6.2 5.1 5.4 5.4
Asean 5* 5.7 5.4 5.1 4.9
* Includes Indonesia, Thailand, Malaysia, Philippines and Vietnam

Source: IMF

The latest IMF – World Economic Outlook – April 2014 is entitled “Recovery Strengthens, Remains Uneven”. Here is how they sum up the prospects for Emerging Markets:-

First, if growth in advanced economies strengthens as expected in the current WEO baseline forecasts, this, by itself, should entail net gains for emerging markets, despite the attendant higher global interest rates. Stronger growth in advanced economies will improve emerging market economies’ external demand both directly and by boosting their terms of trade. Conversely, if downside risks to growth prospects in some major advanced economies were to materialize, the adverse spillovers to emerging market growth would be large. The payoffs from higher growth in advanced economies will be relatively higher for economies that are more open to advanced economies in trade and lower for economies that are financially very open.

Second, if external financing conditions tighten by more than what advanced economy growth can account for, as seen in recent bouts of sharp increases in sovereign bond yields for some emerging market economies, their growth will decline. Mounting external financing pressure without any improvement in global economic growth will harm emerging markets’ growth as they attempt to stem capital outflows with higher domestic interest rates, although exchange rate flexibility will provide a buffer. Economies that are naturally prone to greater capital flow volatility and those with relatively limited policy space are likely to be affected most.

Third, China’s transition into a slower, if more sustainable, pace of growth will also reduce growth in many other emerging market economies, at least temporarily. The analysis also suggests that external shocks have relatively lasting effects on emerging market economies, implying that their trend growth can be affected by the ongoing external developments as well.

Finally, although external factors have typically played an important role in emerging markets’ growth, the extent to which growth has been affected has also depended on their domestic policy responses and internal factors. More recently, the influence of these internal factors in determining changes in growth has risen. However, these factors are currently more of a challenge than a boon for a number of economies. The persistence of the dampening effects of these internal factors suggests that trend growth is affected as well. Therefore, policymakers in these economies need to better understand why these factors are suppressing growth and whether growth can be strengthened without inducing imbalances. At the same time, the global economy will need to be prepared for the ripple effects from the medium-term growth transitions in these emerging markets.

 As China reforms and rebalances its economy towards domestic consumption, how will the other countries of Emerging Asia perform and what will this mean for their financial markets?

The table below highlights some aspects of these markets. They are arranged in GDP size order: –


Country GDP 2014 f/c* 2015 f/c Base Rate 10yr Bond** Inflation Unemploy Gov Budget Debt/GDP C/A
India 4.7 5.8 6.5 8 8.78 8.31 3.8 -4.9 68 -4.6
Indonesia 5.7 5.3 5.5 7.5 8.02 7.25 6.25 -2.2 26 -3.2
Thailand 0.6 4.5 5 2 3.39 2.45 0.62 -2.5 45 -0.4
Malaysia 5.1 4.8 4.9 3 4 3.5 3.2 -3.9 55 4.7
Philippines 6.5 6.5 7.1 3.5 4.31 3.9 7.5 -1.4 38 3.5
* Forecasts World Bank – GEP – January 2014
** Source: Investing.com (15/5/2014)

The World Bank GDP forecasts differ slightly from those of the IMF but not materially. All the countries are saddled with budget deficits but Malaysia and the Philippines are running current account surpluses. Indonesia’s Debt to GDP ratio is the lowest of the five nations but their debt is heavily US$ denominated whereas Thailand is principally a domestic borrower.

Below I’ve picked out some details from the IMF – World Economic Outlook:-

1. Deviation from Trend GDP

India is running around 3.5% below trend and Thailand 2% below, Malaysia is fairly neutral but Indonesia is already around 1.5% above trend and the Philippines nearly 2.5% above.

2. Responsiveness to US GDP shock

India is most sensitive at +/- 2%, followed by Malaysia 1.5%. The Philippines moves one for one and in the first year Thailand barely reacts, although in year two its sensitivity increases to +/- 0.6%.

3. Trade Openness (Exports plus Imports as a % of GDP)

Malaysia comes top at 175%, followed by Thailand at around 130%, then the Philippines at 80%, Indonesia at 60% and finally India at 45%

4.Trade exposure to advanced economies (Exports to US and EU as % of GDP)

Malaysia leads once again with 28%, followed by Thailand at 17%. The Philippines are hot on their heels at 15% whilst Indonesia and India languish at 8% and 5% respectively.

5. Foreign Capital flow volatility

Malaysia is most sensitive at 5%, followed by Thailand at 4.5%. Indonesian volatility is around 3% whilst the Philippines is only 2%. India has the least sensitivity at 1.8%.

India 

After China, India is the largest economy in Emerging Asia. With 1.2 bln people it is blessed with the most favourable demographics of the BRIC economies. It should overtake China to become the most populous country on earth between 2020 and 2025. In the nearer term Indian voters have just elected a new BJP government with a strong reform agenda. I’m not sure that “Toilets not Temples” is the greatest campaign slogan but it clearly resonated with the masses.

India suffered from capital flight in 2013 with the INR declining by 17% against the US$. After the initial Federal Reserve tapering announcement on 3rd September 2013 capital outflows totalled $13.4bln and RBI reserves were depleted to the tune of $17bln. The RBI responded by raising the Marginal Standing Facility by 2%. They then reduced it by 150bp as the short term effect of capital flight subsided. Rates were then increased by 75bp as inflation concerned increased.

The RBI – Macro and Monetary Developments April 2014 report shows how the Indian economy has recovered over the last few months. It goes on to identify risks and opportunities looking ahead: –

 The Indian economy is set on a disinflationary path, but more efforts may be needed to secure recovery

I.6 While the global environment remains challenging, policy action in India has rebuilt buffers to cushion it against possible spillovers. These buffers effectively bulwarked the Indian economy against the two recent occasions of spillovers to EMDEs — the first, when the US Fed started the withdrawal of its large scale asset purchase programme and the second, which followed escalation of the Ukraine crisis. On both these occasions, Indian markets were less volatile than most of its emerging market peers. With the narrowing of the twin deficits – both current account and fiscal – as well as the replenishment of foreign exchange reserves, adjustment of the rupee exchange rate, and more importantly, setting in motion disinflationary impulses, the risks of near-term macro instability have diminished. However, this in itself constitutes only a necessary, but not a sufficient, condition for ensuring economic recovery. Much more efforts in terms of removing structural impediments, building business confidence and creating fiscal space to support investments will be needed to secure growth.

I.7 Annual average CPI inflation has touched double digits or stayed just below for the last six years. This has had a debilitating effect on macro-financial stability through several channels and has resulted in a rise in inflation expectations and contributed to financial disintermediation, lower financial and overall savings, a wider current account gap and a weaker currency. A weaker currency was an inevitable outcome given the large inflation differential with not just the AEs, but also EMDEs. High inflation also had adverse consequences for growth. With the benefit of hindsight, it appears that the monetary policy tightening cycle started somewhat late in March 2010 and was blunted by a series of supply-side disruptions that raised inflation expectations and resulted in its persistence. Also, the withdrawal of the fiscal stimulus following the global financial crisis was delayed considerably longer than necessary and may have contributed to structural increases in wage inflation through inadequately targeted subsidies and safety net programmes.

I.8 Since H2 of 2012-13, demand management through monetary and fiscal policies has been brought in better sync with each other with deficit targets being largely met. Monetary policy had effectively raised operational policy rates by 525 basis points (bps) during March 2010 to October 2011. Thereafter, pausing till April 2012, the Reserve Bank cut policy rates by 75 bps during April 2012 and May 2013 for supporting growth. Delayed fiscal adjustment materialised only in H2 of 2012-13, by which time the current account deficit (CAD) had widened considerably.

The easing course of monetary policy was disrupted by ‘tapering’ fears in May 2013 that caused capital outflows and exchange rate pressures amid unsustainable CAD, as also renewed inflationary pressures on the back of the rupee depreciation and a vegetable price shock. The Reserve Bank resorted to exceptional policy measures for further tightening the monetary policy. As a first line of defence, short-term interest rates were raised by increasing the marginal standing facility (MSF) rate by 200 bps and curtailing liquidity available under the liquidity adjustment facility (LAF) since July 2013. As orderly conditions were restored in the currency market by September 2013, the Reserve Bank quickly moved to normalise the exceptional liquidity and monetary measures by lowering the MSF rate by 150 bps in three steps. However, with a view to containing inflation that was once again rising, the policy repo rate was hiked by 75 bps in three steps.

I.9 Recent tightening, especially the last round of hike in January 2014, was aimed at containing the second round effects of the food price pressures felt during June-November 2013. Since then, inflation expectations have somewhat moderated and the temporary relative price shock from higher vegetable prices has substantially corrected along with a seasonal fall in these prices, without further escalation in ex-food and fuel CPI inflation. While headline CPI inflation receded over the last three months from 11.2 per cent in November 2013 to 8.1 per cent in February 2014, the persistence of ex-food and fuel CPI inflation at around 8 per cent for the last 20 months poses difficult challenges to monetary policy.

I.10 Against this background there are three important considerations for the monetary policy ahead. First, the disinflationary process is already underway with the headline inflation trending down in line with the glide path envisaged by the Urjit Patel Committee, though inflation stays well above comfort levels.

Second, growth concerns remain significant with GDP growth staying sub-5 per cent for seven successive quarters and index of industrial production (IIP) growth stagnating for two successive years. Third, though a negative output gap has prevailed for long, there is clear evidence that potential growth has fallen considerably with high inflation and low growth. This means that monetary policy needs to be conscious of the impact of supply-side constraints on long-run growth, recognising that the negative output gap may be minimal at this stage.

What does this mean for the INR, Indian stocks and Indian Bonds?

The Sensex Index is already trading on a P/E of 17. This is expensive when compared to the EM average of 12. Therefore they do not offer exceptional value, however, Indian equities are making new highs, the uncertainty of the elections is behind them and world equity markets continue higher – stay long!

Indian Bonds are not easy for international investors to access and offer a real yield of only 0.47%. The Indian yield curve is positive to the tune of 0.78% but inflation expectations are falling. Whilst there are better real yields and steeper yield curves in Emerging Asia, Indian Bonds should perform well as the new government embarks on economic reform.

The USD/INR hit its low point in August 2013 at 69.25 but has since rallied to 58.38 this month; this is still in the lower end of its post 2009 range and well below 2005-2009 levels. I expect the INR to appreciate as the Modi government gets to work. This may dampen the rise of the Sensex.

The Sensex Index has rallied by more than 40% since its low in August 2013, taking out previous highs. The INR has also performed strongly but is still well below its 2010/2011 level of sub 50 vs USD. Indian 10yr bonds by contrast have seen yields increase from 7.2% in June 2013 to hit their highs at 9.17% in December last year. Since then they have increased slowly to their current yield of 8.78%. Technically they look uninteresting but fundamentally they should perform well – this is one of the highest yields in emerging markets.

Indonesia

Indonesia suffered from similar issues to India as the latest Bank Indonesia – Monetary Policy Review – April 2014 explains:-

At the Bank Indonesia Board of Governors’ Meeting held on 8th April 2014, it was decided to maintain the BI rate at 7.50%, with the Lending Facility rate and Deposit Facility rate held respectively at 7.50% and 5.75%. This policy is consistentwith ongoing efforts to steer inflation back towards its target corridor of 4.5±1% in 2014and 4.0±1% in 2015, as well as reduce the current account deficit to a more sustainablelevel. Bank Indonesia considers recent developments in the economy of Indonesia asfavourable and in line with previous projections, marked by lower inflation and a balance oftrade that has returned to record a surplus. Looking ahead, Bank Indonesia will continue toremain vigilant of a variety of risks, globally and domestically, as well as implement anticipatory measures to ensure economic stability is preserved and stimulate the economy in a more balanced direction, thereby buoying current account performance. To this end, Bank Indonesia will continue strengthening the monetary and macroprudential policy mix as well as enhancing coordination with the Government to control the rate of inflation and reduce the current account deficit, including policy to bolster the structure of the economy and manage external debt, in particular private external debt.

…Bank Indonesia expects the ongoing episode of domestic economic moderation to continue, leading to a more balanced and sound economic structure. Externaldemand is improving and substituting moderating domestic demand as a source ofeconomic growth. Several latest indicators and leading indicators demonstrate thathousehold consumption surged in the first quarter of 2014 in the run up to the 2014General Election, among others. Exports are also following a more favourable trend on theback of exports from the manufacturing sector in harmony with the economic recoveriesreported in advanced countries. Meanwhile, private investment growth during the firstquarter of 2014 remained limited and is not expected to pick up until the second semester.As a whole, economic growth in Indonesia for 2014 remains in the range projected previously by Bank Indonesia at around 5.5-5.9%.

More balanced economic growth is further buttressed by improvements in the external sector from the standpoint of the trade balance and the financial account. The balance of trade of Indonesia in February 2014 rebounded to record a surplus of US$0.79 billion, bolstered by a burgeoning surplus in the non-oil/gas trade account. Thegrowing surplus in the non-oil/gas account stemmed from a contraction in non-oil/gas imports in line with moderating domestic demand along with a surge in non-oil/gasexports, primarily from the manufacturing sector as the economies of advanced countriescontinue to recover. The trade surplus also emanated from reductions in the oil and gastrade deficit as a result of rising oil and gas exports due to increased oil lifting as well as adecline in oil and gas imports in accordance with the mandatory use of biodiesel as fuel inthe transportation sector and the electricity sector. In terms of the financial account,foreign capital inflows continued unabated in March 2014, thus foreign portfolio inflows tofinancial markets in Indonesia reached US$ 5.8 billion accumulatively in the first quarter of2014. Against this auspicious backdrop, foreign exchange reserves held in Indonesia at theend of march 2014 topped US$ 102.6 billion, equivalent to 5.9 months of imports or 5.7months of imports and servicing external debt, which is well above international adequacystandards of around three months of imports. Looking forward, Bank Indonesia expectsimprovements in the external sector to continue, underpinned by a current account deficitin 2014 that can be brought down to below 3.0% of GDP and a deluge of foreign capitalinflows. To this end, Bank Indonesia will continue to monitor a plethora of risks, global anddomestic, which could undermine external sector resilience and its pertinent response,including the performance of external debt, in particular private eternal debt.

The rate of inflation continued a downward trend in March 2014, which further  supports the prospect of achieving the inflation target of 4.5±1% in 2014. The rateof headline inflation was low in March 2014 at 0.08% (mtm) or 7.32% (yoy), down on thatposted in February 2014 at 0.26% (mtm) or 7.75% (yoy). Furthermore, inflation in Marchwas also lower than the average rate over the past six years. Inflationary pressures eased as a result of lower core inflation, which dropped in line with exchange rate appreciation, moderating domestic demand and well-anchored inflation expectations. Furthermore, food prices also experienced deflation due to greater supply of several food commodities at the onset of the harvest season.


An overall moderation in growth and inflation but an increasing trade surplus due to improved export demand. This, together with inward capital flows has supported Indonesian stocks, bonds and the IDR.

Another major factor for Indonesia is the forthcoming presidential elections, scheduled for July. The lead candidate, Jokowi, appears to be a reformer but details of his policies are only beginning to take shape as this Lowy Institute article describes.

The IDX Index made its recent lows in August 2013 – a 27% fall from its May 2013 highs. Since then the market has recovered. This month it came within 2.7% of the May 2013 high. If long: stay long. If not, wait for a close above 5,231.

Indonesian Bonds have shown little significant strength. As recently as February 2014 they made new highs at 9.24%. This is a significant increase on their low point of 5.08% in January 2013. Technically they look neutral. Since the 2008 crisis when they briefly touched 21.10% they have risen substantially. After a brief decline to test 9.96% in January 2011 they have been driven by international capital flows. With a lower yield than India and a more volatile history during the 2008/2009 crisis I’m inclined to wait for confirmation – going long on a break below the October 2013 low of 6.92% or short, if you can secure the repo, above the February 2014 high of 9.24%.

During the 2008/2009 crisis the IDR declined from 9000 to 12500 vs US$. It then recovered to pre-crisis levels and only began the recent depreciation in 2012. The precipitous deterioration began in July 2013 when it broke through 10000. The low point occurred in January of this year at 12200. Since then the IDR has regained some ground but the recovery still appears tentative.

The relative weakness of the IDR will aid Indonesia’s export competitiveness. Many investors choose to purchase US$ denominated Indonesian bonds so foreign capital is most likely to flow into the Indonesian stocks. 

Thailand

Thailand has seen rapidly slowing growth, prompting the Bank of Thailand to cut interest rates again in March. The Bank of Thailand – Monetary Policy Report – March 2014 elaborates: –

 The Thai economy appeared poised to slowdown in 2014 due to weaker domestic demand during the first half of the year. This was due to the political situation in Thailand which dented consumer and investor confidence. Meanwhile, exports gradually recovered in line with improved trading partners’ economies. Nevertheless, should the political situation subside by mid-2014, domestic demand was expected to pick up and would be the driver of economic growth together with exports. As a consequence, the Thai economy would resume growing close to its normal pace in 2015. Meanwhile, inflationary pressure edged up mainly from the pass-through of LPG cost to food prices, while demand pressure softened in line with economic conditions.

In the past three meetings, the MPC voted to reduce the policy rate by 0.25 percent in the first meeting, hold the policy rate at 2.25 percent per annum in the following meeting and then voted to reduce the policy rate by another 0.25 percent to stand at 2.00 percent per annum in the latest meeting. The MPC deemed that there was room for monetary policy to ease in order to lend more support to the economy during the recovery period, while inflationary pressure was not yet a concern.

The slowing of the Thai economy is also reflected in the weak performance of the USD/THB. From its recent high at 29.48 it sank to a low point of 33.15 in January this year – it has failed to stage much of a recovery since then.

Thai Bonds made a recent high in May 2013 at 3.29%. During the capital repatriation, yields backed up to 4.50% but have since fallen back to 3.39% – testament to the weakness of economic conditions.

The SET Index, by contrast has followed the global trend since making a low in January. It remains some distance below its May 2013 high. If the THB remains weak then the SET Index should benefit but the continued political unrest is likely to sap international enthusiasm for investment. This Bloomberg Business Week article may be useful by way of background.

 Malaysia

Those who remember the Asian crisis of 1997 will recall that Malaysia took the decision to impose foreign exchange controls. At the time many market participants forecast the demise of the Malaysian economy. They were proved incorrect, however, the risk that an investment cannot be liquidated and the proceeds repatriated, still hangs over Malaysian financial markets. This is a double-edged sword; volatility in MYR remains significantly lower than for IDR or INR. According to the IMF Malaysia has the greatest sensitivity to Capital Flows of the Emerging Asia countries. The price action of the past few years suggests this may no longer be the case.

After the removal of exchange controls in 2005 the MYR quickly appreciated from USD/MYR 3.8 to around 3.20 by mid-2008. The crisis saw the currency fall briefly to 3.70. By mid-2011 it was touching 3.00. The 2013 “tapering-tantrum” took the rate back to 3.46 in January 2014 but this year it has followed the other Asian currencies, recovering its composure.

But what are the prospects for the Malaysian economy? This monthsBank Negara Malaysia – Monetary Policy Statement – May 2014 provides a good overview: – 

Global growth moderated in the first quarter with several key economies affected by weather-related and policy-induced factors. Looking ahead, the global economy is expected to remain on a path of gradual recovery. In Asia, the better external environment provides further support to growth amid continued expansion in domestic demand. Conditions in the international financial markets have also improved following gradual and orderly policy adjustments in the major advanced economies while the impact from geopolitical developments remains contained.

For Malaysia, latest indicators suggest that the domestic economy continued to register favourable performance in the first quarter. Going forward, growth will remain anchored by domestic demand with additional support from the improved external environment. Exports will continue to benefit from the recovery in the advanced economies and regional demand. Private sector spending is expected to remain robust. Investment activity is supported by broad-based capital spending, particularly in the manufacturing and services sectors. Private consumption will be underpinned by stable income growth and favourable labour market conditions. The prospects are therefore for the growth momentum to be sustained.

Inflation has stabilised in recent months amid the more favourable weather conditions and as the impact of the price adjustments for utilities and energy moderate. Going forward, inflation is, however, expected to remain above its long-run average due to the higher domestic cost factors.

Amid the firm growth prospects and inflation remaining above its long-run average, there are signs of the continued build-up of financial imbalances. While the macro and micro prudential measures have had a moderating impact on the growth of household indebtedness, the current monetary and financial conditions could lead to a broader build up in economic and financial imbalances. Going forward, the degree of monetary accommodation may need to be adjusted to ensure that the risks arising from the accumulation of these imbalances would not undermine the growth prospects of the Malaysian economy.

Moderate growth, stable, but above target, inflation and risks of further inflationary pressure ahead; not the most compelling grounds for investment. This doesn’t appear to have dampened enthusiasm for Malaysian stocks. The KLCI Index has barely looked back since the 2008/2009 crisis. It witnessed a small correction in the fall of 2011 and an even smaller one during the summer of 2013. This month it took out the December 2013 highs. From a technical perspective one should remain long and be adding to that exposure. The Bank Negara report, however, prompts some caution.

Malaysian Bonds also reflect the central bank’s cautious tone. Having made post crisis lows at 3.06% in May 2013 the bond market fell during the second half of 2013 to peak at 4.31% in January. Since then the yield has fallen moderately. At the current yield (4%) even with a 1% positive yield curve I don’t perceive much attraction at this level.

Philippines

The Philippines suffered an appalling natural disaster last year when Typhoon Haiyan unleashed its wrath. It caused an estimated $770mln of damage but I don’t believe this was enough to derail what looks to be a strong growth story. According to the IMF it is above its trend growth rate, but inflation seems under control and the political will to reform the underperforming aspects of the economy seem to be in place. The Bangko Sentral ng Pilipinas – Q1 2014 Inflation Report takes up the story:-

Headline inflation rises on higher food and nonfood inflation. y) headline inflation ‐s inflation target range of 1.0 ppt for 2014. The uptick in headline inflation could be attributed to higher food inflation as the prices of most food commodities increased owing to some tightness in the domestic supply conditions. Similarly, higher electricity rates and domestic petroleum prices contributed to food inflation. The official core inflation along with two out of three alternative measures of core inflation estimated by the BSP likewise rose in Q1 2014 relative to the rates registered in the previous quarter. The official core inflation was slightly higher at 3.0 percent during the review quarter from 2.9 percent in Q4 2013. The number of items with inflation rates greater than the threshold of 5.0 percent also increased and accounted for a higher proportion of the CPI basket.

Domestic demand conditions remain buoyant. The Philippine economy continued to expand at an year 2013 GDP growth to 7.0 percent for the year. Output growth was driven by robust household spending, exports, and capital formation (particularly durable equipment) on the expenditure side; and by solid gains in the services sector on the production side. At frequency demand indicators continued to show positive readings in the first quarter. Vehicle sales posted strong growth during the quarter, buoyed by brisk consumer demand and attractive financing options offered by industry players. Energy sales also continued to rise, albeit at a slower pace, on account of increased consumption by the industrial and commercial sectors, while capacity utilization in manufacturing is steady above 80 percent. The composite Philippine Purchasing expansion threshold at 58.2 in Q4 2013 levels. Similarly, the outlook of businesses and consumers for the following quarter turned more favorable, supporting the continued strength of aggregate demand in the coming months amid sustained credit growth and ample liquidity in the financial system.

…Local financial markets experience bouts of volatility but regain some stability. s tapering of its quantitative easing (QE) measures and potential abrupt adjustments in its policy stance as recovery in the US firms up. Indications of a further economic slowdown in China likewise quarter owing to positive domestic economic reports suggesting sustained resiliency of Philippine macroeconomic fundamentals along with expectations of continued strong corporate earnings. The US Fed pronouncement to scale back stimulus in measured steps further propelled optimism in the local s average, while the spread on Philippine credit default swaps (CDS) continued to trade lower relative to those of our neighbors in the region. The Philippine Stock Exchange index (PSEi) also began to recover gains lost in bill auctions during preference bills. However, the peso recorded moderate depreciation relative to previous quarter on lingering uncertainty on the external front.

Inflation expectations continue to support the withintarget inflation outlook. s target 2015. Analysts expect inflation to rise going forward due largely to factors such as pending electricity rate adjustments, weakening peso, and possible increases in food and oil prices. Results of the March 2014 Consensus Economics inflation forecast survey for the country also showed a higher mean inflation projection for 2014.

The BSP maintains key policy rates but adjusts the reserve requirement ratio. The BSP decided to keep its policy interest rates steady during its 3 February and 27 March 2014 monetary policy meetings on the assessment that the future inflation path was likely to stay within the target ranges of 1.0 ppt for 2015. At the same time, the MB decided to increase the reserve requirement by one ppt effective on 11 April 2014 to help guard against potential risks to financial stability that could arise from the recent rapid growth in domestic liquidity.

Prevailing monetary conditions and inflation dynamics suggest that the space to keep monetary policy settings unchanged is narrowing. Latest baseline projections continue to show average headlineinflation settling within the target ranges for 2014 and 2015. However, current assessment of the priceenvironment over the policy horizon indicates that the balance of risks to the inflation outlook remainstilted to the upside, with potential price pressures emanating from pending petitions for adjustments inutility rates and from possible increases in food and oil prices. At the same time, while inflation expectations are still within target, they have trended higher and are moving near the upper end of the target range for 2015. Firm growth dynamics arising from the broad buoyancy of domestic demand also suggest that the economy can accommodate measured adjustments in monetary conditions. trust account placements in the SDA facility in November with more loanable funds deployed to support domestic economic activity as evident by the robust growth in bank lending. The continued strong liquidity up of financial stability risks. On the whole, the BSP continues to have monetary policy space to address the challenges that could threaten the inflation objective and stability of the Philippine financial system.

Going forward, the BSP will remain guided by its primary objective of maintaining price stability along with safeguarding the resilience of the financial system, and stands ready to deploy appropriate measures as needed to ensure sustainable, non‐inflationary, and inclusive economic growth.

The USD/PHP exchange rate remains weak but the overall decline in the PHP was less dramatic than for some of its Emerging Asia neighbours. From a March 2013 high of 40.40 it weakened to just above 46 by March this year. It is currently around 43.60. This should benefit the Philippine equity market.

The PSEI Index, however, has some way to go before breaching its May 2013 high at 7403. The technical picture looks similar to Thailand and Malaysia but the economic fundamentals are more supportive. At 6900 the index still presents a buying opportunity.

The Philippine Bond market doesn’t present such an obvious opportunity. After making highs this time last year at 3.04% yields had risen to 4.63% by March of this year. Now at 4.31% they offer the lowest real yield of the group.

Conclusion

International capital is flowing back into emerging Asia. A World Bank study earlier this year found that 60% of the investment in emerging markets between 2009 and 2013 has been due to quantitative easing and related policies of developed country central banks. The Bank of Japan continue with the Three Arrows – I hear rumours of more radical policies to come. The Fed is still adding $55bln per month. The ECB may be ready to do there bit for European growth. The Basel III rules are being gradually diluted – which, through the multiplier effect, may eclipse any reduction of QE by the Fed. In this environment Emerging Asia should benefit from inward capital flows and growth in exports to the recovering economies of the US, UK and even some parts of Europe. China will continue to rebalance toward consumption but its neighbours should benefit longer-term; I would anticipate an increase in capital expenditure by Asian companies in expectation of greater consumer demand from China.

My favoured equity market is the Philippines followed by India. My favoured bond market is India on the grounds that it offers the highest nominal yield in this group of emerging markets. As for the top currency, again I choose India. The INR and IDR will both benefit from the carry trade, but India is a larger and more balanced economy. It is therefore more insulated from concerns about a commodity collapse as China’s economy slows.

Canada – Australia – New Zealand – Commodities vs Housing


400dpiLogo

Macro Letter – No 11 – 09-05-2014

Canada – Australia – New Zealand – Commodities vs Housing

  • Commodity prices continue to decline due to slowing Chinese growth
  • Rising real estate prices in Canada, Australia and New Zealand ignore commodity demand
  • What does this mean for their stock, bond and currency markets?

Since the initial recovery in 2010 the price of Iron Ore and Coking Coal has declined due to lower demand from China. Australian Coking Coal hit a six year low in April. This downturn in demand has also been evident in the price of Copper and other industrial metals. Last year grain prices also tumbled adding to the pressure on commodity exporting countries: although prices for New Zealand’s Dairy Products remained firm.

Since Australia and New Zealand have similar major trading partners, and are geographically close when compared to Canada, they tend to be considered together whilst Canada is grouped with other NAFTA countries. I want to review these three countries together. To begin I’ve constructed a table which highlights some of the similarities and differences between these “commodity” countries.

Country Main Exports Export Markets
Canada Oil, Wood Products, Chemicals USA (73%) EU (5%) UK (4%)
Australia Coal, Iron, Wheat, Aluminium China (30%) Japan (19%) S. Korea (8%)
New Zealand Dairy Products, Meat, Wool Australia (21%) China (15%) USA (9%) Japan (7%)


During the decline in commodity prices the currency markets have reflected these dynamics quite accurately. The CAD and AUD have been steadily falling vs the US$  – although these trends may be starting to reverse. The NZD by contrast has continued to appreciate not only against the US$ but also against its “commodity cousins”.

The chart below shows the NZD Trade-weighted index up to mid 2013 – it has continued to appreciate since then.

NZD TWI - source ricardianambivalence.com

Source: ricardianambivalance.com

The AUD Trade-weighted index chart is updated to the beginning of 2014 – it continued to weaken until last month.

AUD TWI - source FXstreet.com

Source: fxstreet.com

The third chart is of the CAD effective exchange rate – it also shows foreign capital flows.

CAD effective exchange rate and capital flows

Source: Business in Canada

Plus ça change, plus c’est la même chose

The currency markets reflect Canada and Australia’s reaction to the weakness of Chinese demand, the rising NZD points to other factors. Before I delve into the real estate market I thought the table below might be useful, it looks at a number of economic indicators across the three countries. In many respects these economies are quite similar.

Country GDP Unemploy CPI Current A/C Budget Base Rate 10 yr Debt/GDP
Canada 2.7 6.9 1.5 -3.2 -1 1 2.35 89.1
Australia 2.8 5.8 2.9 -2.9 -1.2 2.5 3.82 20.5
New Zealand 3.1 6 1.5 -3.4 -2.1 3 4.31 35.9


New Zealand is delivering the strongest GDP growth with the highest real interest rates, but all three countries are suffering from twin budget and current account deficits. Considering the weakness of commodity markets and their reliance on those export markets it is clear that other factors are driving growth.

A quick review of the central bank policy reports reveals another common theme – real estate.

Bank of Canada – Monetary Policy Report – April 2014

Inflation in Canada remains low. Core inflation is expected to stay well below 2 per cent this year due to the effects of economic slack and heightened retail competition, and these effects will persist until early 2016. Total CPI inflation is forecast to be closer to 2 per cent over the coming quarters and remain close to target thereafter.

The global economic expansion is expected to strengthen over the next three years, as headwinds that have been restraining activity dissipate.

In Canada, the fundamental determinants of growth and inflation continue to strengthen gradually, as anticipated.

The Bank continues to expect Canada’s real GDP growth to average about 2 1/2 per cent in 2014 and 2015 before easing to around the 2 per cent growth rate of the economy’s potential in 2016.

No mention of concern about an overheated real estate market in the highlights, however later in the summary they do state: –

Recent developments are in line with the Bank’s expectation of a soft landing in the housing market and stabilizing debt-to-income ratios for households. Still, household imbalances remain elevated and would pose a significant risk should economic conditions deteriorate.

Perhaps the BoC don’t believe it’s their job to reign in the housing market. The Canadian government has imposed several rule changes to curtail the allure of property but, whilst price rises have slowed the correction has yet to materialise. March 2014 house prices were unchanged for the first time in 15 years – it’s too early to predict the top just yet.

The Economist picked up on real estate earlier this month. They pointed out that Canadian household debt has increased from 76% of GDP in Q3 2007 to 93% in Q3 2013. On their measure Canadian property is 76% above its long-term average and on a rent to income basis, 31% overvalued.

The BoC summary also ignores a dichotomy within Canada. Since the crisis of 2008 the populous manufacturing heartlands, Ontario and Quebec (60% of Canada’s population) have seen little economic recovery. The commodity exporting Western states, by contrast, have rebounded – although they are now slowing in response to weaker Chinese demand. Government energy policy remains focussed on supplying the Chinese and Japanese markets with Oil and LNG. China has also been a major investor in Canadian energy companies both directly and indirectly. Since 2007 China is estimated to have invested C$119bln in this sector according to a recent Jamestown Foundation report.

A sustained US economic recovery may insure that Canadian economic growth becomes more balanced over the next couple of years – after all, 73% of Canadian exports are to the US – however, the Canadian government has a gaping budget deficit to plug. In 2008 they were in surplus – they hope to balance the books once more by 2015/2016. This may be a tall order; at the provincial level Ontario has the largest debt of any Canadian state and a debt to GDP ratio of 37.5% – the outstanding amount, C$267.5bln, is significantly larger than the debt of California. Quebec, not to be eclipsed, boasts the largest debt to GDP ratio at 49%, although its total is lower. The Fraser Institute forecast that this will rise to 57% of GDP by 2022/2023 if they continue with their current policies.

Canadian real estate prices are also a concern for the international markets since six Canadian financial institutions dominate the domestic mortgage market. They have combined financial assets equivalent to five times Canada’s GDP – unlike the US Canada has a “Too big to bail” problem.

Reserve Bank of Australia – Monetary Policy Committee Minutes – April 2014

Recent indicators for the global economy suggested that activity in Australia’s major trading partners in the early part of 2014 had expanded at around its average pace…

…In China, data for the first few months of 2014 had suggested a continuation of the easing in economic growth that had started in the latter part of 2013…The targets for inflation and money growth in China were also unchanged for 2014.

Recent data for the United States were consistent with further moderate growth in the economy…

In Japan, domestic demand growth had remained strong, with activity picking up prior to the consumption tax increase at the beginning of April…In the rest of east Asia, growth had continued at around the average of the past decade, while economic conditions in India remained subdued…

Global commodity prices had declined since the previous Board meeting. The spot price for iron ore had been volatile over recent weeks, while steel prices in China had declined and spot prices for coking and thermal coal were well below current contract levels. The fall in the price of steel in China over recent weeks was consistent with a softening in demand. At the same time, the supply of steel appeared to have been constrained by a tightening in credit conditions reflecting the Chinese authorities’ concerns about pollution. Base metals prices had also declined, though rural commodity prices were a little higher.

Domestic Economic Conditions

Members began their discussion of the domestic economy with the labour market, which remained weak despite a strong rise in employment in February and an upward revision to employment in January…Meanwhile, a range of indicators of labour demand suggested a modest improvement in prospects for employment, although the unemployment rate was still expected to edge higher for a time.

The national accounts, which had been released the day after the March Board meeting, reported that average earnings growth over the year to the December quarter 2013 had remained subdued. With measured growth in labour productivity around the average rate of the past two decades, nominal unit labour costs were unchanged over 2013.

Members recalled that the national accounts reported that GDP rose by 0.8 per cent in the December quarter and by 2.8 per cent over the year, which was a little stronger than had been expected. In the quarter, there had been further strong growth of resource exports, while growth in consumption and dwelling investment picked up a little and business investment declined. Public demand had made a surprisingly strong contribution to growth, but planned fiscal consolidation at state and federal levels was likely to weigh on public demand for some time…

Retail sales had increased by 1.2 per cent in January, continuing the pick-up in momentum that began in mid 2013. The Bank’s liaison with firms suggested that, more recently, retail sales growth may have eased from this strong rate. Motor vehicle sales declined further in February, as had measures of consumer confidence over recent months, but the latter were still around their long-run averages.

Housing market conditions remained strong, with housing prices rising in March to be 10½ per cent higher over the year on a nationwide basis. Members noted that dwelling investment had increased moderately in the December quarter, with a pick-up in renovation activity, and that the high level of dwelling approvals in recent months foreshadowed a strong expansion in dwelling investment…

Business investment fell in the December quarter, driven by a large decline in machinery and equipment investment and falls in engineering and non-residential building construction. While much of the decline appeared to have been driven by mining investment, non-mining business investment was also estimated to have declined in the quarter. More recently, non-residential building approvals had increased in January and, in trend terms, were at their highest level since 2008, with increases evident across a range of categories, including the office, industrial and ‘other commercial’ sectors…

Conditions were not sufficiently robust to prompt a change in monetary policy. Perhaps this is because the markets are focussed on next week’s deficit busting budget. What is clear is that manufacturing continues to struggle. According to a report from the Boston Consulting Group, Australia has the highest manufacturing cost of the top 25 largest exporting nations. This poor performance is reinforced by a report from the Productivity Commission pointing to a -0.8% fall in Multi-Factor Productivity (MFP).

The biennial IMF Fiscal monitor – published last month – placed Australia at the top of the list of developed countries with the fastest deteriorating economies relative to forecast. They focussed on the government budget deficit – currently the third largest of all developed nations, behind Japan and Norway. They urged the Australian government to take draconian measures to bring Debt to GDP ratio down toward 70% by 2020.

There has been much discussion of potential changes to the tax treatment of mortgages which could puncture the buy to let market, where “negative gearing” has been prevalent.  The RBA acknowledged that housing construction is now “Strong” vs “Solid” at its March meeting. The Australian Bureau of Statistics – Trends in Household Debt  was released this month showing household debt is at the highest level in real term for 25 years. The Household debt to Income ratio is currently the highest in the developed world at 180%, though Canada isn’t far behind at 165%.

Before you rush to sell your second home down-under it is worth noting that on the basis of Mortgage Interest to Income Australian property is not that expensive. The current ratio is 7% down from 12% in 2008 – although still above the 50 year average of 5%, it reflects today’s benign inflation and lower interest rate environment.

Longer term commodities are still a major source of economic growth, but Australia is ranked 79 in terms of Economic Complexity, with New Zealand at 48 and Canada at 41. All three countries have falling productivity; Australia’s average is -1.3, New Zealand -1.2 and Canada -1.1. In the shorter term, it seems that real estate is the main driver of growth and that growth is based on leveraged household debt.

Reserve Bank of New Zealand – Monetary Policy Statement – March 2014

The Reserve Bank today increased the OCR by 25 basis points to 2.75 percent.

New Zealand’s economic expansion has considerable momentum, and growth is becoming more broad-based.

GDP is estimated to have grown by 3.3 percent in the year to March…

Prices for New Zealand’s export commodities remain very high, and especially for dairy. Domestically, the extended period of low interest rates and continued strong growth in construction sector activity have supported recovery. A rapid increase in net immigration over the past 18 months has also boosted housing and consumer demand. Confidence is very high among consumers and businesses, and hiring and investment intentions continue to increase.

Growth in demand has been absorbing spare capacity, and inflationary pressures are becoming apparent, especially in the non-tradables sector. In the tradables sector, weak import price inflation and the high exchange rate have held down inflation. The high exchange rate remains a headwind to the tradables sector. The Bank does not believe the current level of the exchange rate is sustainable in the long run.

There has been some moderation in the housing market. Restrictions on high loan-to-value ratio mortgage lending are starting to ease pressure, and rising interest rates will have a further moderating influence. However, the increase in net immigration flows will remain an offsetting influence.

While headline inflation has been moderate, inflationary pressures are increasing and are expected to continue doing so over the next two years. In this environment it is important that inflation expectations remain contained. To achieve this it is necessary to raise interest rates towards a level at which they are no longer adding to demand. The Bank is commencing this adjustment today. The speed and extent to which the OCR will be raised will depend on economic data and our continuing assessment of emerging inflationary pressures.

By increasing the OCR as needed to keep future average inflation near the 2 percent target mid-point, the Bank is seeking to ensure that the economic expansion can be sustained.

I have always been impressed by the hawkish credentials of the RBNZ, governor Graeme Wheeler is taking a proactive approach to potential inflationary pressure. However, since these minutes were published the RBNZ has announced that it will intervene on the foreign exchanges to stem any excessive rise in the value of the NZD. The New Zealand currency is near to a 40 year high. Rather than keeping interest rates artificially low to reduce the attraction of NZD as a destination for foreign capital flows, they have chosen to intervene. Governor Wheeler identifies four economics risks which might presage a reversal in NZD strength: –

  1. Weakening of US growth
  2. Fall in dairy prices
  3. Fall in Chinese growth
  4. Increase in financial market volatility leading to a “Risk-Off” environment

The RBNZ has also been courageous in articulating another problem with the current New Zealand policy mix in relation to the “High Immigration Policy”. Board member, Michael Reddel’s working paper – The long-term level “misalignment” of the exchange rate – discusses this subject, it  observes that immigration does not guarantee rising living standards for everyone. He goes on to suggest that “Capital Deepening” from immigration has failed to show up improved MFP. The undesirable side-effects of the policy, however, can be seen in rising land and property prices due to finite supply and increased demand from immigrants, together with foreign capital inflows which have supported the NZD. This has led to a reduction in real incomes and an increase in real interest rates.

The New Zealand government has established a housing affordability target of four time income – this being the long-run average. The current level in Auckland is seven times.

It is worth noting that Australia has similar policies on immigration and similar problems with housing affordability.  The foreign buyers are often Chinese – as the Chinese real estate bubble implodes, one has to wonder how long this will continue.

Real Estate, Currency, Bonds or Stocks

The real estate markets in Canada, Australia and New Zealand are all at or near all time highs, their levels of household debt are similarly extended. Given the illiquid nature of real estate as an asset class now is not the time to buy. The trend is still upward, but when markets reverse those with poor liquidity “gap” lower; the risks in real estate look asymmetric, now is a good time to reallocate to more liquid assets.

I’ve already reviewed the relative merits of the three currencies but, to reiterate, I continue to favour NZD over CAD and, because Canada has a more balanced economy in terms of export markets and economic complexity, I favour CAD over AUD – although CAD/AUD is not a compelling trade in itself.

Canadian 10 yr bonds made their highs in July 2012 yielding 1.56%, by September 2013 they had followed US Treasuries lower to yield 2.83%. Now at 2.4% they are in a neutral range.

By contrast the TSX Index has made new highs this month. Momentum is slowing but the trend remains firmly in tact – remain long but be tentative if establishing new positions. The BoC are not expecting a dramatic increase in growth in 2015/2016 – thereafter they expect growth to slow towards 2%.

Australian 10 yr bonds also hit their highs in July 2012 at 2.68%. In line with the weakness of US Treasuries they declined until yields reached 4.50% in December 2013. Since then they have rallied to 3.83%. The beginning of an up trend is in place, supported by expectations of an extended period of unchanged policy from the RBA. The Australian governments decision to freeze fuel taxes last month means they have an additional A$5bln shortfall in income – the fiscal tightening required to balance the budget is likely to stay the RBAs hand for some time to come – of the three countries, this is my favoured bond market.

With fiscal tightening on the cards it was surprising to see the ASX Index making new highs in April. The momentum is stronger than in Canada and the trend is quite clear. Once the terms of the budget are announced next week it may be easier to consider establishing new longs; I would prefer to see the market make new highs by way of confirmation; if Canberra bites the bullet, Australian stocks might bite the dust.

New Zealand 10 yr bonds made their highs in May 2013 at 3.17%, by December 2013 they had fallen to 4.88%. In line with most other bond markets they have rallied this year to a current yield of 4.31%. The recovery looks weak and the recent interest rate hike by the RBNZ, together with their more up-beat assessment of potential growth and inflation, makes NZ bonds the least attractive of the three bond markets. The three markets have almost identical yield curve shapes (1.30/1.35 bp positive) but, starting with structurally higher rates, I believe the New Zealand curve should be steeper at this stage in the cycle. I’ve tried to trade the Kiwi yield curve in the past and been burnt by the pro-active policies of the RBNZ – please don’t regard this as a recommendation.

The NZ 50 Index, along with the Canadian and Australian indices, has made new highs in the past month. The momentum is stronger than in the TSX or ASX, which is justified by the fundamental assessment of the RBNZ. The negative impact of a strengthening currency should be tempered by RBNZ intervention. This will also encourage capital flows into stocks, since the “carry trade” is capped. RBNZ tightening in expectation of inflation is likely to encourage liquidation of bond holdings, again favouring stocks.

The only cloud on an otherwise rosy horizon is the liquidity risk associated with New Zealand markets in general. In the latest survey of GDP growth by The World Bank, Canada was ranked 11th,Australia 12th whilst New Zealand came in at 55th. As RBNZ governor Wheeler pointed out, one of the risks to the New Zealand economy is a reversal of foreign capital flows if financial market volatility increases. Barring a return of the “Risk-Off” trade, I favour New Zealand Equities; hedged, but only if you really need to, by a short position in New Zealand bonds.

The limits of convergence – Eurozone bond yield compression cracks


400dpiLogo

Macro Letter – No 10 – 25-04–2014

The limits of convergence – Eurozone bond yield compression cracks

  • European bond yields have been converging since 2012 – but for how much longer?
  • There are three scenarios – a federal system, a semi-federal system, or a devolved Europe
  • Are yields converged under the different scenarios or has it further to go?


Compression cracks, in the geological sense, are a form of brittle deformation. This might be a good way to describe the political process that has driven European government bond yields since the Euro crisis of 2012.

Since the beginning of 2014 the “Convergence Trade” – buying higher yielding Eurozone government bonds and selling German Bunds – has continued to be one of the most profitable fixed income opportunities, as the table below illustrates:-

Country                                15/01/2014                         16/04/2014                  Change

                                                Yield     Spread                  Yield     Spread

Germany                                   1.82%    N/A                            1.50%    N/A                     N/A

Netherlands                             2.13%    0.31%                         1.83%    0.33%               +0.02%

France                                       2.47%    0.65%                        1.97%    0.47%                -0.18%

Ireland                                      3.27%    1.45%                         2.87%    1.37%                -0.08%

Spain                                         3.82%    2.00%                        3.09%    1.59%               -0.41%

Italy                                           3.88%    2.06%                        3.11%    1.61%                -0.45%

Portugal                                    5.25%    3.43%                        3.80%    2.30%              -1.13%

Greece                                       7.93%    6.91%                        6.46%    4.96%               -1.15%

Source: Bloomberg


The two charts below show this process over a longer time horizon. The first, from True Economics, looks back to the period of convergence prior to the introduction of the Euro. It shows the extraordinary stability, both in terms of absolute yield and spread differentials, for the period from 1999 until the Lehman default in 2008. The subsequent divergence is more clearly captured by the second chart which also shows Gilt yields; they might be regarded as a surrogate for the global bond market’s reaction to the financial crisis and subsequent Euro crisis.

Europe Bond Yields - 1993 - 2011

Source: Trueeconomics.com


European Bond Yields - 2005 - 2014 - Bloomberg

Source: Bloomberg


What is clear from both charts is the bond market’s sudden realisation, after 2008, that the ECB and the EU Commission might not be in a sufficiently strong position economically and, more importantly, politically, to avert a break-up of the Euro.

Whilst Irish Gilt yields had already begun to decline in 2011, due to their adoption of radical measures in response to economic depression, the turning point, from divergence to convergence, for the rest of the EZ, commenced after Mario Draghi’s speech on 26th July 2012 in which he said “Within our mandate, the ECB is ready to do whatever it takes to preserve the euro. And believe me, it will be enough.”  

The European Commission had been analysing EZ bond spreads for some time before the 2011 Euro crisis as this paper from November 2009 shows – Determinates of intra-euro area government bond spreads during the financial crisis. The paper noted that the average spread over German Bunds between 1999 and mid-2007 had been 18bp. They concluded: –

 Although conditions on government bond markets have been easing considerably since spring 2009, it seems unlikely that spreads will revert to pre-crisis levels in the near future. A number of elements suggest this. First, the strong rise in financing costs by sovereign issuers since September 2008 may, to a certain extent, be explained by the correction of abnormally narrow spreads in the pre-crisis period, when domestic risk factors resulted in small yield differentials. Second, it can be expected that government bond yield spreads will remain elevated compared to the pre-crisis period as debt levels have increased significantly in a number of countries (relative to the German benchmark) and the contingent liabilities assumed by the public sector in rescuing the financial sector will continue to weigh on the outlook for public finances.

Looking further ahead, greater market discrimination across countries may provide higher incentives for governments to attain and maintain sustainable public finances. Since even small changes in bond yields have a noticeable impact on government outlays, market discipline may act as an important deterrent against deteriorating public finances.


Three scenarios for Eurozone bonds

I believe we should consider three possible scenarios with very different outcomes for yield differentials.

1. Full Banking Union and further Federalization of Europe

Under this scenario the ECB becomes the “back-stop” to all members of the Eurozone. The European Parliament wrests partial control of spending from the individual state governments, but, in the process, becomes an unofficial guarantor of the obligations of EZ member states.

In this environment yield spreads will reflect a possible default risk and a liquidity risk. I see a parallel with the US Treasury market yield differential for On-the-run and Off-the-run issues but with an additional small default premium – unless the EU guarantee becomes de juro.

A fascinating study of this phenomenon is Liquidity ‘life cycle’ in US Treasury bondswhich was published in January 2012 by the European Financial Management Association – the table on page 26 analyses the period 1996-2006. For 30 year bonds the mean yield differential is 13 bp with a range of -34 to +93 dependent upon the issue. 

A prior paper on this subject was published in the January 2009 by the Journal of Financial Economics – The on-the-run liquidity phenomenon. This proposes an interesting model for measuring and forecasting the phenomenon. They conclude: –

Our evidence indicates that (i) the resulting off/on-the- run liquidity differentials are large, even after controlling for several differences in their intrinsic characteristics (such as duration, convexity, repo rates, or term premiums), and (ii) an economically meaningful portion of those liquidity differentials is linked to strategic trading activity in both security types. The nature of this linkage is sensitive to the uncertainty surrounding auction shocks and the economy, the intensity of investors’ dispersion of beliefs, and the noise of the public announcement. In particular, and consistent with our model, off/on-the-run liquidity differentials are smaller immediately following bond auction dates and in the presence of (high-quality) macroeconomic announcements, and larger when the dispersion of auction bids is higher, when fundamental uncertainty is greater, and when the beliefs of sophisticated traders are more heterogeneous.

These findings suggest that liquidity differentials between on-the-run and off-the-run securities depend crucially on endowment uncertainty in the former and the informational role of strategic trading in both.

2. Full Banking Union but limitation of Federalization

Persuading German voters to bail-out the “profligate sons” of Europe is a tall order; however, a collapse an subsequent exit of the countries of the periphery would cause catastrophic damage to the German banking system. A constructive compromise would be to allow limited outright monetary purchases (OMT) together with limited issuance of “Euro Bonds”. This is a slippery slope but, in the consensual world of European politics, I think it is the most likely outcome. After all, the European Financial Stability Fundhas already helped to bail-out Greece, Ireland and Portugal and the European Stability Mechanismcontinued its bail-out of Cyprus this month bringing the total support for Cyprus to Eur 4.5bln.Here is the latest statement from Klaus Regling – MD of the EMS.

The idea that government bonds of individual states are not underwritten bears some similarity to US state issuance in the municipal bond market. Muni bonds have certain tax advantages which makes absolute yield comparison with US Treasuries difficult but their lack of a federal guarantee makes them a useful comparator.

With the exception of Puerto Rico (BB+) all US state Muni bonds are currently rated from AAA to A-. On 10th April 2014 the generic yield on 10 yr Muni Bonds was as follows: –

Rating   Yield     Spread

AAA          2.37%        N/A

AA             2.57%      0.20%

A                3.06%     0.69%

Source: Morgan Stanley


During the depths of the post Lehman crisis in 2008 the spread between AAA and A widened to 160bp. Anecdotally, the last time I looked at Muni Bond spreads as a surrogate for European bonds was in 1998 – the differential between highest and lowest rated state was 109bp. At that time I felt European yields had already converged too much and advocated the “Divergence Trade”, but, as JM Keynes once remarked “The markets can remain irrational longer than I can remain solvent.” I’m glad I didn’t bet the ranch!

3. Eurozone break-up 

I don’t think this scenario is likely because too much political investment has been made in the “European Project”; they will do “whatever it takes”. However, for the purposes of comparison, it is useful to consider where yield differentials might be for European governments once they have been relieved of their Euro straightjackets.

Here is a table of some European 10 year bond yields for non-EZ countries, together with their spread over German Bunds, taken on 16th April 2014, I’ve also added their World Bank GDP ranking: –


Country             Yield               Spread                  GDP        

Switzerland        0.87%                    (0.63%)                 20

Denmak               1.52%                    0.02%                    33

Czech Rep           1.99%                    0.49%                    51

Sweden               2.00%                    0.50%                    22

UK                       2.65%                     1.15%                      6

Norway               2.86%                    1.36%                    23

Latvia                  3.00%                    1.50%                    93

Lithuania            3.30%                    1.80%                   83

Bulgaria              3.30%                    1.80%                   75

Slovenia              3.63%                    2.13%                   79

Poland                 4.14%                    2.64%                   24

Croatia                 4.87%                   3.37%                   70

Romania              5.24%                   3.74%                   56

Hungary              5.74%                    4.24%                  58

Iceland                 6.71%                    5.21%                   121

Turkey                  9.95%                   8.45%                  17

Source: Bloomberg

The yield differentials of these countries reflect several factors including inflation, debt levels and growth expectations, however there are some useful observations.

Firstly the Swiss National Bank has been intervening to halt further appreciation in the CHF exchange rate. They have also been combating deflationary forces for an extended period.

The UK economy has been exhibiting some of the strongest growth in Europe this year but has also been beset by above target inflation for a protracted period until very recently.

Turkey, whilst it is the second largest economy in the table, is less “European” in structure; it may remain interested in joining the EU but it is culturally and politically “another country”.

Iceland is the smallest economy in the table but it is also a “post-crisis” country and therefore reflects lenders perceptions of a country’s credit worthiness, post-default.


Yield spreads – where are they now and where will they go?

Returning to the EZ countries, I want to narrow my analysis to Spain, Italy, Portugal and Greece. These are the countries with reasonably liquid government bond markets which are also benefitting most clearly from the brittle yield compression of the EZ. Where are their yields today and where might be fair-value under the three scenarios outlined above.


Country                Yield                     Spread                  GDP

Spain                        3.09%                         1.59%                     13

Italy                          3.11%                          1.61%                      9

Portugal                   3.80%                        2.30%                    46

Greece                      6.46%                        4.96%                    42

Source: Bloomberg

Firstly, a leptokurtic excuse – in my estimates below I am ignoring times of economic crisis since these are “Black Swan” events with highly unpredictable outcomes.

Scenario 1. 100bp

Where individual EZ states receive a tacit guarantee from Brussels; I would expect a maximum spread of 100bp. This makes all the above issuers still look attractive from a yield enhancement perspective.

Scenario 2. 200bp

Where individual EZ states are not guaranteed: and therefore subject to the discipline of the market; I would expect the maximum spread to reach 200bp. This still makes Portugal and Greece look relatively cheap. Italy and Spain may head towards the levels of France (49bp) but this is unlikely to be sustainable unless they radically change their attitude towards deficit spending. Alternatively, French yield premiums may rise up to meet them.

Scenario 3. 500bp

Where the single currency area breaks up; I would imagine the individual currencies taking much of the strain through devaluation and estimate a maximum spread of 500bp. However, the inflationary effects of currency devaluation may lead to a significant rerating – a glance at the first chart showing Greek Bond yields in the mid-1990’s is an example of the additional premium high-inflation countries have to pay. In 1990 Greek CPI averaged 19.8% by 1995 CPI had fallen to 9.3% whilst its long-term interest rates still averaged 17.4%, a legacy of the high-inflation years; its Debt to GDP ratio was 110% – remaining at around this level up to their adoption of the Euro. The bond markets are slow to forgive inflationary and profligate tendencies.

In the analysis above I have made one critical assumption, which is that German Bund yields remain broadly at there current level (1.5% – 2.0%). During the “honey-moon” period from 1999 to 2007 yields on 10 year German Bunds ranged between 4% to 6% – other EZ issuers paid an average 18bp premium. If Bund yields return to the 4% to 6% range, but inflation remains around the ECB target, I would expect lenders to demand an additional premium of between 50bp and 100bp under the first two scenarios.

Conclusion

The convergence trade in European bonds looks set to continue but the attraction of this carry trade is steadily diminishing. I think Scenario 2 – Full Banking Union but limitation of Federalization – to be the most likely: in other words, limited Eurobond issuance. Under these circumstances Spanish and Italian bonds appear fairly valued. Their outperformance may continue since much of the demand has emanated from their own domestic banks. However, with impending BIS regulations on bank capital being watered down, these domestic institutions may begin to lend to borrowers other than their own governments. Signs of stronger economic recovery in Spain and Italy will be the catalyst for a sharp reversal in this particular version of the carry trade. Portugal and Greece still offer value but if the reversal begins in Spain and Italy I would expect these markets to suffer from contagion. Carry trades represent “easy money” they become crowded and inevitably unwind with a vengeance.


How much will the Fed taper and what will they do to offset the effect?

400dpiLogo

Macro Letter – No 9 – 11-04–2014

How much will the Fed taper and what will they do to offset the effect?

  • The Fed is tapering despite below target inflation – will they continue?
  • What policies will offset this de facto tightening?
  • How will bonds and stocks react longer-term?

The Federal Reserve began tapering in January and at their most recent meeting signalled that they will only purchasing $55bln of eligible securities per month. These securities consist of $30bln of US Treasuries and $25bln of RMBS. They have justified this reduction in purchases on the grounds that the US economy is steadily recovering, unemployment declining and inflationary pressure is not evident – the PCE Index is at 1.25% vs a target of 2%. The minutes of the most recent FOMC meeting revealed that the unemployment target of 6.5% is no longer to be regarded as a catalyst for potential rate increases. Here are a couple of extracts from the March 2014 minutes: –

With respect to forward guidance about the federal funds rate, all members judged that, as the unemployment rate was likely to fall below 6.5% before long, it was appropriate to replace the existing quantitative thresholds at this meeting,..

…Almost all members judged that the new language should be qualitative in nature and should indicate that, in determining how long to maintain the current 0 to 0.25% target range for the federal funds rate, the Committee would assess progress, both realized and expected, toward its objectives of maximum employment and 2% inflation.

Will the tapering continue?

I believe the Fed has no option except to taper. Their balance sheet has expanded dramatically over the last few years due to quantitative easing policy, however as the chart below from Greg Weldon at Weldon Online shows, there is an uncanny correlation between QE and stock prices: –

US Household net worth - S&P 500 - Fed Balance Sheet - source Weldononline

Source: Weldononline.com

The flow into stocks is partly justified by the improved earnings of corporations, however, this is the result of low capital expenditure due to uncertainty about economic prospects since the 2008 crisis. Low or negative real interest rates act as a deterrent to investment; encouraging dividend payments and share buy-backs.

The chart below shows Capital expenditure and Capacity Utilisation in the US. A disproportionate percentage of the Capex since 2009 has been in the energy sector but as Capacity Utilisation increases the need for Capex will grow.

US Capex and Capu

Source: Haver Analytics and Gluskin Sheff

The effect of low interest rates and QE has been felt beyond the US. The World Bank – Global Economic Prospects – January 2014 estimated that US interest rates, QE and other external factors accounted for 60% of the increase in capital flows to emerging countries between 2009 and 2013.

Concerns about Fed tapering began before the December 2013 announcement, leading to a rise in Treasury Bond yields and a decline in several emerging market currencies. The US stock market has since made new highs, bond yields have stabilised and RMBS spreads continue to narrow. The decline in mortgage related issuance has been a significant factor over the past year, as this chart from Soberlook.com points out, more than off-setting the Fed tapering from $40bln to $25bln per month: –

MBS New issuance - source - sober look

Source: soberlook.com

The Fed will continue tapering. It has a window of opportunity to reduce its purchases of T-Bonds and RMBS whilst US stocks are strong and inflation low. International markets, especially emerging markets, remain vulnerable, but the reversal of capital flows (back to the US) will help to offset the effects of tapering in the near-term. The additional influx of private (rather than public) capital might act as a stronger catalyst for firms to increase Capex to avoid capacity constraints. However, it is worth noting that Capex as a proportion of sales is actually at elevated levels already – Capex usually follows sales and profit growth, and these are in decline for many corporations.

What are the “policy offsets” to tapering?

The first policy offset comes from within the Fed. Whilst they have been tapering their purchases of T-Bonds they have been extending the duration of their portfolio. This has the effect of supporting the longer end of the yield-curve. It also insures that the 30 year mortgage market is supported. Here is a chart of the maturity distribution of the Fed bond portfolio, you will note that 1 to 5 year maturities have seen the sharpest increase whilst 5 to 10 year maturities remain stable, but the portfolio of 10 year plus maturities continues to grow: –

Maturity Distribution of US Treasuries on Fed Balance Sheet

Source: St Louis Federal Reserve

Another policy change comes in the form of the Johnson-Crapo Housing Finance Reform Bill, due to be heard on 29th April. This will seek to wind down Fannie Mae and Freddie Mac, creating a new agency, The Federal Mortgage Investment Corp, with similar guarantees to Ginnie Mae. The Heritage Foundation clearly has misgivings, as this article suggests: –

Johnson–Crapo creates a new government entity with an ill-defined affordable housing mandate and the explicit authority to protect MBS investors in the event of a financial crisis. If the Senate’s approach is adopted, banks will be the only segment of the market left without an explicit guarantee against mortgage losses.

The Senate bills would not help people buy homes; they would only protect investors and special interests at taxpayers’ expense.

What is clear from this proposal, and other many aspects of regulation since 2008, is that public debt is being made increasingly more attractive to investors at the expense of the private sector.

Longer term impact on bonds and stocks

Looking ahead beyond 2014 I can see clouds on the horizon – these may arrive in 2015 or 2016.

US equity markets have performed exceptionally since March 2009, however, it is worth noting that the average stock market bull cycle since 1932 lasted 61 month. After longer deeper recessions the recovery phase can be extended as in 1987 – 2000, 1929 – 1939 and 1949 – 1956. Nonetheless, given the strong correlation between QE and the performance of the S&P500, it is not unreasonable to suggest that most of the positive news about stocks is already reflected in the price. Increased Capex, if it materialises, may lead to higher PEs but not necessarily higher stock prices, and it may even herald a decline.

The benign disinflationary effects of emerging market currency devaluations will run their course. Barring a renewed collapse in global demand, commodity prices will stabilise. Inflationary forces will return and the Fed will finally begin to normalise interest rates.

The new cost-push inflationary environment will be exacerbated by the reduced level of Capex over the past half decade: meanwhile Capacity Utilisation rates may quite possibly rise in this scenario. The US energy sector should escape much of this difficulty as will those industries which are benefitting from the US energy renaissance. The Economist describes the potential, both near and longer term, in this article from November 2013: –

As for the effects of fracking on the broader American economy, most of the forecasts that are bullish on this question assume that gas prices will remain at historic lows. “I can’t see any scenario, other than a widespread ban on drilling, that would push prices higher than $6,” says Scott Nyquist, one of the authors of a report by the McKinsey Global Institute which argues that unconventional oil and gas are set to provide a strong lift to American business.

The report reckons that between now and 2020, shale gas and oil will add $380 billion-690 billion, or two to four percentage points, to America’s annual GDP, creating 1.7m permanent jobs in the process. “America’s New Energy Future”, a recent report by IHS, another research outfit, talks of a manufacturing Renaissance and predicts a $533 billion boost to GDP by 2025, creating around 3.9m jobs.

At first, say both McKinsey and IHS, a lot of the action will be in the energy business itself: not just in drilling and pipelines but in roads and ports, and all the other activities needed to produce and distribute the fuels. Electricity production is being transformed too, with gas-fired power stations being built to replace dirtier coal-fired ones. This has contributed to a 10% fall in the greenhouse-gas emissions from American power generation between 2010 and 2012. IHS reckons gas-fired stations will be providing 33% of America’s electricity in 2020, compared with just 21% in 2008.

In the next few years the benefits of fracking will become more visible in other industries, especially those, such as chemicals firms, that consume a lot of energy or use raw materials derived from hydrocarbons. European industry pays around three times as much for its gas as its American counterpart, and Japanese firms pay more than four times as much. A report this week by the International Energy Agency, a think-tank backed by energy-consuming rich countries, predicts that by 2015 America’s energy-intensive firms will have a cost advantage of 5-25% over rivals in other developed countries.

The benefits of cheap and reliable energy for the US economy will really become evident during the second half of this decade and beyond, however, I do not believe they will be sufficient, in themselves, to alleviate the headwinds of interest rate normalisation and temporary stagflation in the interim.

As stock prices begin to come under pressure the level of corporate debt, so easily serviced when Fed Funds were at the zero-bound, will become uncomfortably evident. Credit spreads will widen just as the economy slows. Government bonds will break lower increasing the damage to the corporate and, finally, household sector.

But here’s the rub! As the US stock and bond markets head into their next crisis, we will witness the appearance of the “Yellen Put”. The faster they taper now the sooner they can return to rescue the markets from the next crisis.


China – rebalancing and the risks to world growth

400dpiLogo

Macro Letter – No 8 – 28-03-2014

China – rebalancing and the risks to world growth

  • China’s exports collapsed last month – is this a trend or will the rebalancing be less painful?
  • Will a slowdown in Chinese growth tip its major trading partners into recession?
  • What would 4% Chinese GDP growth mean for developed markets?

After a period of double digit GDP growth during the last decade, China has slowed to a still respectable 7 to 8% range. Behind the scenes, however, the new administration is attempting to steer the world’s second largest economy away from export led expansion towards a more balanced mix of production and consumption. China embarked on economic reform in 1978. After several decades of mercantilist policies the adjustment process will inevitably be beset by squalls and stormy weather.

Overinvestment

Back in 1992 Hyman Minsky published a paper entitled The Financial Instability Hypothesisit discusses the three stages of credit expansion during an economic cycle: –

Hedge Finance – where borrowers have sufficient cash-flows to meet repayment obligations

Speculative Finance – where borrowers can repay interest but not principal

Ponzi Finance – where borrowers have insufficient cash-flows to meet interest or principal obligations

By a number of conventional measures China has reached the Ponzi stage. Total debt has increased from $9trln in 2008 to $23trln in 2013 (250% of GDP). Private sector debt has increased from 115% of GDP in 2007 to 193% in 2013. Measures of the multiplier effect of debt to GDP suggest it now takes 4 RMB of debt to create 1 RMB of GDP growth. The Chinese authorities attemptes to slow bank lending have led to a significant expansion of shadow bank credit. Much of this lending is to sub-prime borrowers.

Recent action by the PBOC suggests they are now targeting the illusive shadow banking sector. Last week they drained 50 bln RMB via reverse-repos. Below is a chart of Chinese loans; after strong growth in 2013 the PBOC may be inadvertently engineering a “Minsky Moment” – when asset prices collapse – but the Third Plenum focus on market based reform would suggest this is not the intention: –

Chinese loans

Source: Macrobusiness.com.au

Whilst the shadow bank loans have been reigned in, credit formation is still progressing. This is consistent with target M2 growth of around 13%.

There are signs of official policy beginning to bite. In January a coal mining company (Zhengfu Energy) was saved from defaulting on loans by a government engineered bailout, however, in sea-change, China witnessed its first corporate bond default this month (Shanghai Chaori Solar) and a real estate developer (Zhejiang Xingrun Real Estate Company ) was allowed to default on $567 mln of debt to a consortium of 15 banks.

This week the HSBC PMI index recorded 48.1 the fifth month of decline. Meanwhile domestic consumption is growing but the rate of retail sales growth has been easing: –

China retail sales 2010 - 2014

Source: Tradingeconomics.com

China’s transition towards domestic consumption is still remarkable. It is testament to the ability of the state to direct policy.

Reform Agenda

The new administration under President Xi has a clear agenda as this article from the China – United States Exchange Foundation explains:-

First and foremost, Xi’s economic reform agenda wisely addresses some of the country’s most serious economic problems. The new leadership unambiguously aims to tackle them in a forceful manner. 

Second, Xi not only took control of all the supreme institutions in the party, state, and military during the latest political succession, but he also now chairs the newly established National Security Committee and the Central Leading Group on Comprehensive Deepening of Economic Reform. The lower levels of the Chinese government have also established leading groups on economic reform headed by party secretaries and governors or mayors. All of these provide institutional mechanisms through which Xi and his team can more effectively implement reform policies.  

Third, Xi has been supported not only by experienced economic reformers in the top leadership but also by a group of world-class financial technocrats, including Harvard graduate Liu He and Stanford-trained Fang Xinghai. Recently, Ma Jun, Deuteche Bank’s former chief economist on greater China, was appointed as chief economist of the People’s Bank of China. Huang Yiping, former chief economist of emerging Asia for Barclays, also joined the advisory team to the top leadership.  

Finally, the timetable for the bold reform agenda reflects President Xi’s political calculations to stabilize the Chinese economy before the fall of 2017, when the party leadership will experience another major turnover (because of age limits, 5 out of 7 members of the Politburo Standing Committee will retire that year). Xi needs to consolidate power for his second term by unequivocally succeeding in implementing his economic reform agenda. 

If the aim is to rebalance the Chinese economy by 2017 draconian action is required in the near-term. The US economy is stronger than it has been since the crisis of 2008/2009. The Eurozone whilst vulnerable is in better shape than it was in 2011/2012. From a global perspective the developed economies are better placed to absorb the shock of a China slowdown.

So how will China reform? This short article from AJISS – Analysis of the Third Plenary Session and the Outlook for the Future – suggests a number of areas for focus but highlights the areas where doubts exist about the administrations ability to deliver, they conclude on an optimistic note: –

As noted above, expectations are low that the Xi Jinping administration will undertake radical reforms, but a more careful examination of the Decision reveals a number of praiseworthy policies: private capital will be permitted to participate in state-financed investment projects, the percentage of money paid into the public treasury from state-run company earnings will be boosted in order to step up social security funding, and the system of land ownership will be further reformed to increase individuals’ share of capital gains from land. As long as a growth rate of about 7% can be sustained, the combination of these partial reforms should be reasonably effective in extending the lives of the current political and economic systems. The most likely scenario for the near future is that the Communist government will maintain the present political and economic systems by seeking out compromises with rising economic elites, rooting out corruption and implementing income redistribution policies to partly alleviate popular discontent.

All these reform policies are relatively long-term in nature, but if financial markets begin to meltdown, it should be remembered that China is a command economy and can implement bail-outs more swiftly than in most democracies.

Last month the China-United States Exchange Foundation published the following article – Coming Out of the Shadows: Why China Needs a Lehman Moment – which goes to the heart of the dilemma facing the Xi government:-

If we agree that the Chinese state has the financial means to restructure the shadow banking system (which has assets equivalent to 60 percent of GDP), then the challenge is to design a market-based approach that will liquidate zombie borrowers quickly (Zhengfu Energy is a classical zombie borrower).  Investors (mostly wealthy private individuals in the case of shadow banking) must pay a steep price for their failure to perform due diligence (so far, no private individual has lost money investing in products channeled through the shadow banking system).   Granted, the widespread practice of cross-collateralization (borrowers guaranteeing each other’s debt) is likely to trigger chain defaults if one zombie borrower goes under.  But this is an unavoidable price to pay.  Beijing would be far better off in the long run if it opts for intense short-term pain. 

This week, in response to the recent publication of the Work Report, the China- United States Exchange Foundation – The Second Arrow of Likonomicsdescribed the process of Likonomics:-

1. A cautious manner to economic stimulus measures.

2. The deleveraging of financial sectors.

3. Structural reforms of the Chinese economy.

Essentially this process begins by allowing the market to gain prominence but this is only the first arrow: –

Likonomics is different from laissez-faire economics, and it is not a stress test for the Chinese economy. The Chinese government does not alternatively choose between small and big government ideas, but leaves market issues to the market, and government responsibilities to the government. It re-clarifies the role of the market and the role of government in economic and social development. 

If increasing the role of the market and reducing administrative interventions is the first arrow of Likonomics, then the second arrow is clearing lines of responsibility and the role of government in reform, as explained in the new government work report. 

First of all, the Chinese government will become the active regulator of reform, to ensure that the Chinese economy avoids upheavals. The report clearly states that the reasonable range for the Chinese economy in the future will be a GDP annual growth rate of around 7.5%, M2 growth of 13%, and CPI at 3.5%. These indicators are consistent with those of 2013, but the expectations of growth and inflation were lower than 2011. It means the Chinese government has abandoned hard targets on economic growth and inflation, allowed some of the indicators to cross the line, and accepted the fact that China’s economic growth started to slow down. However, the emphasis of the reasonable range means that the Chinese government will carefully assess the situation of the economy and provide crisis intervention if necessary. The clarity of the reasonable range will help stabilize the outlook and enhance market confidence in the Chinese economy. 

Most market commentators are beginning to predict slower growth for China in 2014 and beyond. I think this expectation is mainly based on past experience of Chinese stimulus. The new administration is adopting a different approach. Whilst the economy may stall in the near-term I believe the government can and will intervene aggressively to avoid a widespread crisis.

For a wonderfully argued contrary view Micheal Pettis – The impact of reform on growthsums up what should happen in a genuine reform process.

I believe that a large part of the objective of this economic reform is political in nature. President Xi has already shown himself to be a more centralist leader than China has witnessed in many years. The imbalance of the Chinese economy presents an opportunity to return power to the center. This article from Jamestown Foundation – Xi invokes Mao’s image to Boost his own Authority helps to put the Third Plenum economic policies in a wider context:-

Xi’s carefully calibrated rhetoric is thus geared toward appeasing Chinese who want a continuation of economic reforms as well as conservative elements within the Party who agree with Deng’s judgment that “if we abandon the standard of Mao Thought, we are in fact negating the party’s illustrious history” (People’s Daily, March 24, 2010).  Indeed, in his now-famous internal talk last December on drawing the right lessons from the collapse of the Communist Party of the Soviet Union (CPSU), Xi noted that the CPSU made a fatal error in denigrating Lenin and Stalin. As a result of forsaking their founding fathers, Xi pointed out, “[latter-day Soviet party members] were wallowing in historical nihilism.” “Their thoughts became confused, and different levels of party organizations became useless,” he said. (Radio Free Asia, May 24; Deutche Welle Chinese Service, January 25, 2013).

For a different, but complimentary, view of the current political shift within China, this article from The Diplomat – Why Chinese Study the Warring States Period – provides a fascinating perspective: –

The Chinese leadership is working toward achieving three main goals:  The leadership wants to prevent the emergence and mitigate the existence of the conditions that plagued the political arena of the Warring States era. Specifically it wants to maintain stability, foster unity and reduce the risk of division, as well as mitigate competition. The leadership also wants to continue developing a more prosperous economy and a strong military. And the military must remain committed to supporting the leadership’s agenda, namely bolstering the ruling regime’s legitimacy, protecting sovereignty, defending territorial integrity, and ensuring the state’s overall survival. Finally, unlike the Qin leaders who emphasized the rule of law, the current leadership most likely will continue promoting a code of behavior to cultivate obedience and order. If these trends continue along the current trajectory – in other words, there are no internal and/or external disruptions to the existing trajectory – the Chinese leadership should be able to create a relatively stable and more prosperous and unified state system supported by a strong military capable of ensuring the survival of the current Chinese state system.

The Warring States Era took place between 475 and 221 BC. It was a period regional power struggles which ended with unification under the Qin dynasty. From a military perspective China has already become the regional hegemon in Asia-Pacific. A united country is essential if it is to build on this position.

Chinese Imports

But what about the near-term impact of a China slowdown on financial markets? For the remainder of 2014 and probably the first half of next year China’s economic activity will be difficult to forecast, but it is reasonable to anticipate further signs of weakness. This will impact its major trading partners. Countries which rely on Chinese imports may begin to experience shortages or higher prices – although these may be offset by a weakening in the RMB. The chart below illustrates this, however, it is a new trend and the first sign of RMB weakness for many years.

USD-CNY 2009-2014

Source: Yahoo Finance

Countries which export to China are likely to find the environment more challenging, especially those which supply commodities and basic materials.

Here is a table of China’s principal trading partners from 2011.

Region            Exports         Imports                Trade balance

EU                          356.0              211.2                     +144.8

USA                       324.5               122.2                    +202.3

ASEAN                  170.1               192.8                    -22.7

Japan                    148.3               194.6                    -46.3

S.Korea                 82.9                 162.7                    -79.8

Brazil                    31.8                  52.4                      -20.6

India                      50.5                 23.4                     +27.1

Russia                   38.9                 40.3                     -1.4

Taiwan                  35.1                  124.9                   -89.8

Source: National Bureau of Statistics of China

Exporters in Taiwan, South Korea and Japan are clearly vulnerable to a Chinese slowdown but there are other export countries which have significant exposure.

Here is a selection of countries for whom China is a substantial export market:-

Region                              Percentage

Vietnam                                25.8%

Japan                                    21.3%

United States                       19.0%

Australia                               18.4%

New Zealand                        16.4%

South Korea                         15.6% (2012 est.)

Russia                                    15.5%

Brazil                                     15.3%

Indonesia                              15.3%

Malaysia                               15.1%

South Africa                         14.4%

Saudi Arabia                        13.5%

India                                      10.7%

Source: CIA Factbook

The fall-out from a China slowdown is likely to be broad-based. For these countries it will temper inflationary forces and support lower interest rates. Whilst the initial impact on stocks may be negative, the expectation of lower domestic interest rates will be positive. Slower growth in China will reduce growth globally, prompting developed nation central banks to adopt stimulative monetary policies in order to avoid recession. This in turn will support equity markets both in developed countries and, through international investment flows, emerging markets.

Conclusion

Chinese growth may slow further in 2014/2015 from current levels of 7.5% towards 4% but I believe the government will then intervene aggressively to reverse the decline once it has achieved its political agenda. China’s main trading partners will not escape the impact of this slowdown unscathed, although it will affect countries which export to China more directly.

Within China sectors such as health care, retail and IT will benefit from the great rebalancing. Commodity export countries such as Australia will continue to find the environment challenging. The Chinese administration will use the slowdown to assert its authority in regional disputes around the South and East China Sea. In the process it will once again test the resolve of any US military response.

For developed markets slower Chinese growth will temper inflationary concerns. Once this spills over into slower developed country growth I expect further quantitative easing – this will support asset prices for stocks, bonds and real estate both domestically and internationally.

El Nino – Commodities and the export of Emerging Market inflation

400dpiLogo                     

Macro Letter – No 7 – 14-03-2014

El Nino – Commodities and the export of Emerging Market inflation

Emerging markets currencies have been under pressure since the middle of 2013. Many of these markets have above target inflation but have been helped during the past three years by falling commodity prices. Whilst industrial metals continue to decline and energy products mark time, some key perishable commodities have seen sharp price increases since the beginning of 2014. In part this is due to increased expectation of an El Nino weather pattern developing in the second half of 2014.

For emerging economies food prices are a more significant proportion of consumer prices than for developed economies; as food prices rise, wages will need to follow. The one-off impact of currency weakness will help EM exporters in the near-term, but, once this process has run its course, emerging markets will attempt to export their higher inflation.

Commodity indices

Since the spring of 2011 commodity prices have fallen significantly as the CRB Index chart below shows.

CRB Index - monthly 2006 - 2014

Source: Barchart.com

With the start of 2014 resurgence has begun. It is still nascent, but this may mark the beginning of a new trend. What is driving this process, which commodities are leading, which are lagging and where will the inflationary impact of higher prices show up first?

The CRB Index is one of many commodity indices but it is reasonably diversified and has a heavier weighting to perishable commodities than some other indices. Here is the current list of constituents: –

Raw Industrials: Hides, tallow, copper scrap, lead scrap, steel scrap, zinc, tin, burlap, cotton, print cloth, wool tops, rosin, and rubber (59.1%).

CRB BLS Foodstuffs: Hogs, steers, lard, butter, soybean oil, cocoa, corn, Kansas City wheat, Minneapolis wheat, and sugar (40.9%).

For comparison here is the GSCI, a trade-weighted index of commodities by value. This index is energy heavy (70%) with Crude representing nearly 50% of the index. The weighting for industrial metals is just over 6% and grains around 12%:-

GSCI Index - monthly 2004 - 2014

Source: Barchart.com

The table below gives a brief snapshot of a narrower range of commodity futures over the past year, these prices were taken this morning (14th March) UK time:-

Commodity

Daily

1 Week

1 Month

YTD

Copper

0.09%

-5.12%

-10.33%

-16.82%

Brent   Crude

0.07%

-1.67%

-1.84%

-2.60%

WTI

-0.04%

-4.36%

-2.19%

5.05%

Nat   Gas

-0.66%

-5.71%

-16.15%

12.50%

US   Corn

-0.41%

-0.92%

8.30%

-32.77%

US   Wheat

0.06%

2.91%

12.55%

-7.00%

 Source: Investing.com

I will review these key markets, adding some commentary on Iron Ore, Coal, Soybeans and Rice since these are critical constituents of industrial metals, energy and agriculture globally.

Copper and Iron Ore

Copper prices remain depressed due to a lack of industrial demand, especially from China. Shanghai Copper dropped to a four year low last week after the publication of weak trade data (-18% vs a  forecast of +5%).

This chart shows US High Grade Copper. Further weakness may cause a rout: –

US Copper - monthly - 2004 - 2014

Source: Barchart.com

The lack of Chinese industrial demand is also seen in this chart of Dalian Iron Ore Futures: –

Dalian Iron Ore Futures - Oct 2013 - March 2014

Source: Macrobusiness.com.au

Crude Oil

The disparity between the performance of Brent Crude and WTI is not a topic I want to discuss on this occasion; however, using WTI as a proxy, the chart below indicates that prices have remained stable with a small upward bias over the last couple of years. During this same period the US economy has slowly begun to recover:-

WTI Monthly - 2004 - 2014

Source: Barchart.com

Part of the subdued nature of the price action is due to increases in US domestic production. The US has been fortunate in its ability to harness new technology to increase energy productivity but, as this article from the Manhattan Institute – New Technology for Old Fuel – points out, this is a process which has evolved over many decades; here’s an extract from the executive summary:-

…The key findings of this paper include:

• Between 1949 and 2010, thanks to improved technology, oil and gas drillers reduced the number of dry holes drilled from 34 percent to 11 percent.

• Global spending on oil and gas exploration dwarfs what is spent on “clean” energy. In 2012 alone, drilling expenditures were about $1.2 trillion, nearly 4.5 times the amount spent on alternative energy projects.

• Despite more than a century of claims that the world is running out of oil and gas, estimates of available resources continue rising because of innovation. In 2009, the International Energy Agency more than doubled its prior-year estimate of global gas resources, to some 30,000 trillion cubic feet—enough gas to last for nearly three centuries at current rates of consumption.

• In 1980, the world had about 683 billion barrels of proved reserves. Between 1980 and 2011, residents of the planet consumed about 800 billion barrels of oil. Yet in 2011, global proved oil reserves stood at 1.6 trillion barrels, an increase of 130 percent over the level recorded in 1980.

• The dramatic increase in oil and gas resources is the result of a century of improvements to older technologies such as drill rigs and drill bits, along with better seismic tools, advances in materials science, better robots, more capable submarines, and, of course, cheaper computing power.

In a number of less developed countries the geopolitics of oil are more relevant. On the United States doorstep is Venezuela – ranked 9th by Crude production (3mln bpd). The political and economic situation within the country is getting worse in the post-Chavez environment. This short article from The Peterson Institute – Can Venezuela Learn from Ukraine? Sums up the current situation: –

 For Venezuela’s sake, President Maduro should be watching events unfold in Ukraine and act to avoid the sort of bloodshed that finally led to the ouster of Yanukovych. If he does, he may buy himself some more time to devise a strategy to unwind some of the most egregious economic distortions.

Last April, at the Peterson Institute’s spring Global Economic Prospects meeting, we predicted [pdf] that Venezuelan President Maduro would be unable to continue Hugo Chavez’s legacy of 21st century socialism because of serious economic and political pressures. Those pressures have only increased. With his own party far from united, question marks regarding the role of the military, and a strengthening protest movement, it is only a matter of time before Venezuela also reaches a breaking point. Perhaps helped by a coordinated effort by the Mercosur countries and the United States, Venezuela should step up to the challenge.

Another political hot-spot is Russia. Producing 10.9 mln bpd, Russia is the largest Oil producer globally. She is unlikely to reduce production but may divert supply away from Europe should the Ukrainian impasse deteriorate further. On balance this may not be catastrophic for the global economy since China may be an obvious beneficiary.

Shia, Saudi Arabia (ranked 2nd – producing 9.9 mln bpd) has a veneer of stability, but the increasing dialogue between the developed nations and Sunni, Iran (ranked 4th – producing 4.2 mln bpd) concerning their nuclear development programme, is inherently destabilising.

Barring a collapse in world economic growth, I believe Crude Oil prices will be robustly supported. Excepting the benign influence of US domestic productivity gains, the risks are skewed to the up-side.

Natural Gas

Unlike Crude Oil, Natural Gas is geographically constrained by distribution bottlenecks. At a global level Natural Gas can be divided into three price groups as the chart below illustrates: –

Nat Gas Price - 2007 - 2014

Source: World Bank and Knoema

Please note: this chart doesn’t incorporate the price increase in Europe since the Ukrainian revolution began. These price differentials are a source of opportunity and will encourage technological development, especially in the area of natural gas liquification.

The steady increase in US Nat Gas since early 2012 is seen more clearly in the next chart: –

US Nat Gas - Monthly - 2004 - 2014

Source: Barchart.com

The latest up-surge has been driven by the extreme cold weather which affected much of the US. This is a reminder of the natural cyclicality of Nat Gas prices in response to extremes of cold or hot. The current price is towards the upper end of its post 2009 range. Improvements in fracking technology make any price increases attractive for producers to increase supply. Production improvements are evident even in areas where conventional extraction techniques are employed. The Potential Gas Committee – April 2013 press release paints a rosy picture for production in general: –

The Potential Gas Committee (PGC) today released the results of its latest biennial assessment of the nation’s natural gas resources, which indicates that the United States possesses a total technically recoverable resource base of 2,384 trillion cubic feet (Tcf) as of year-end 2012. This is the highest resource evaluation in the Committee’s 48-year history, exceeding the previous high assessment (from 2010) by 486 Tcf. Most of the increase arose from new evaluations of shale gas resources in the Atlantic, Rocky Mountain and Gulf Coast areas.

These changes have been assessed in addition to 49 Tcf of domestic marketed-gas production estimated for the two-year period since the Committee’s previous assessment.

“The PGC’s year-end 2012 assessment reaffirms the Committee’s conviction that abundant, recoverable natural gas resources exist within our borders, both onshore and offshore, and in all types of reservoirs—from conventional, ‘tight’ and shales, to coals,” said Dr. John B. Curtis, Professor of Geology and Geological Engineering at the Colorado School of Mines and Director of the Potential Gas Agency there, which provides guidance and technical assistance to the Potential Gas Committee.

The inherent volatility of Nat Gas prices makes prediction about longer term trends difficult, but, I believe the main factor which will influence US Nat Gas prices longer term will be the development of LNG capacity: and this must be preceded by the issuance of further Nat Gas export licenses by the US  DOE.

Coal

Coal doesn’t appear in the commodity futures table above, but, like Iron Ore and Natural Gas, it is globally important. This chart from Uppsala University – Coal future of China and the World shows how Coal production is still increasing:-

World Coal Production Forecast - 2100

Source: Uppsala University

According to the World Coal Association, China is currently the world’s largest producer but also the largest importer, 81% of its electricity is generated from Coal. By comparison the second largest producer, USA, is the forth largest exporter and uses Coal for only 43% of its electricity generation. The third largest producer, India, is the third largest importer and uses Coal for 68% of its electricity generation.

The World Bank compiles monthly commodity prices including Coal from three of the top six export countries; this shows a similarly subdued pattern to industrial metals. Prices are not far above their 2008-2009 lows :-

Coal Exporter prices 2007 - 2020

Source: Knoema and World Bank

Of the BRIC economies, China, India and Russia are among the top five Coal producers (whilst Brazil is 12th largest producer of Crude Oil). From an energy-security perspective, Coal is a geopolitical palliative since “known reserves” are globally distributed. Prices are far from over-stretched and predictions for “Peak-Coal” are still some decades away. If Coal prices rebound from their current levels it will most likely be due to demand-pull factors. 

Grains and El Nino

Last year Wheat, Corn and Soybeans all declined substantially, but, when viewed over the past decade prices appear to have consolidated and are now beginning to push higher.

US Wheat - monthly 2004 - 2014

Source: Barchart.com

 US Corn - monthly 2004 - 2014

Source: Barchart.com

US Soybeans - monthly 2004 - 2014

Source: Barchart.com


US Rice, by contrast, remained broadly stable.

US Rough Rice - monthly future - 2004 - 2014

Source: Barchart.com

To understand the impact on emerging market inflation, however, we need to look beyond the US domestic market. The table below shows Wheat and Rice production for 2013 by country.

WHEAT
Rank Country Production   2013 (mln tons)

1

  China

125.6

2

  India

94.9

3

  United States

61.8

4

  France

40.3

5

  Russia

37.7

RICE
Rank Country Production   2013 (mln tons)

1

China

143

2

India

99

3

Indonesia

36.9

4

Bangladesh

33.8

5

Vietnam

27.1

6

Thailand

20.5

7

Philippines

11

8

Myanmar

10.75

9

Brazil

7.82

10

Japan

7.5

The disruption to grain production in the Ukraine provides significant price support for Wheat (and also Corn) but a more global factor may be brewing in the central Pacific: El Nino. Whilst Wheat and Rice are not substitutes El Nino weather patterns may disrupt production of both commodities. Risks are on the upside.

Last week the NOAA – ENSO (National Oceanic and Atmospheric Administration – El Nino Southern Oscillation) report maintained its forecast of a 50% chance of El Nino developing by summer or fall 2014. For the US El Nino has a number of effects on agriculture as this article from The Southeast Climate Consortium illustrates: –

During El Niño Years

Corn yields are usually lower than historic averages.

Harvests of summer crops such as corn, peanuts, and cotton may be delayed because of increased rains in the fall.

Frequent rains may reduce tilling and yield of winter wheat.

Wheat yields in southern AL and GA are generally higher than average during El Niño.

Frequent rains at the end of August and in early September may increase Hessian fly populations on winter wheat.

For a more global view of the El Nino effect the following map simplifies an otherwise complex picture, droughts in Brazil, India, Indonesia and Australia stand out: –

El Nino Map

Source: PhysicalGeography.net

Last month Reuters – El Nino threatens to return described some of the risks, you will notice they predict heavy rain in Brazil – the El nino effect is a distinctly complex: –

A strong El Nino can wither crops in Australia, Southeast Asia, India and Africa when other parts of the globe such as the U.S. Midwest and Brazil are drenched in rains.

While scientists are still debating the intensity of a potential El Nino, Australia’s Bureau of Meteorology and the U.S. Climate Prediction Center have warned of increased chances one will strike this year.

…Last month, the United Nations’ World Meteorological Organization said there was an “enhanced possibility” of a weak El Nino by the middle of 2014.

The specter of El Nino has driven global cocoa prices to 2-1/2 year peaks this month on fears that dry weather in the key growing regions of Africa and Asia would stoke a global deficit. Other agricultural commodities could follow that lead higher if El Nino conditions are confirmed.

In India, the world’s No.2 producer of sugar, rice and wheat, a strong El Nino could reduce the monsoon rains that are key to its agriculture, curbing production.

“If a strong El Nino occurs during the second half of the monsoon season, then it could adversely impact the production size of summer crops,” said Sudhir Panwar, president of farmers’ lobby group Kishan Jagriti Manch.

El Nino in 2009 turned India’s monsoon patchy, leading to the worst drought in nearly four decades and helping push global sugar prices to their highest in nearly 30 years.

Elsewhere in Asia, which grows more than 90 percent of the world’s rice and is its main producer of coffee and corn, a drought-inducing El Nino could hit crops in Thailand, Indonesia, Vietnam, the Philippines and China.

And it could deal another blow to wheat production in Australia, the world’s second-largest exporter of the grain, which has already been grappling with drought in the last few months.

Between 2006 and 2008 average world prices for Rice rose by 217%, Wheat by 136%, Corn by 125% and Soybeans by 107%. This prompted food riots in India and other emerging market countries. Many commentators blamed developed countries whose institutions had been investing in commodities to diversify their portfolios away from traditional asset classes, but El Nino also had a significant hand in this process.

In December 2013 CFTC proposed amended limits on positions size for 28 US commodity futures markets – not solely to aid the emerging world.  This may restrict some investment activity but is unlikely to reduce volatility. Here is the Harvard Law School Forum review of the proposal.

For emerging economies food prices are more important to CPI. This essay from the St Louis Federal Reserve – Food Prices and Inflation in Emerging Markets sheds more light on the topic: –

Rising food prices contribute more to inflation in developing countries because food is a much higher share of the consumption basket in emerging markets than in wealthier countries. For example, food accounts for 15 percent of the U.S. consumer price index (CPI) basket, but 50 percent of the Philippines’ CPI basket. Compounding the differences, research shows that there is a much more significant pass-through from food prices to non-food prices in developing countries compared with advanced countries, where there is almost none.

Emerging Market Currencies and inflation

The weakening of emerging market currencies since mid-2013 has been widely covered in the financial press. The “Fragile Five” – Brazil, India, Indonesia, South Africa and Turkey – have, among other attributes, above target inflation. How much higher will this become in response to their declining currencies and when will this inflation start to be exported? Assuming there is a lag between changes in commodity prices and CPI, last year’s commodity price declines will still be feeding through in 2014. Lower exchange rates allow these economies to become more export competitive in the near-term, but, once this adjustment has run its course, cost push factors will begin to emerge unless world economic growth suddenly stalls.

In Q4 2013 Societe Generale produced the following chart, this is their forecast for EM currencies after the fall: –

Soc Gen EM Currency Forecasts from March 2014 to Dec 2014

Source: Societe Generale

This would be an export led recovery at the expense of developed markets. Adding commodity inflation into the mix together with higher domestic wage costs, in order to meet higher food prices, could begin a global reflation process. Near-term the impact of the EM currency group will, however, be disinflationary for developed economies. This EM Currency ETF chart high-lights the depreciation since Q1 2013: –

PIMCO EM Currency ETF - 2012 - 2014

Source: Yahoo Finance

Conclusion 

Industrial metal prices remain under pressure due to weakness of demand especially from China. Energy prices continue to tread water but are supported by forecasts of better world GDP growth during 2014 and geopolitical concerns. Grains and other perishable commodity prices are vulnerable to upside pressure should a strong El Nino phase develop in H2 2014.

Stronger world growth combined with higher commodity prices will eventually lead to reflation in developed markets as price increases are exported from emerging markets. These effects may be muted by adverse demographics in some countries but those countries with youth on their side will witness an end to the great moderation and the beginning of a new longer-term inflation cycle.

For equity markets inflation is not a universal good as this article from Detlev Schlichter recounts but many emerging markets already have high interest rates. Whilst these rates may go higher still the fear of higher rates is far less severe in these emerging markets than in developed markets where zero-bound asymmetry predominates. I believe emerging market equities – especially agricultural exporters – are well placed to benefit from the next inflation cycle.