Macro Letter – No 30 – 20-02-2015
Australia and Canada – Commodities and Growth
- Industrial commodities continue to weaken
- The BoC and RBA have cut official rates in response to falling inflation and slower growth
- The RBA has more room to manoeuvre in cutting rates, Australian Bonds will outperform
The price of Crude Oil has dominated the headlines for the past few months as Saudi Arabia continued pumping as the price fell in response to increased US supply. However, anaemic growth in Europe and a continued slowdown in China has taken its toll on two of the largest commodity exporting countries. This has prompted both the Bank of Canada (BoC) and the Reserve Bank of Australia (RBA) to cut interest rates by 25 bp each – Canada to 0.75% and Australia to 2.25% – even as CAD and AUD declined against the US$.
In this letter I will look at Iron Ore, Natural Gas and Coal, before going on to examine other factors which may have prompted central bank action. I will go on to assess the prospects for asset markets over the coming year.
Iron Ore
The price of Iron Ore continues to make fresh lows, driven by weakness in demand from China and Japan and the EU.
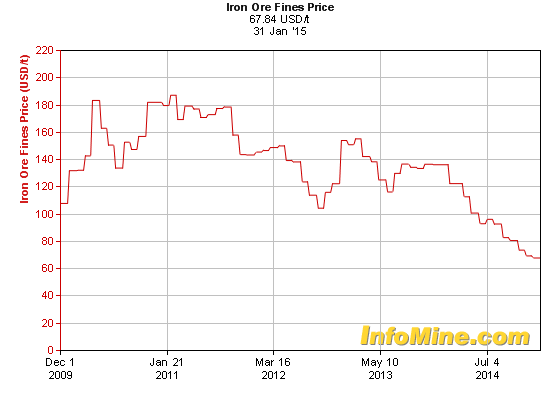
Source: Infomine.com
Iron Ore is Australia’s largest export market, significantly eclipsing Coal, Gold and Natural Gas. It is the second largest producer in the world behind China. 2013 production was estimated at 530 Mt. Canada, with 40 Mt is ranked ninth by production but is the fourth largest exporter. Needless to say, Iron Ore production is of significant importance to both countries, although for Canada Crude Oil comes first followed by vehicle and vehicle parts, then Gold, Gas – including Propane – and Coal. It is also worth noting that the two largest Steel exporters are China and Japan – both major Iron Ore importers. The health of these economies is vital to the fortunes of the Iron Ore industry.
Natural Gas
Natural Gas is a more difficult product to transport and therefore the price differential between different regions is quite pronounced. Japan pays the highest price of all the major economies – exacerbated by its reduction of nuclear generating capacity – closely followed by Singapore, Taiwan and South Korea. The US – Henry Hub – and AECO – Alberta – prices are broadly similar, whilst Europe and Japan pay a significant premium:-
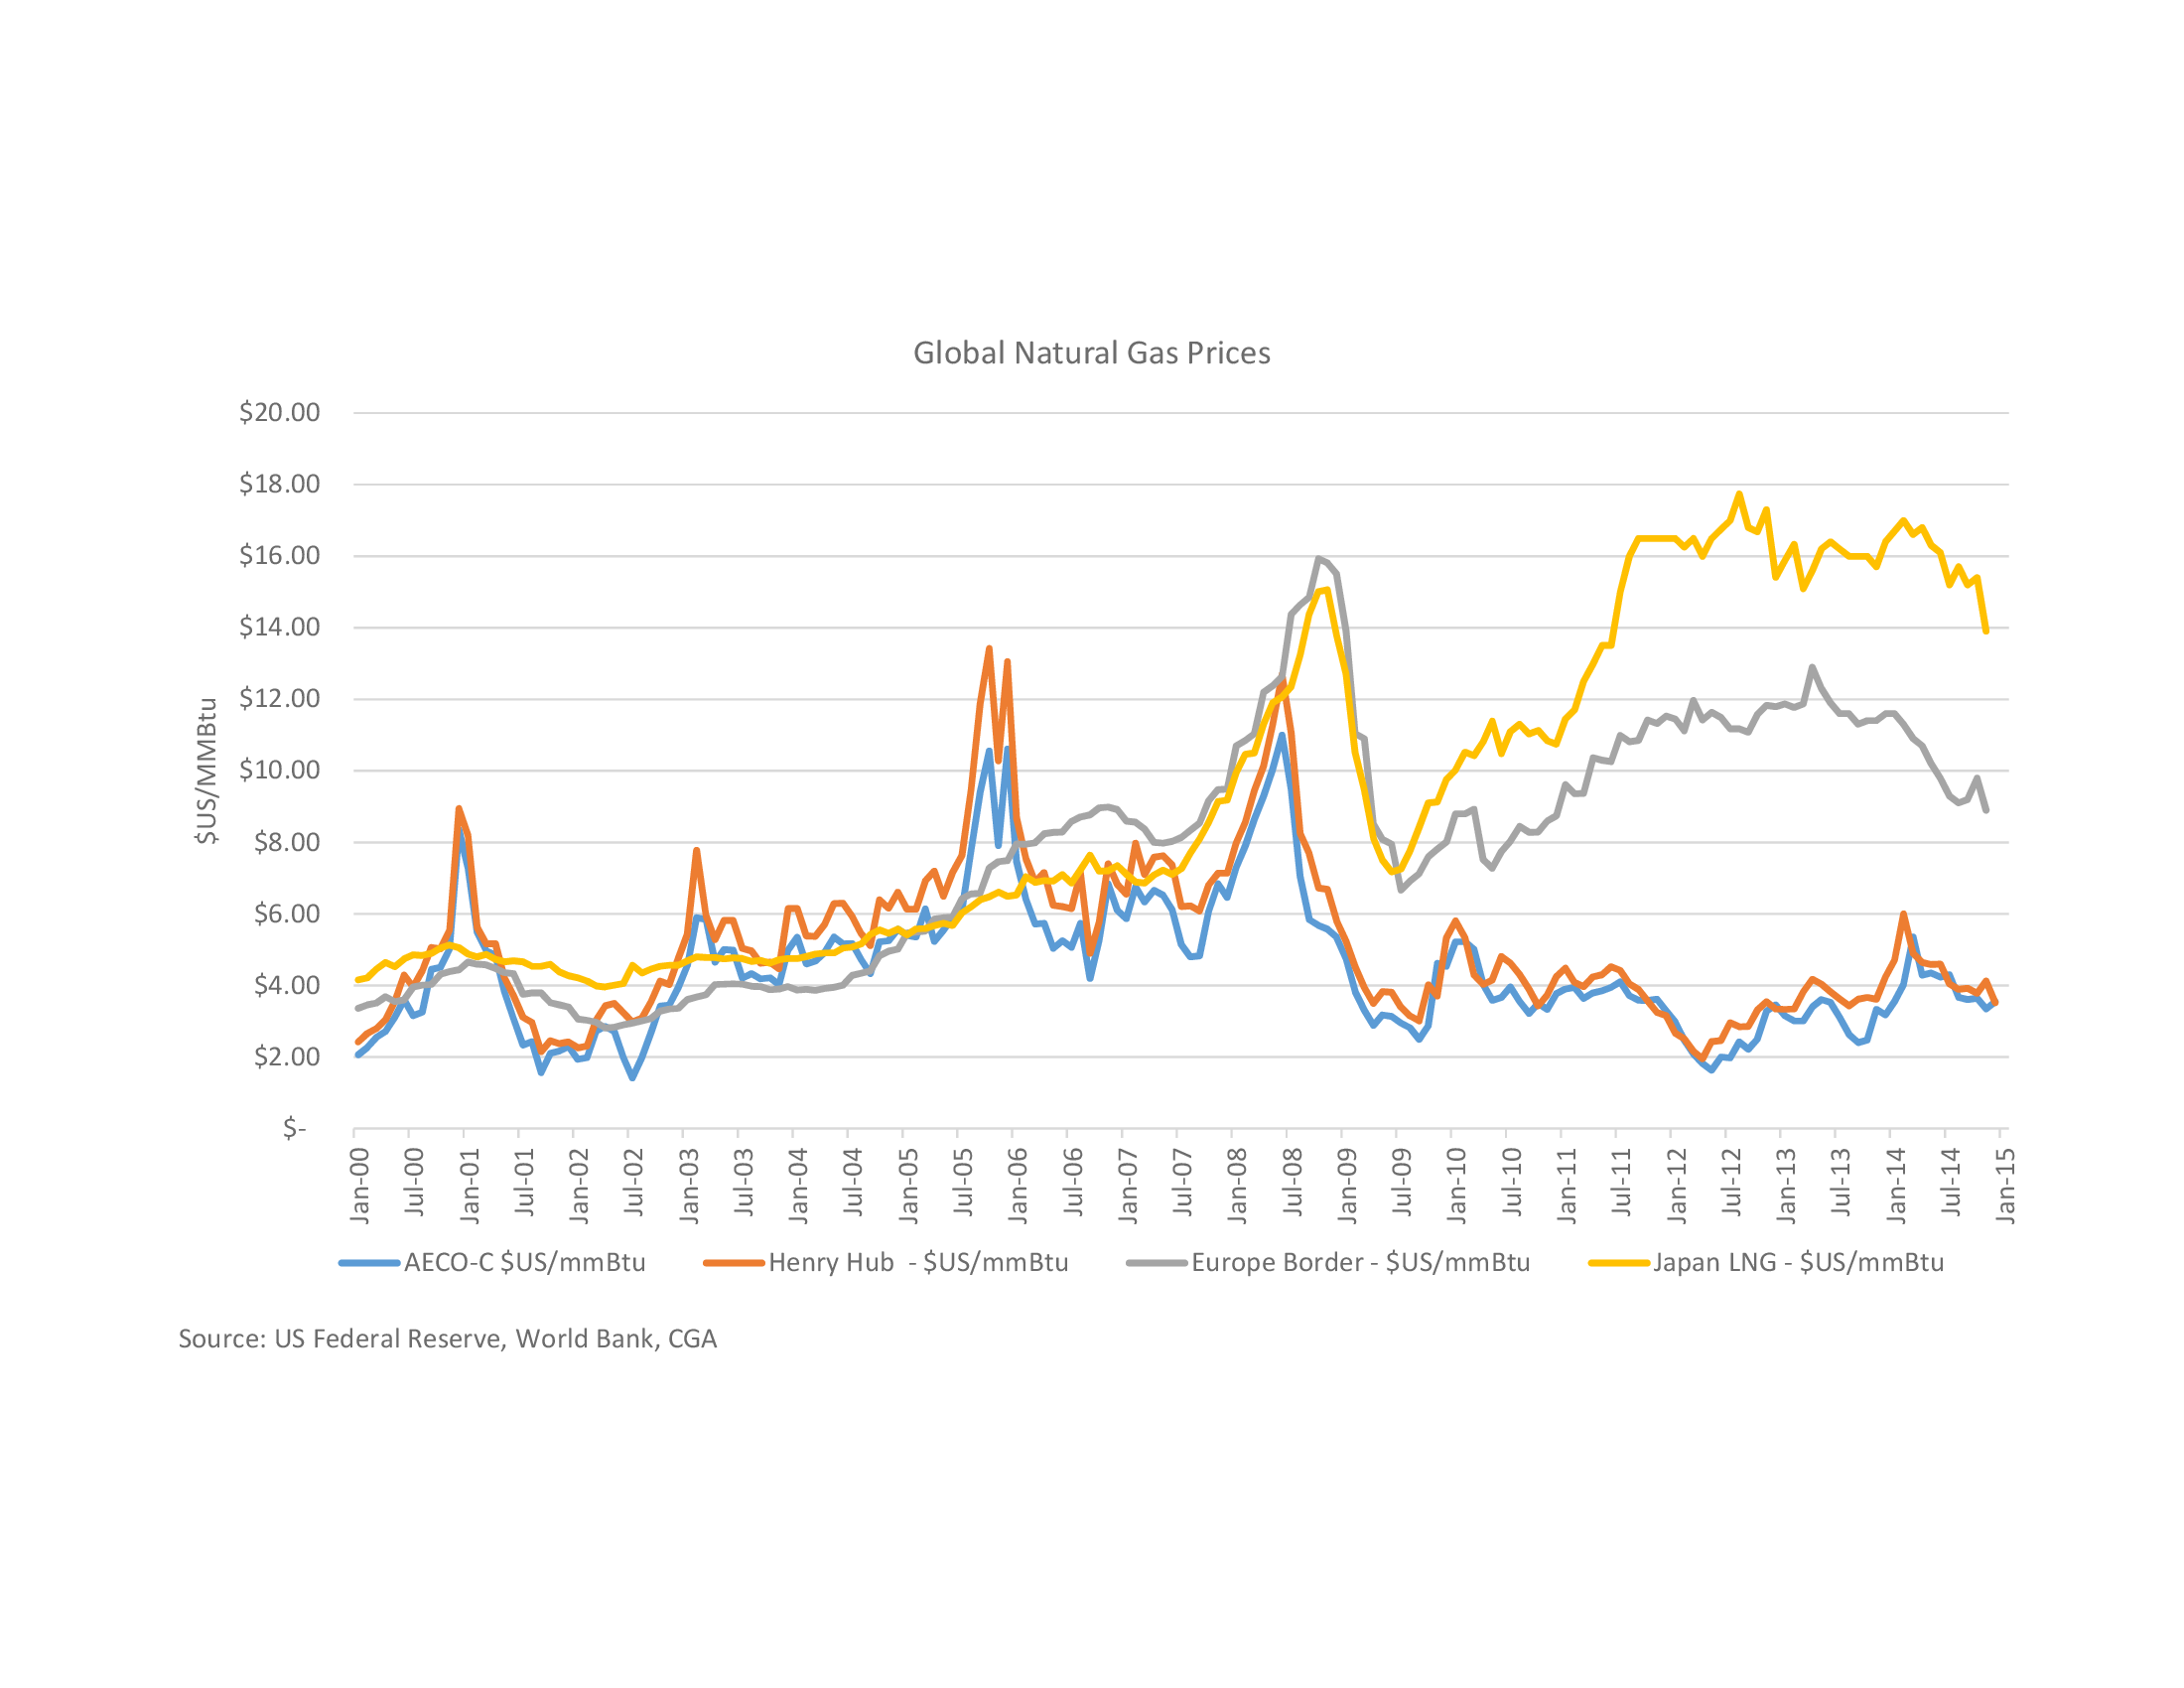
Source: Federal Reserve, World Bank, CGA
Here is an extract from the International Gas Union report – IGU Wholesale Gas Price Survey Report – 2014 Edition:-
Wholesale prices can obviously vary significantly from year to year, but the top two regions are Asia Pacific followed by Europe – both with average prices over $11.00. OPE* remains the primary pricing mechanism in Asia Pacific and still a key mechanism in Europe.
*Oil Price Escalation – in this type of contract, the price is linked, usually through a base price and an escalation clause, to competing fuels, typically crude oil, gas oil and/or fuel oil. In some cases coal prices can be used as can electricity prices.
Canada has significant Gas reserves and is actively developing Liquefied Natural Gas (LNG) capacity. 13 plant proposals are underway but exports are still negligible. It also produces significant quantities of Propane which commands a premium over Natural Gas as this chart shows: –
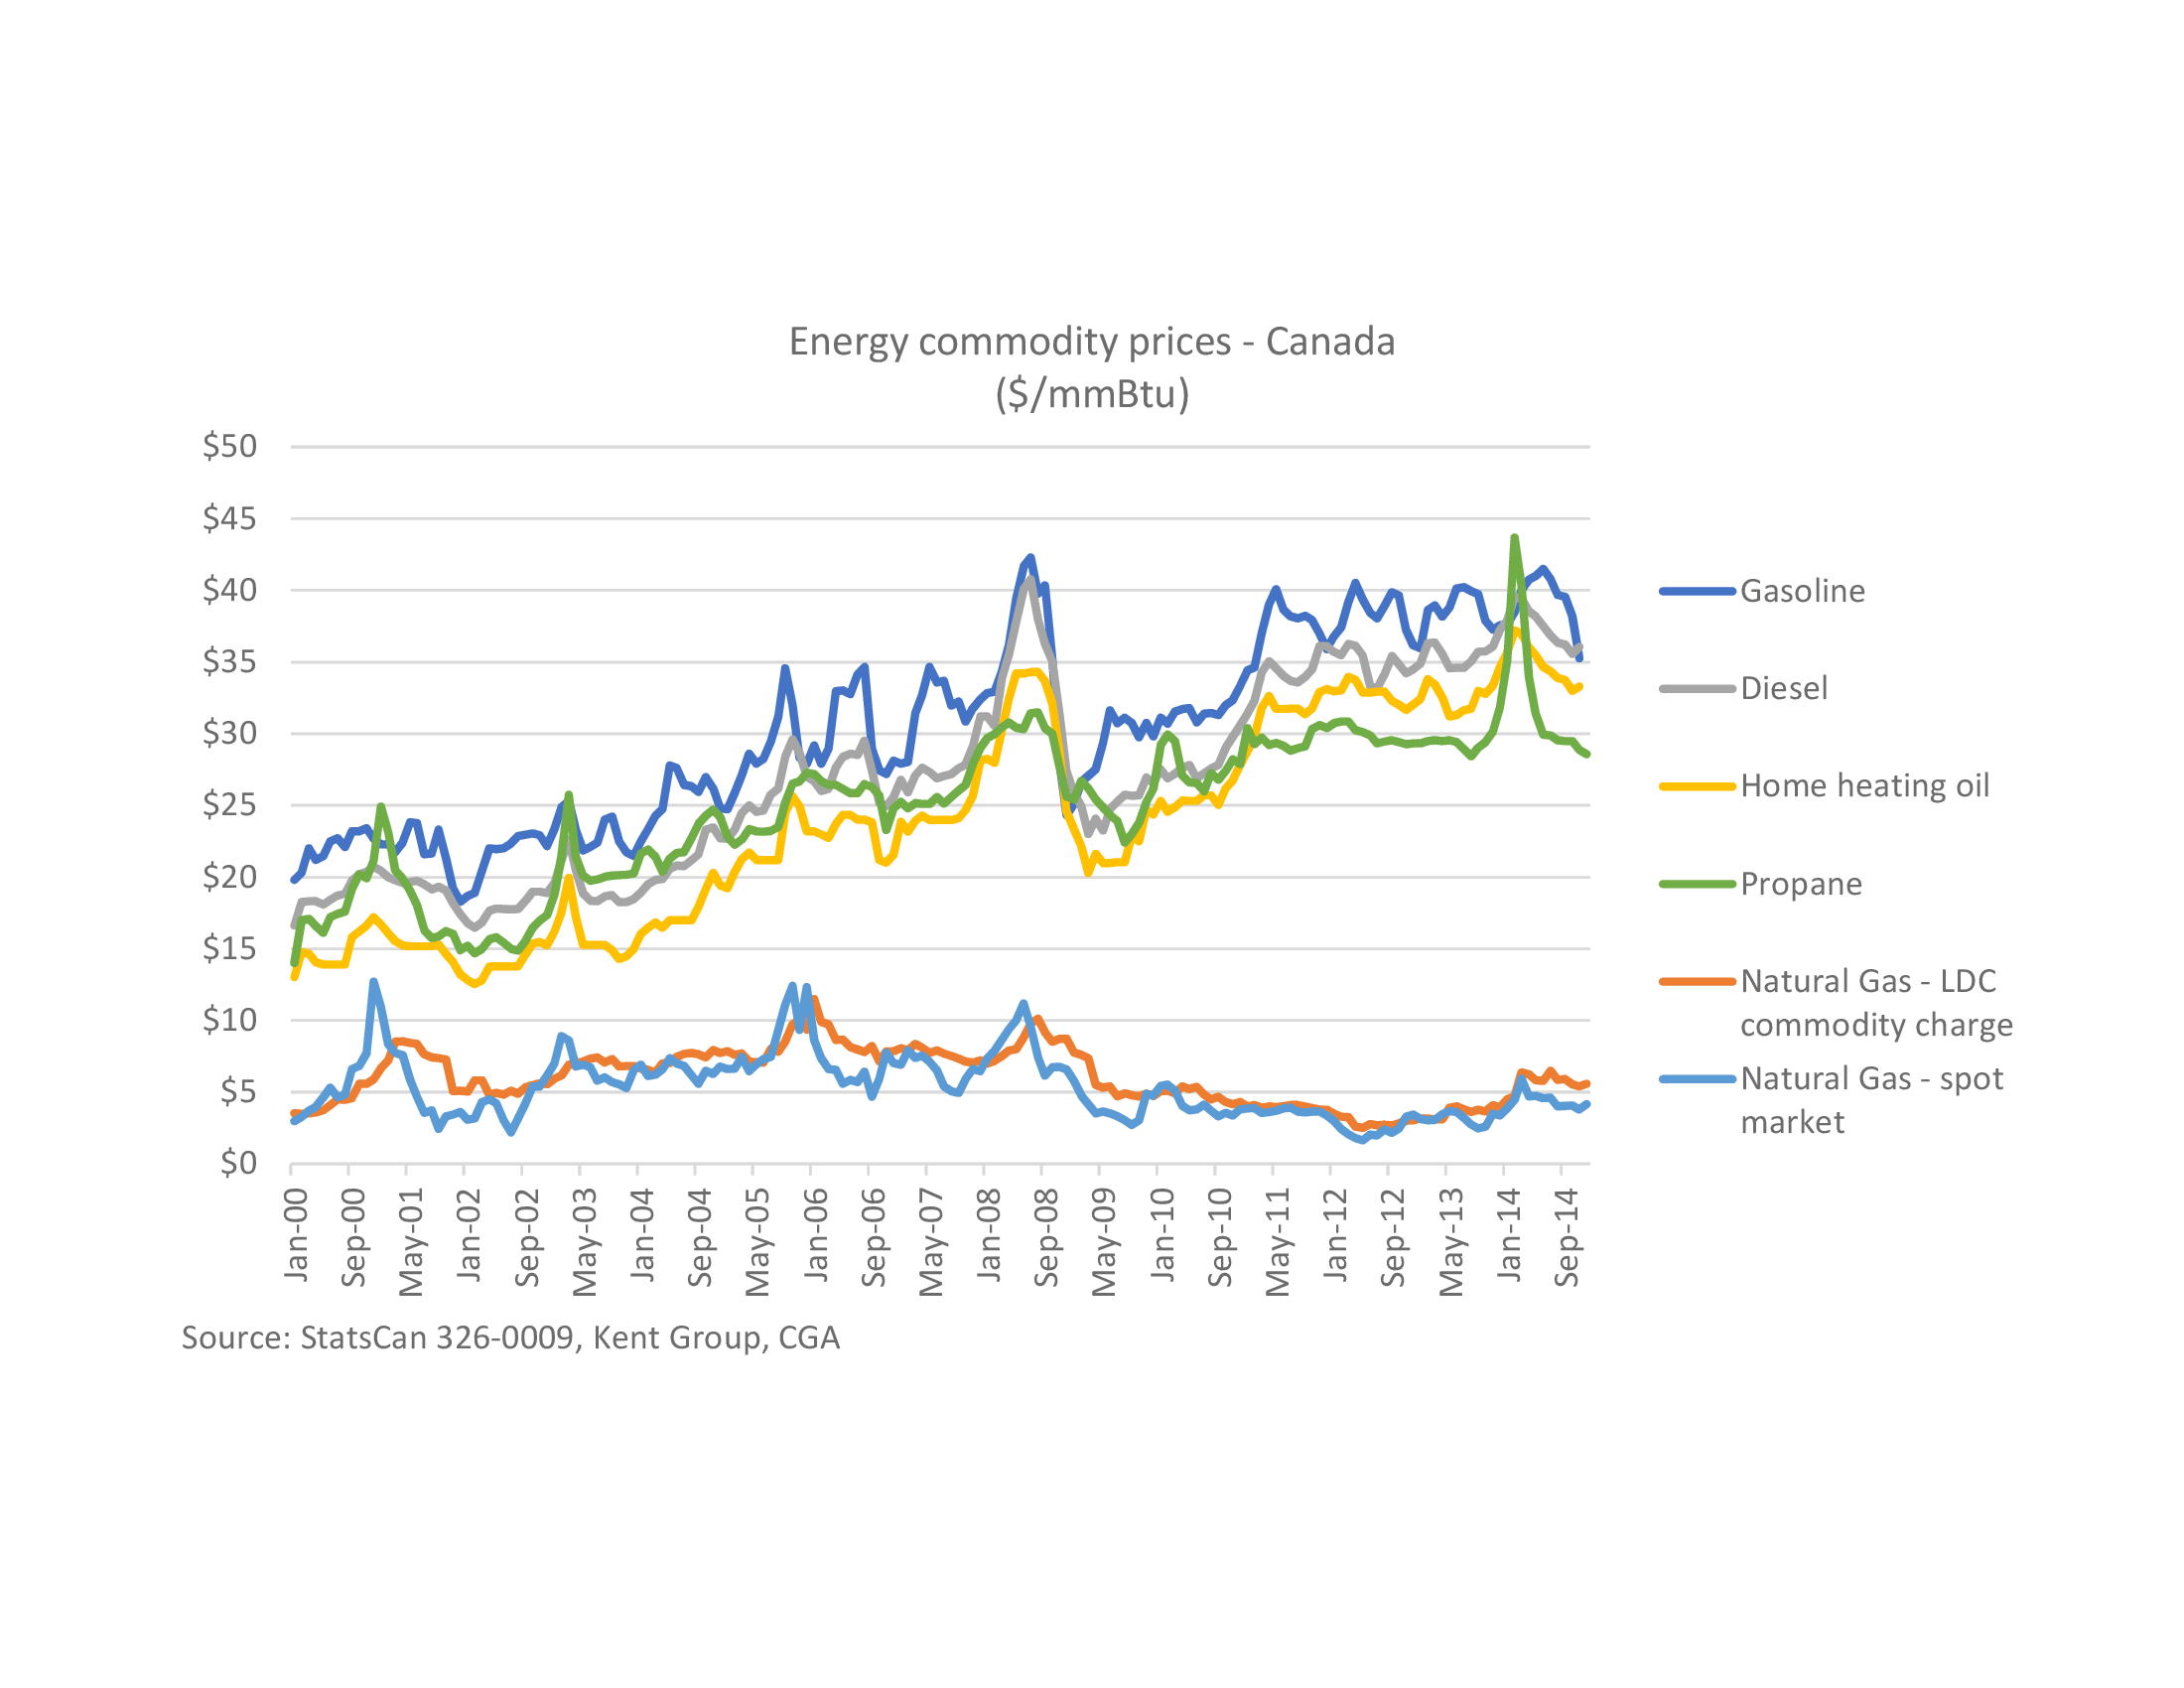
Source: StatsCan, Kent Group, CGA
Australia, by comparison, is already a major source of LNG production. The IGU – World LNG Report – 2014 Edition:-
Though Australia was the third largest LNG capacity holder in 2013, it will be the predominant source of new liquefaction over the next five years, eclipsing Qatari capacity by 2017. With Pluto LNG online in 2012, seven Australian projects are now under construction with a total nameplate capacity of 61.8 MTPA (53% of global under construction capacity).
Coal
Australia is the fourth largest Coal producer globally. According to the World Coal Association, it produced 459 Mt in 2013. Canada did not feature in the top 10. However when measured in terms of Coking Coal – used for steel production – Australia ranked second, behind China, at 158 Mt whilst Canada ranked sixth at 34 Mt.
The price of Australian Coal has been falling since January 2011 and is heading back towards the lows last seen in 2009, driven primarily by the weakness in demand for Coking Coal from China.
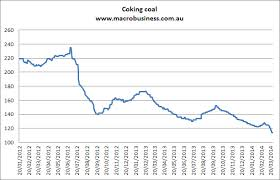
Source: Macro Business
This is how the Minerals Council of Australia describes the Coal export market:-
Coal accounted for almost 13 per cent of Australia’s total goods and services exports in 2012-13 down from 15 per cent in 2011-12. This made coal the nation’s second largest export earner after iron ore. Over the last five years, coal has accounted, on average, for more than 15 per cent of Australia’s total exports – with export earnings either on par or greater than Australia’s total agricultural exports.
Australia’s metallurgical coal export volumes are estimated at 154 million tonnes in 2012-13, up 8.5 per cent from 2011-12. However, owing to lower prices the value of exports decreased by almost 27 per cent to be $22.4 billion in 2012-13.
Whilst the scale of the Coal industry in Canada is not so vast, this is how the Coal Association of Canada describes Canadian Coal production:-
Production
Canada produced 60 million close to 67 million tonnes (Mt) of coal in 2012. 31 million tonnes was metallurgical (steel-making) coal and 36 million tonnes (Mt) was thermal coal. The majority of coal produced in Canada was produced in Alberta and B.C.
Alberta produced 28.3 Mt of coal in 2012
British Columbia produced 28.8 Mt (most was metallurgical coal) – 43% of all production
To meet its rapid infrastructure growth and consumer demand for things such as vehicles and home appliances, Asia has turned to Canada for its high-quality steel-making coal. As Canada’s largest coal trading partner, coal exports to Asia accounted for 73% of total exports in 2010.
Steel-Making Coal
Global steel production is dependent on coal and more and more the world is turning to Canada for its supply of quality steel-making coal.
The production of steel -making coal increased by 5.5% from 29.5 Mt in 2011 to 31.1 Mt in 2012.
Almost all of Canada’s steel-making coal produced was exported.
Thermal Coal
Approximately 36 million tonnes of thermal coal was produced in 2012.
The vast majority of Canadian thermal coal produced is used domestically.
Currency Pressures
Until the autumn of 2014 the CAD was performing strongly despite weakness in several of its main export markets as the chart below of the Canadian Effective Exchange Rate (CERI) shows:-
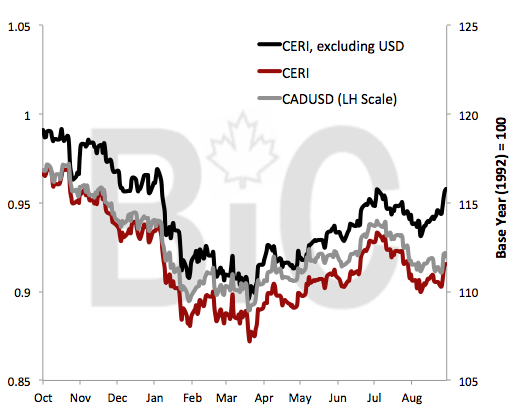
Source: Business in Canada, BoC
Since September the CERI index has declined from around 112 to below 100.
For Australia the weakening of their trade weighted index has been less extreme due to less reliance on the US. There is a sector of the RBA website devoted the management of the exchange rate, this is a chart showing the Trade Weighted Index and the AUDUSD rate superimposed (RHS):-
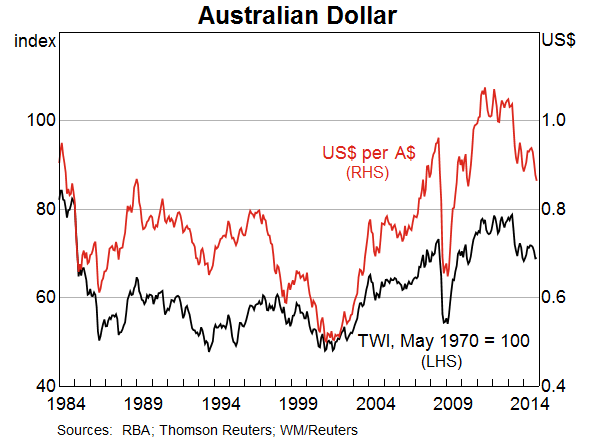
Source: RBA, Reuters
Taking a closer look at the monthly charts for USDCAD:-
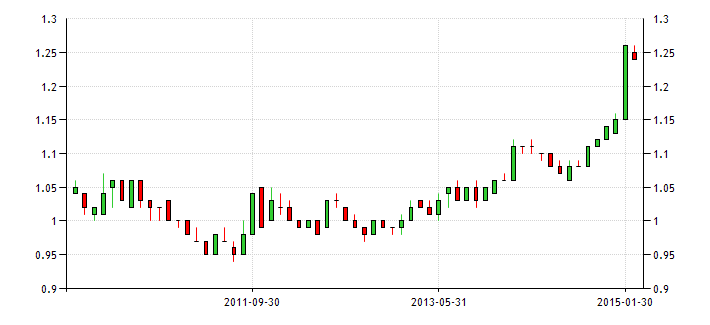
Source: Trading Economics
And AUDUSD:-
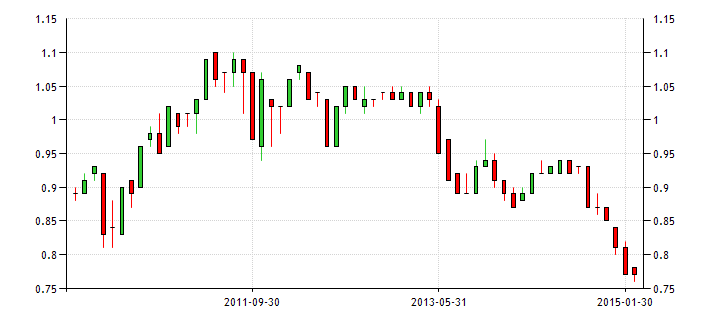
Source: Trading Economics
These charts show the delayed reaction both currencies have had to the decline in the price of their key export commodities – they may fall further.
Central Bank Policy
The chart below shows the evolution of BoC and RBA policy since 2008. Australian rates are on the left hand scale (LHS), Canadian on the right:-
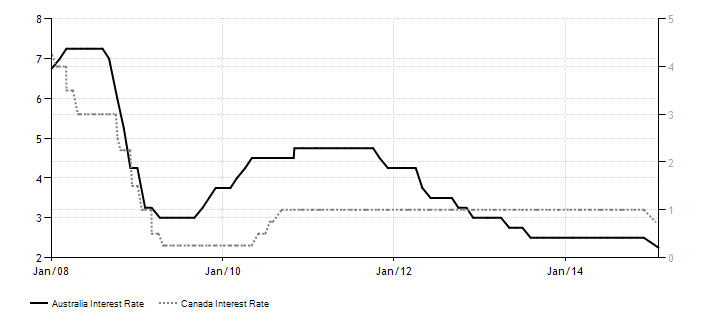
Source: Trading Economics
To understand the sudden change in currency valuation it is worth reviewing the central banks most recent remarks.
The BoC expect Oil to average around $60/barrel in 2015. Here are some of the other highlights of the latest BoC monetary policy report:-
The sharp drop in global crude oil prices will be negative for Canadian growth and underlying inflation.
Global economic growth is expected to pick up to 3 1/2 per cent over the next two years.
Growth in Canada is expected to slow to about 1 1/2 per cent and the output gap to widen in the first half of 2015.
Canada’s economy is expected to gradually strengthen in the second half of this year, with real GDP growth averaging 2.1 per cent in 2015 and 2.4 per cent in 2016, with a return to full capacity around the end of 2016, a little later than was expected in October.
Total CPI inflation is projected to be temporarily below the inflation-control range during 2015 because of weaker energy prices, and to move back up to target the following year. Underlying inflation will ease in the near term but then return gradually to 2 per cent over the projection horizon.
On 21 January 2015, the Bank announced that it is lowering its target for the overnight rate by one-quarter of one percentage point to 3/4 per cent.
…Although there is considerable uncertainty around the outlook, the Bank is projecting real GDP growth will slow to about 1 1/2 per cent and the output gap to widen in the first half of 2015. The negative impact of lower oil prices will gradually be mitigated by a stronger U.S. economy, a weaker Canadian dollar, and the Bank’s monetary policy response. The Bank expects Canada’s economy to gradually strengthen in the second half of this year, with real GDP growth averaging 2.1 per cent in 2015 and 2.4 per cent in 2016.
The RBA Statement on Monetary Policy – February 2015 provides a similar insight into the concerns of the Australian central banks:-
…Australia’s MTP growth is expected to continue at around its pace of recent years in 2015 as a number of effects offset each other. Growth in China is expected to be a little lower in 2015, while growth in the US economy is expected to pick up further. The significant fall in oil prices, which has largely reflected an increase in global production, represents a sizeable positive supply shock for the global economy and is expected to provide a stimulus to growth for Australia’s MTPs. The fall in oil prices is also putting downward pressure on global prices of goods and services. Other commodity prices have also declined in the past three months, though by much less than oil prices. This includes iron ore and, to a lesser extent, base metals prices. Prices of Australia’s liquefied natural gas (LNG) exports are generally linked to the price of oil and are expected to fall in the period ahead. The Australian terms of trade are expected to be lower as a result of these price developments, notwithstanding the benefit from the lower price of oil, of which Australia is a net importer.
…Available data since the previous Statement suggest that the domestic economy continued to grow at a below-trend pace over the second half of 2014. Resource exports and dwelling investment have grown strongly. Consumption growth remains a bit below average. Growth of private non-mining business investment and public demand remain subdued, while mining investment has fallen further. Export volumes continued to grow strongly over the second half of 2014, driven by resource exports. Australian production of coal and iron ore is expected to remain at high levels, despite the large fall in prices over the past year. The production capacity for LNG is expected to rise over 2015. Service exports, including education and tourism, have increased a little over the past two years or so and are expected to rise further in response to the exchange rate depreciation.
…Household consumption growth has picked up since early 2013, but is still below average. Consumption is being supported by very low interest rates, rising wealth, the decision by households to reduce their saving ratio gradually and, more recently, the decline in petrol prices. These factors have been offset to an extent by weak growth in labour income, reflecting subdued conditions in the labour market. Consumption growth is still expected to be a little faster than income growth, which implies a further gradual decline in the household saving ratio.
…Prior to the February Board meeting, the cash rate had been at the same level since August 2013. Interest rates faced by households and firms had declined a little over this period. Very low interest rates have contributed to a pick-up in the growth of non-mining activity. The recent large fall in oil prices, if sustained, will also help to bolster domestic demand. However, over recent months there have been fewer indications of a near-term strengthening in growth than previous forecasts would have implied. Hence, growth overall is now forecast to remain at a below trend pace somewhat longer than had earlier been expected. Accordingly, the economy is expected to be operating with a degree of spare capacity for some time yet, and domestic cost pressures are likely to remain subdued and inflation well contained. In addition, while the exchange rate has depreciated, it remains above most estimates of its fundamental value, particularly given the significant falls in key commodity prices, and so is providing less assistance in delivering balanced growth in the economy than it could.
Given this assessment, and informed by a set of forecasts based on an unchanged cash rate, the Board judged at its February meeting that a further 25 basis point reduction in the cash rate was appropriate. This decision is expected to provide some additional support to demand, thus fostering sustainable growth and inflation outcomes consistent with the inflation target.
Real Estate
Neither central bank makes much reference to the domestic housing market. Western Canada has been buoyed by international demand from Asia. Elsewhere the overvaluation has been driven by the low interest rates environment. Overall prices are 3.1% higher than December 2014. Vancouver and Toronto are higher but other regions are slightly lower according to the January report from the Canadian Real Estate Association . The chart below shows the national average house price:-
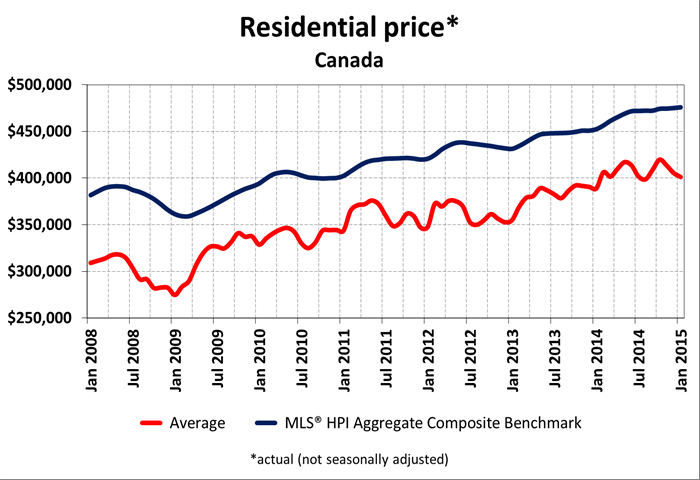
Source: Canadian Real estate Association
The Australian market has moderated somewhat during the last 18 months, perhaps due to the actions of the RBA, raising rates from 3% to 4.75% in the aftermath of the Great Recession, however, the combination of lower RBA rates since Q4 2011, population growth and Chinese demand has propelled the market higher once more. Prices in Western Australia have moderated somewhat due to the fall in commodity prices but in Eastern Australia, the market is still making new highs. The chart below goes up to 2014 but prices have continued to rise, albeit moderately (less than 2% per quarter) since then:-
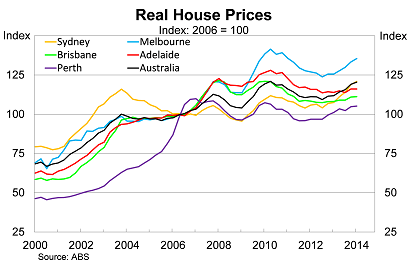
Source: ABS
This chart from the IMF/OECD shows global Price to Income ratios, Canada and Australia are still at the expensive end of the global range:-
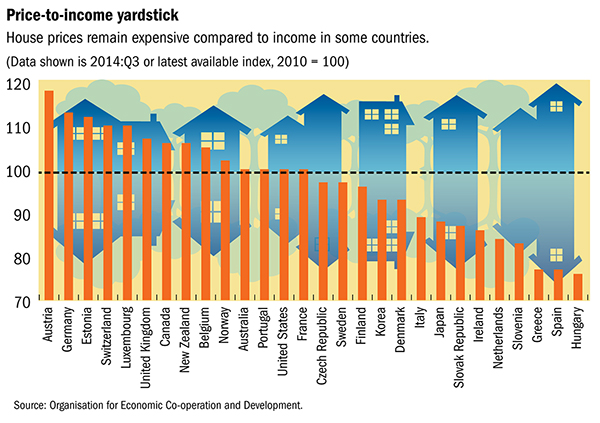
Source: IMF and OECD
The lowering of official rates by the BoC and RBA will not help to alleviate the overvaluation.
Bonds
This chart shows the monthly evolution of 10 year Government Bond yields since 2008 in Australia (LHS) and Canada (RHS):-
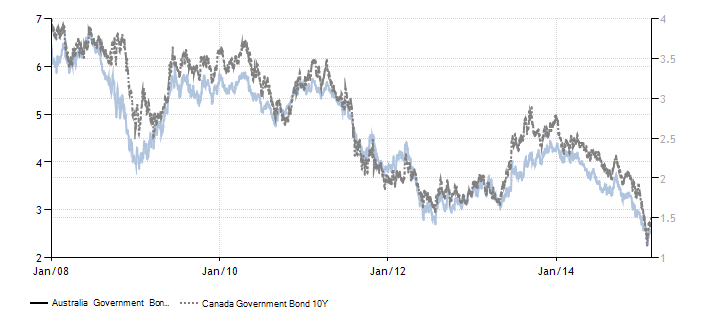
Source: Trading Economics
Whilst the two markets have moved in a correlated manner Canadian yields have tended to be between 300 and 100 bp lower over the last seven years. The Australian yield curve is flatter than the Canadian curve but this is principally a function of higher base rates. Both central banks have cut rates in anticipation of lower inflation and slower growth. This is likely to support the bond market in each country but investors will benefit from the more favourable carry characteristics of the Canadian market.
Stocks
To understand the differential performance of the Australian and Canadian stocks markets I have taken account of the strong performance of commodity markets prior to the Great Recession, in the chart below you will observe that both economies benefitted significantly from the rally in industrial commodities between 2003 and 2008. Both stock markets suffered severe corrections during the financial crisis but the Canadian market has steadily outperformed since 2010:-
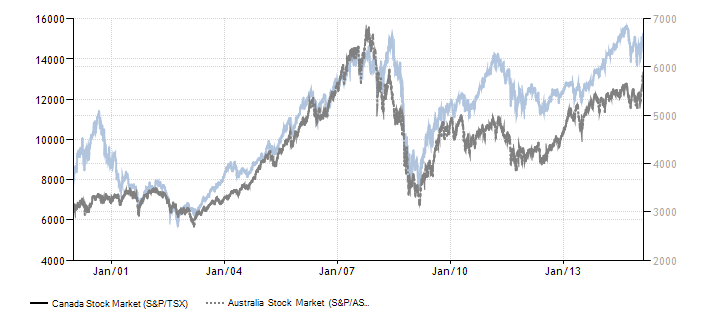
Source Trading Economics
This outperformance may have been due to Canada’s proximity to, and reliance on, the US – 77% of Exports and 52% of Imports. The Australian economy, by contrast, is reliant on Asia for exports – China 27%, Japan 17% – however, I believe that the structurally lower interest rate regime in Canada is a more significant factor.
Conclusions and investment opportunities
With industrial commodity prices remaining under pressure neither Canada nor Australia is likely to exhibit strong growth. Inflation will be subdued, unemployment may rise. These are the factors which prompted both central banks to cut interest rates in the last month. However, both economies have been growing reasonable strongly when compared with countries such as those of the Eurozone. Canada GDP 2.59%, Australia GDP 2.7%.
The BoC has little room for manoeuvre with the base rate at 0.75% but the RBA is in a stronger position. For this reason I believe the AUD is likely to weaken against the CAD if world growth slows, but the negative carry implications of this trade are unattractive.
Canadian Real Estate is more vulnerable than Australia to any increase in interest rates – although this seems an unlikely scenario in the near-term – more importantly, in the longer term, Canadian demographics and slowly population growth should alleviate Real Estate demand pressure. In Australia these trends are working in the opposite direction. Neither Real Estate market is cheap but Australia remains better value.
The Australian All-Ordinaries should outperform the Canadian TSX as any weakness in the Australian economy can be more easily supported by RBA accommodation. The All-Ordinaries is also trading on a less demanding earnings multiple than the TSX.
The RBA’s greater room to ease monetary conditions should also support the Australian Government Bond market, added to which the Australian government debt to GDP ratio is an undemanding 28% whilst Canadian debt to GDP is at 89%. The Canadian curve may offer more carry but the RBA ability to ease policy rates is greater. My preferred investment is in Australian Government Bonds. Both Canadian and Australian 10 year yields have risen since the start of February. The last Australian bond retracement saw yields rise 46 bp to 3.75% in September 2014. Since the recent rate cut yields have risen 30 bp to a high of 2.67% earlier this week. Don’t wait too long for better levels.