![]()
Macro Letter – No 122 – 18-10-2019
Fragility – what the US money-market squeeze means for the future
- Last month’s squeeze in overnight domestic US$ funding rattled markets
- The Fed responded rapidly but the problem has been growing for some time
- Market fragility stems from problems in the transmission mechanism
At the end of October the Federal Reserve are expected to announce the details of their latest balance sheet expansion, this will follow the FOMC meeting. Fed watchers estimate the central bank will buy between $250bln and $330bln of Treasury bills in their effort to provide sufficient reserves to keep the benchmark Effective Federal Funds Rate (EFFR) within its target range. The allocation of liquidity is unlikely to be even, but the Fed has indicated that it will purchase $60bln/month and that they will continue until at least Q2 2020. They are making an unequivocal statement. Let us not forget that it is the traditional function of a central bank, to lend freely against good collateral. The fact that estimates do not exceed $330bln is due to perception that the Fed will not wish the markets to regard these money-market operations as tantamount to QE.
The markets are feverish with speculation, some commentators calling it a further round of QE, despite official statements to the contrary. The money-markets have been unsettled ever since the cash-crunch which occurred in mid-September. For once I concur with the Fed, that this is the management of liquidity via market operations, it is entirely different from the structural effect of longer-term asset purchases. George Selgin of the Cato Institute has coined the acronym SOAP – Supplementary Organic Asset Purchases – nonetheless, this additional liquidity has the effect of expanding the Fed balance sheet and expanding the monetary base. Perception will be all.
Spikes in overnight lending rates are not unusual, especially around tax payment dates, what is unsettling is the challenge the Fed has encountered trying to keep the EFFR within the Fed Funds target range for several days after the initial squeeze. The implementation of SOAP (or whatever they choose to call it) undoubtedly amounts to a further easing of conditions. The Fed may manage expectations by slowly the pace of easing in official rates, after all, what is the point in lowering official rates only to have your good intentions high-jacked by the money-market?
The chart below shows the Fed Fund Effective Rate over the last year (you will note the spike during September): –
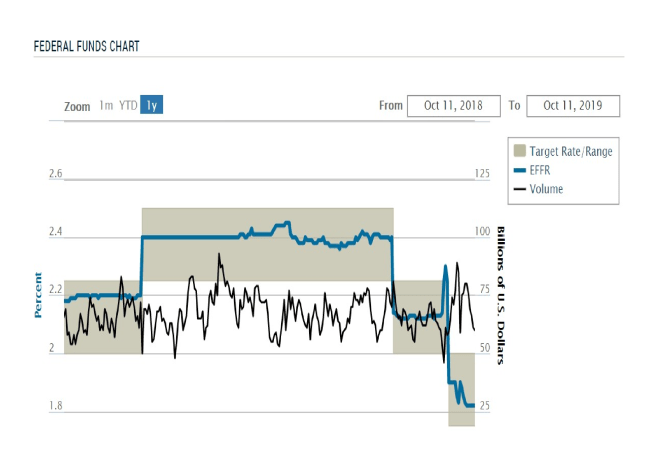
Source: Federal Reserve Bank of New York
At the same time the Secured Overnight Funding Rate (SOFR) spiked more wildly: –
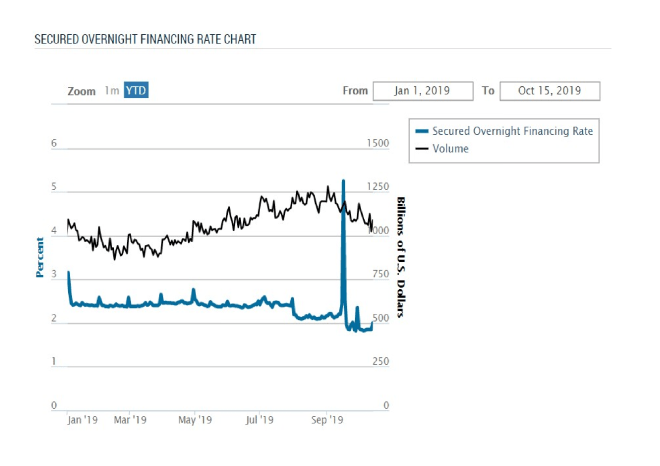
Source: Federal Reserve Bank of New York
It is important to note that, while the EFFR squeezed higher, SOFR actually spiked more than the chart above indicates, rising from 2.19% to 9% on September 17th. The following day the Fed increased its holdings of Repos from $20bln to $53bln, it also officially cut the Fed Funds target rate by 25bp to 1.75%. On Wednesday 18th the Fed Repo balance rose again to $75bln, by Monday 23rd those balances had reached $105bln.
There are numerous theories about the stubbornness of money-market rates to moderate. Daniel Lacalle writing for Mises – The Repo Crisis Shows the Damage Done by Central Bank Policies – observes: –
What the Repo Market Crisis shows us is that liquidity is substantially lower than what the Federal Reserve believes, that fear of contagion and rising risk are evident in the weakest link of the financial repression machine (the overnight market) and, more importantly, that liquidity providers probably have significantly more leverage than many expected.
In summary, the ongoing — and likely to return — burst in the repo market is telling us that risk and debt accumulation are much higher than estimated. Central banks believed they could create a Tsunami of liquidity and manage the waves. However, like those children’s toys where you press one block and another one rises, the repo market is showing us a symptom of debt saturation and massive risk accumulation.
…what financial institutions and investors have hoarded in recent years, high-risk, low-return assets, is more dangerous than many of us believed.
A different opinion about the root of the Repo problem is provided by Alasdair Macleod, also writing for Mises – The Ghosts of Failed Banks Have Returned: –
The reason for its failure has little to do with, as some commentators have suggested, a general liquidity shortage. That argument is challenged by the increase in the Fed’s reverse repos from $230bn in October 2018 to $325bn on 18 September, which would not have been implemented if there was a general shortage of liquidity. Rather, it appears to be a systemic problem; another Northern Rock, but far larger. Today we call such an event a black swan.
The author goes on to suggest that a large non-US bank may be the cause of the issue. Inevitably Deutsche Bank’s name is mentioned.
I believe the issue stems from a number of different factors. Firstly, the Fed is far more central to the banking system today, especially since they elected to pay interest on bank deposits. Secondly, the banks have been wary of lending to corporates, or to one another, they are therefore more beholden to the Fed. Finally, the void created by the banks refusing, or being unable, to lend to the real economy has been filled by private capital, provided by hedge funds, money market funds and synthetic ETFs – these latter instruments have balances in excess of $4trln.
These new sources of funding cannot access the SOFR market directly, they must intermediate with the 24 broker-dealers with whom the Fed transact open market operations. Any hint of a bank being in difficulty will see these shadow-bankers move assets from that institution rapidly, causing the institution concerned (if it can) to make a dash for the Repo market and the succour of the Fed.
Macleod suggests other factors which might have contributed to the SOFR squeeze, including: –
…Chinese groups are shedding $40bn in global assets… domestic funding requirements faced by Saudi Arabia in the wake of the attack on her oil refining facilities, almost certainly being covered by the sale of dollar balances in New York.
…with $307.9bn withdrawn in the year to July, foreign withdrawals appear to be a more widespread problem than exposed by current events.
Enough of speculation, the official explanation is contained in this article from the Chicago Fed – Understanding recent fluctuations in short-term interest rates: –
Two developments in mid-September put stress on overnight funding markets. First, quarterly tax payments for corporations and some individuals were due on September 16. Over a period of a few days, these taxpayers took more than $100 billion out of bank and money market mutual fund accounts and sent the money to the U.S. Treasury. Second, the Treasury increased its long-term debt by $54 billion by paying off maturing securities and issuing a larger quantity of new ones. (A reduction in short-term Treasury bills outstanding partly offset the increase in long-term debt.) Buyers of the new debt paid for it by withdrawing money from bank and money market accounts. Combined with the tax payments, the debt issuance reduced the amount of cash in the financial system.
At the same time as liquidity was diminishing, the Treasury debt issuance caused financial institutions to need more liquidity. A substantial share of newly issued Treasury debt is typically purchased by securities dealers, who then gradually sell the bonds to their customers. Dealers finance their bond inventories by using the bonds as collateral for overnight loans in the repo market. The major lenders of cash in that market include banks and money market funds—the very institutions that had less cash on hand as a result of taxpayers’ and bond buyers’ payments to the Treasury.
With more borrowers chasing a reduced supply of funding in the repo market, repo interest rates began to rise on September 16 and then soared on the morning of September 17, reaching as high as 9% in some transactions—on a day when the FOMC was targeting a range of 2% to 2.25% for the fed funds rate.
Pressures in the repo market then spilled over to other markets, such as fed funds, as lenders in those markets now had the option to chase the high returns available in the repo market. In addition, when banks experience large outflows as a result of tax payments or Treasury issuance, they may seek to make up the money by borrowing overnight in the fed funds and other markets, putting additional pressure on rates there. The fed funds rate reached 2.25%, the top of the FOMC’s target range, on September 16 and 2.30% on September 17.
Here, is a chart showing the change in SOFR and EFFR over the last five years (you will notice that on none of these charts does the transaction struck at 9% ever appear – perhaps they do not want to frighten the horses): –
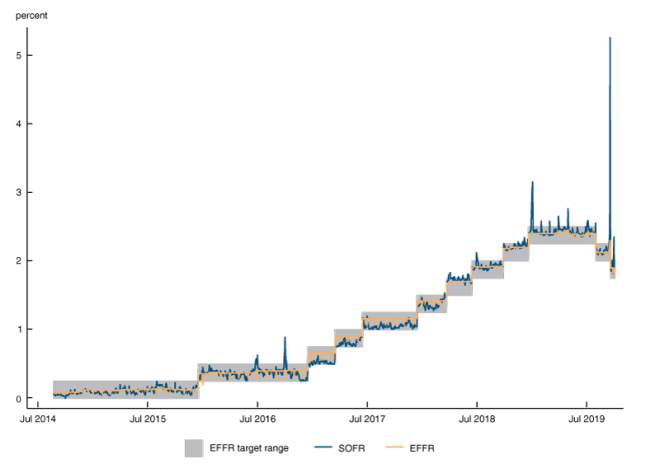
Source: Chicago Federal Reserve Bank
In their discussion of how the Fed responded (on September 17th) to the squeeze the authors point out: –
…the (Fed) Desk offered $75 billion in repos, primary dealers bid for only $53 billion. On the margin, this meant that primary dealers were forgoing the opportunity to borrow at the operation’s minimum bid rate of 2.1% and lend money into repo markets that were still trading at much higher rates. This outcome suggests that there could be some limits to primary dealers’ willingness to redistribute funding to the broader market.
They suggest that this may be a function of the level of leverage already in the banking system. By September 19th the Fed were compelled to lower the interest rate on excess reserves – IOER. Finally the relationship between EFFR and SOFR returned to its normal range.
According to the authors the Fed have learnt from their hysteresis that adjustments to the IOER are also critical to control of money-markets, repo operations may not be sufficient in isolation. The chart below shows the spread between SOFR and IOER: –
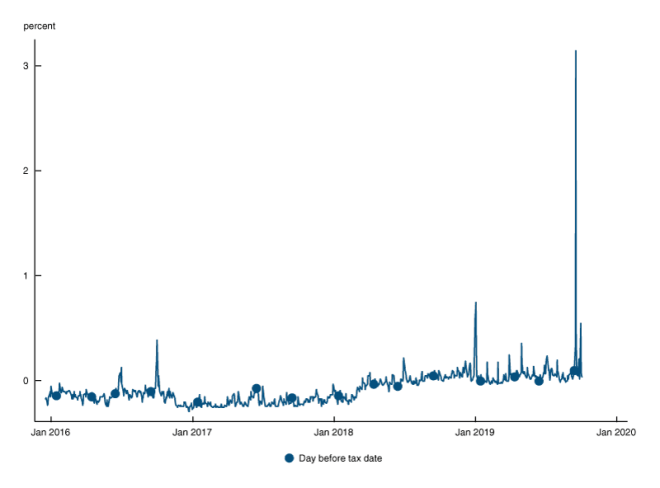
Source: Chicago Federal Reserve Bank
This is how the Fed describes the evolution of the relationship (the emphasis is mine): –
When the repo rate is below the interest rate on reserves, as it generally was from 2015 through March 2018, the supply of liquidity is so great that Treasury securities are very easy to finance and have a lower effective overnight yield than reserves. From March 2018 through March 2019, repo rates were generally very close to the interest rate on reserves. Then, beginning in the second quarter of 2019, repo rates ticked above the interest rate on reserves. Around the same time, money market rates started to exhibit slightly more upward pressure near tax payment deadlines. Most recently, just before the volatility in mid-September, the spread between SOFR and IOER on September 13 was the highest yet on the business day before a tax date in the period since the FOMC began normalizing monetary policy in late 2015.
This confirms my suspicion that since the financial crisis the Fed (and central banks in general) have become far more central to the smooth functioning of the financial markets. Actions such as QE are clear, the function of the lender of last resort is less so. Professor Perry Mehrling’s – The New Lombard Street (published in 2010 the wake of the financial crisis) discusses the changed role of the Fed in detail, it is well worth re-reading.
Conclusions
I normally end my newsletters with an investment proposal. This time my advice is of a different nature. During the financial crisis central banks saved the global financial system, but, as last month’s’ SOFR Squeeze makes clear, the patient is still on life support. The solution to too much debt has been the reduction of interest rates, but, because lower rates make debt financing easier, this has led to an even greater system-wide burden of debt. In the process the role of the central bank has become far more pivotal. They have reaped what they sowed, the financial markets still function, but they remain inherently fragile. If the Fed analysis of the reasons for the price spike are correct, a relatively small imbalance may, on another occasion, derail the entire market.
The advice? Batten down the hatches, maintain excess liquidity and prepare for the next stress-test of the overnight lending market.